EURCHF new bullish expected
OANDA:EURCHF trend based analysis, we are have strong bullish push, currently price in BULLISH FLAG pattern, from here expecting new bullish push
SUP zone: 0.93100
RES zone: 0.93950, 0.94150
X-indicator

BTCUSD – 30m | Bearish Continuation SetupBITSTAMP:BTCUSD
After multiple failed attempts to hold the upper range, BTC created a sharp breakdown with momentum. The current market behavior shows liquidity sweep and retest behavior, keeping the downside outlook intact as long as price stays below the 88,561 level.
Key Scenarios
❌ Bearish Case (Primary Bias)
If price rejects near 88,561–86,500, we may see continuation toward:
🎯 Target 1: 85,263
🎯 Target 2: 82,296
🎯 Target 3 (extended): 80,545 liquidity zone
✅ Bullish Case (Invalidation)
A clean break and hold above 88,561 may shift momentum upward.
Current Levels to Watch
Resistance 🔴: 88,561
Support 🟢: 85,263 → 82,296 → 80,545
⚠️ Disclaimer: This analysis is for educational purposes only. Not financial advice

Will this idea play out??? 30 Year Mortgage rates to 4.5%!Trump has been begging for a rate cut and with new FED leadership on the way and technical analysis correlating I think lower rates are very possible in 2026-2027.


Statistical Setup Suggesting Upside ContinuationWe’ve already seen more intraday movement than on most days, which reduces the probability of further downside continuation and favors consolidation or ranged behavior within current extremes. Historically speaking, the weekly and monthly opens have seen additional wicking in over 90% of cases. Moreover, around 80% of weekly first pivots were established on Monday or Tuesday. Based on this BTC data, the probability currently favors an upside move targeting the area around the weekly/monthly open or high, despite that level appearing initially unlikely.

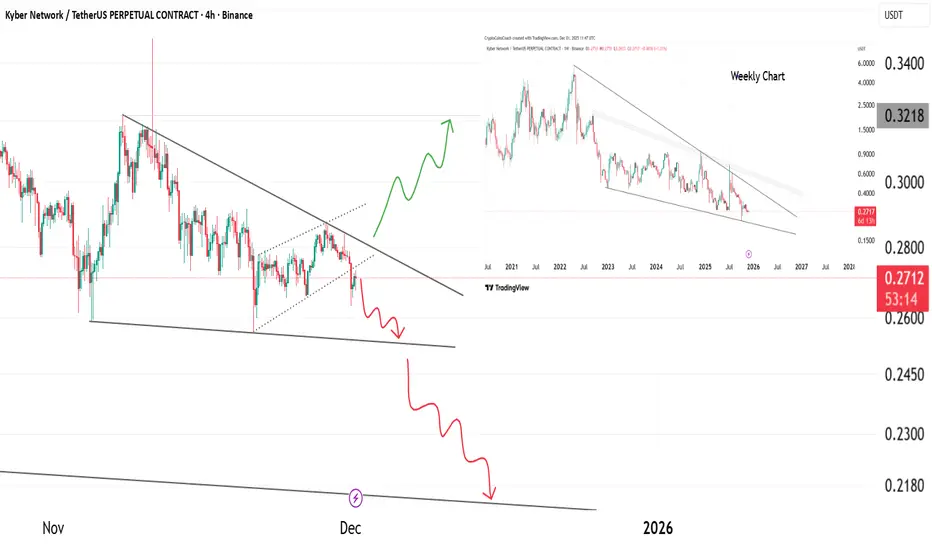
KNC At The Edge Of A Multi Year Break – Big Move LoadingKNC is currently trading inside a broad falling channel that has been developing for several years. Price is now approaching the lower boundary of the structure, an area that has historically produced strong reaction moves.
The recent breakdown on the lower timeframe aligns with the weekly falling wedge, which suggests that volatility may expand in the coming sessions. As long as price holds above the long term support zone, the possibility of a recovery wave remains active.
The market is at a decision point . A reclaim of the local trendline would support a bullish cycle toward the upper resistance band. Failure to hold this zone, however, may push price deeper into the macro support line before a larger reversal attempts to form.
Key Notes:
• Price is approaching multi year demand inside the falling channel
• Weekly timeframe supports the potential for a major reversal
• Lower timeframe shows a compression that can break either direction
• Volatility will expand once the structure resolves
• Trendline reclaim opens room for a bullish continuation
Invalidation : A clean breakdown below the macro lower trendline removes the bullish recovery scenario.
Simple View : KNC is sitting at a macro support zone. A bounce can trigger a meaningful recovery, but losing this area would expose deeper downside. This is a region to watch closely.
NAS100 – Price Rebounds but Faces a Strong Supply Zone AheadNAS100 has recovered from recent lows with steady upward momentum, but price is approaching a key supply zone around 26,050 – 26,150, an area where strong selling pressure previously reversed the market.
As long as price remains below this zone, bullish continuation may be limited. A clean breakout and consolidation above 26,150 would open the door for further upside, while rejection from this level could trigger another corrective move back toward 25,200 – 25,000.
For now, NAS100 is in a recovery phase but still trading below major resistance.

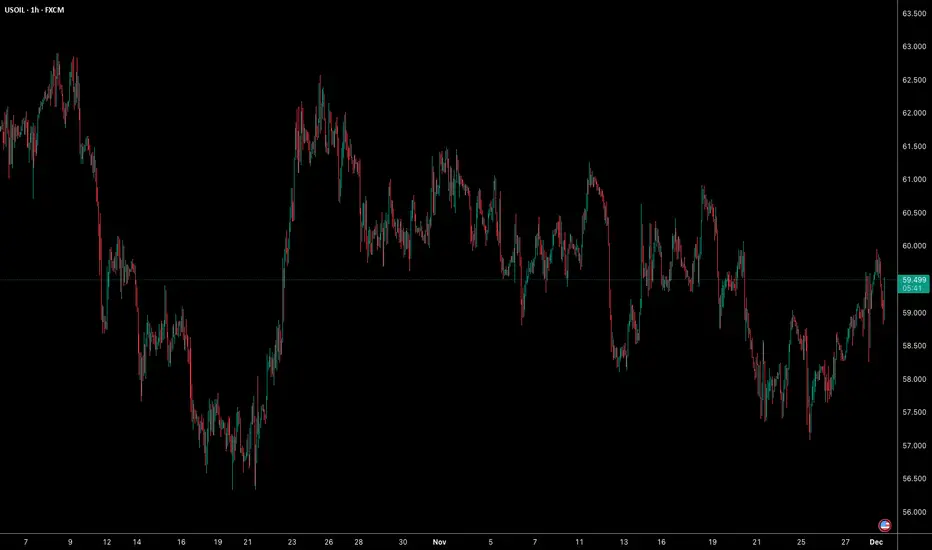
USOIL – Consolidation With No Clear Direction YetUSOIL remains trapped in a wide consolidation range, with price oscillating between 58.00 and 61.00 for several sessions. Buyers have stepped in near the lower boundary, but momentum continues to fade each time price approaches the upper zone.
Currently, the market sits near the mid-range, offering little directional bias until a clean breakout occurs. A move above 61.00 could shift sentiment bullish, while a breakdown below 58.00 may reopen the path toward recent lows.
For now, USOIL is neutral and ranging patience is key until the market picks a direction.
XAUUSD – Key Levels in PlayGold continues its climb and is now retesting a major resistance zone near 4,250, where price has reacted multiple times in the past. Buyers are showing strength, but this area remains a critical decision point.
A clean breakout above 4,250 could open the door toward higher highs, while rejection here may trigger a pullback toward 4,150–4,100.
The main support to watch sits much lower around 3,900, a level that previously held a strong reversal.
Momentum is bullish, but price is pressing directly into a high-interest zone where volatility tends to increase.

Gold Technical Analysis: Strong Opening in December, Bullish TreGold Technical Analysis: Strong Opening in December, Bullish Trend Clear
🔍 Fundamental Background
On the first trading day of December, gold continued its upward momentum from the end of last week, rising steadily after the opening and currently trading around 4250.✨ Market focus remains on expectations for Federal Reserve policy. Despite the possibility of a change in leadership, the environment of interest rate cuts still provides medium- to long-term support for gold.💪 If subsequent economic data is favorable, gold prices are expected to further open up upward space.🚀
📊 Technical Analysis
Multi-timeframe trend resonance indicates bullishness:
Daily and Weekly Charts: Both show a very strong bullish alignment.📶 The daily chart awaits a breakout above the upper Bollinger Band to form a one-sided trend, with the key previous high target around 4380.🎯
4-Hour Chart: Bollinger Bands are widening upwards, the moving average system is in a bullish alignment, and the structure is intact.✅ This indicates that the current market is in a strong upward phase.🔥
Key Levels:
Support Zones: 4205-4210🛡️, 4175-4180🛡️
Resistance Zones: 4250-4255⛰️, 4300⛰️, 4350-4380🚩
🎯 Trading Strategy: Maintain a strategy of primarily buying on dips, with shorting on rallies as a secondary approach. While the trend is strong, avoid chasing highs⚠️. Waiting for pullbacks to key support levels to establish long positions is more prudent💎. Closely monitor intraday price action; if a deep pullback occurs, reassess the trend's continuation🔁.
⚠️ Risk Warning
Strictly set stop-loss orders and avoid over-leveraging!
Pay close attention to the immediate impact of Federal Reserve news on the market📢
If the price breaks below the 4170-4180 support zone, the short-term trend may shift to a range-bound pattern⚠️
💬 Welcome to discuss real-time market trends and strategy updates
For more real-time analysis and specific entry/exit points, please join our discussion group for daily market insights and trading opportunities📈.

EURUSD – Quick AnalysisEURUSD has recovered strongly from last week’s lows, forming a clean higher-low structure and breaking through short-term resistance around 1.1600.
This upward momentum shows renewed bullish interest, supported by sustained buying pressure throughout the week.
Price is now testing the 1.1650 zone, a level that previously acted as resistance. A confirmed break and hold above this area could open the door toward 1.1700.
However, failure to sustain above 1.1600 may trigger a pullback as buyers lose strength.
For now, the bias leans bullish, but the pair is approaching a key reaction zone.

BTCUSD – Quick AnalysisBitcoin faced strong rejection from the 90,800 – 89,200 USD supply zone, a level that had already acted as resistance before.
This rejection triggered a sharp bearish move, breaking intraday structure and pushing price down toward the 85,500 – 84,800 USD support area.
As long as BTC remains below the supply zone, bearish pressure continues to dominate. A meaningful recovery would only be validated if price can reclaim and hold above 89,000 USD with confirmation.
For now, the bias remains bearish, with room for further downside if current support fails.

GBPUSD Short/SellA HSC confirmation has formed as NY session begins to open. Additionally, the market also taps the MHNL of November. In parallel, DXY continues to trend downward to tap both (P Line + MHNL of November). Stronger confluences. Chances of a reversal is high.

Bitcoin Daily Heiken Ashi does not lead to short term confidenceBitcoin Daily Chart showing VRVP on the right. The lines mentioned below can offer Resistance, Support.
Horizontal Dashed Yellow - Value Area High VAH currently around 128K usdt
Horizontal Dashed Red - Value area Low VAL currently around 95K usdt
Horizontal Dotted Red line - POC, Point of control currently around 110k usdt
Horizontal Dashed Blue line - Current ATH
The Red diagonal "line " is part of a 236 Fib circle that often provides strong resistance and, on this occasion, has rejected Pa ever since the current ATH.
PA is getting Squeezed between this and that 2.414 Fib Extension, forming a pennant with an apex around 4 Dec.
PA ALWAYS REACTS BEFORE THE APEX so I do expect a sharper move from PA by the end of the 3rd Dec.
The possibility does exist that the Bulls will make a stand and PA, rarely, may just range through this but that would then, at least , take us to the other side of that Fib circle and Offer hope that we Remain above that circle.
But, For me, I am sideing with a Drop lower, maybe to that next Fib Extension at around 78500.
This will scare some people and knowing the direction after that is hard to tell.
As yet, I have not seen many signs of short term recovery But..........
The Daily MACD is VERY OverSold and has the room to recover.
But shorter Term, the 4 hour MACD is still falling BEARISH and has room to drop further
.
So, as mentioned in a number of posts, This month is the KEY to telling where we are...Bull or BEAR.
But I think dynamics have changed and the time ay have arrived were we look at Bitcoin PA in a different Way
We Wait.......
This is Bitcoin

XAUUSD: possible scenario🛠 Technical Analysis: On the 4-hour timeframe, Gold is trading above the upper boundary of a large symmetrical triangle, where a "false breakout" scenario appears to be developing near the critical resistance at 4,250. The analysis anticipates a failure to sustain price action above this level, signaling a "bull trap" that could trigger a sharp reversal back within the triangle structure. A confirmed rejection here opens the path for a decline toward the immediate support at 3,917, with a medium-term objective at 3,700.
🌍 Fundamental Analysis: As full market liquidity returns following the US Thanksgiving holiday, the risk of volatility spikes and "fake-outs" remains high. Investors are turning their attention to this week's key US economic indicators, particularly today's ISM Manufacturing PMI and Friday's Non-Farm Payrolls (NFP) report. Any signs of US economic resilience could boost the Dollar and yields, weighing heavily on non-yielding assets like Gold and validating the technical rejection.
❗️ Trade Parameters (SELL) ❗️
➡️ Entry Point: Sell on confirmed return inside the triangle (approx. 4,140)
🎯 Take Profit: 3,917, medium-term target at 3,700
🔴 Stop Loss: Above the recent swing high/possible false breakout peak (approx. 4,350)
⚠️ Disclaimer: This is a potential trade idea based on current analysis; market conditions and price direction are subject to change based on news factors and volatility.

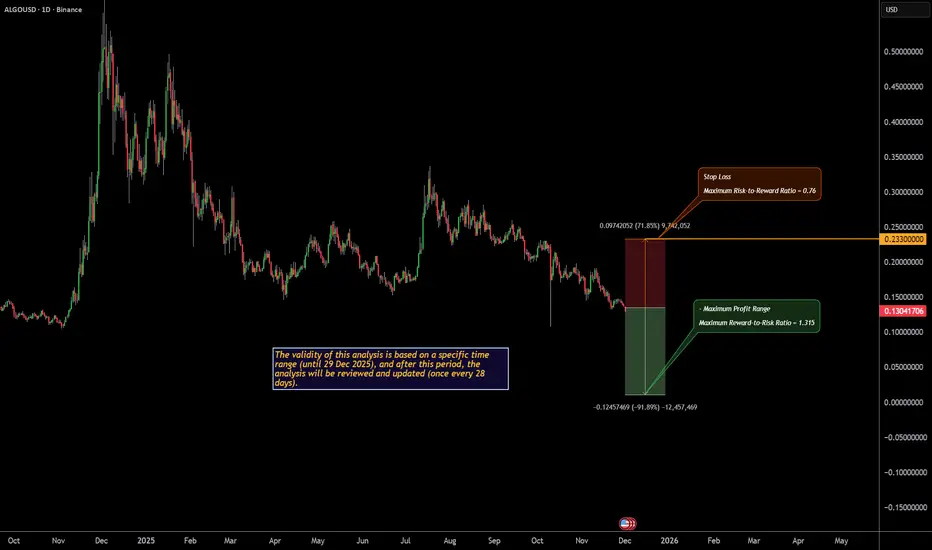
Monthly Crypto Analysis: Algorand (ALGOUSD) – Issue 109 The analyst expects Algorand's price to decline by the specified end time, based on quantitative analysis.
The take-profit level only highlights the potential price range during this period — it’s optional and not a prediction that the market will necessarily reach it.
You don’t need to go all-in or use leverage to trade wisely.
Allocating just a portion of your funds helps keep overall risk low and ensures a more sustainable approach.
Our strategy is built on institutional portfolio management principles, not the high-risk, all-in trading styles often promoted on social media.
Results are evaluated over the entire analysis period, regardless of whether the take-profit level is reached.
BTC Bear Market AnalysisBitcoin confirms bear market with monthly MACD turning red, echoing past downturns. Price slid to ~$86K, down 4.55%, mirroring 2022 trajectory post-FTX with 16-17% November losses.
Key Bearish Signals
Bear flag breakdown targets $66.8K; immediate supports at $85.5K-$82K.
Lower highs/lows, EMAs sloping down, bearish engulfing on daily.
Whales distributing, weak ETF demand fuel deeper retests
#BearMarket #Bitcoin #TradingSetup


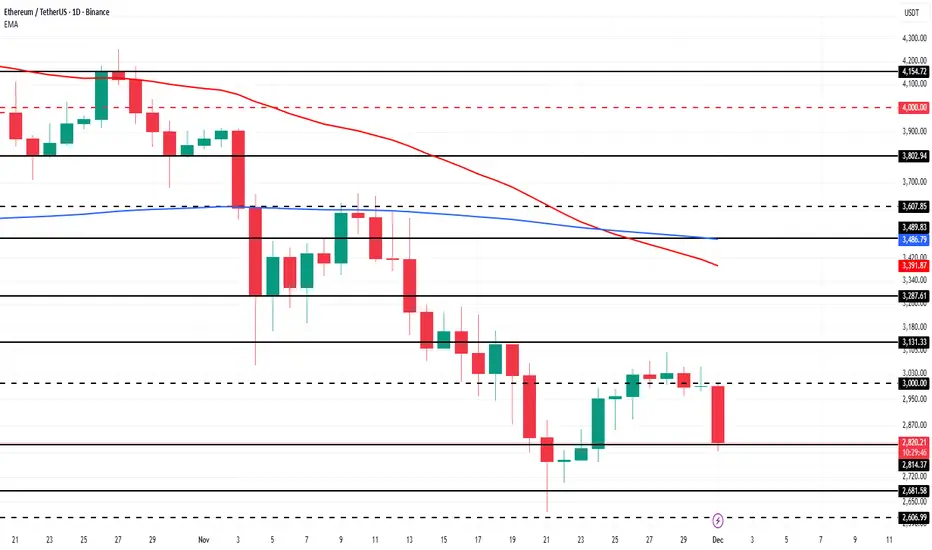
3 Altcoins To Watch In The First Week Of December 2025Ethereum is a key altcoin to monitor this week as it approaches the Fusaka upgrade, scheduled to go live on December 3. This marks its second major upgrade of the year following Pectra and aims to strengthen the network’s long-term scalability.
Fusaka is designed to help Ethereum support high transaction throughput from layer-2 chains by implementing 12 Ethereum Improvement Proposals. The upgrade could lift ETH from its $2,814 support level toward $3,000. Reclaiming that level is essential for a push toward $3,131 and a broader recovery.
If bearish momentum continues and Ethereum reacts negatively to the ongoing Death Cross indicated by its EMAs, ETH may lose support. A fall below $2,814 could send the price toward $2,681, invalidating the bullish thesis and signaling deeper downside risk.
price reductionWe can predict a price decline to the support floor in the inverted triangle pattern.

Bullish Rebound at $1.1590! Is the Next Major Breakout Imminent?🚀 EUR/USD: Bullish Rebound at $1.1590! Is the Next Major Breakout Imminent? (15-Minute Analysis)
✍️ Attractive Description
The Euro/US Dollar (EUR/USD) pair is at a critical juncture! Following an initial surge that marked a strong Break of Structure (BOS) and tagged the $1.1615 high, the price has executed a healthy Pullback to the key $1.1590 support level.
The market is currently respecting this crucial support zone, signaling that Buyers remain active and engaged. The previous $1.1607 breakout level has now reverted to immediate resistance, creating a clear battleground.
What's Next?
Bullish Scenario: If the price holds above $1.1590, we can anticipate a move to challenge and break the $1.1607 resistance, aiming to re-challenge the recent high of $1.1615.
Immediate Safety Net: The $1.1590 level is the last line of defense for the buyers. A break below this support would suggest potential weakness in the immediate trend.
Why This Chart Matters: This is a classic BOS and Retest scenario, potentially building momentum before a larger, sustained Bullish Move. Keep your eyes glued to $1.1607—that is the next door the market needs to unlock!

Runtime Error- Rapid ORB ProIf you facing this issue. please go the video this will solve the issue. this is just a memory buffer limitation. We just need to reset the buffer.

Can Gold Reach $4300? Strategy Update, Please Check BackRising market expectations for a Fed rate cut are a key driver of gold's rise. Simultaneously, ongoing global political and geopolitical risks have further increased demand for gold as a safe haven. Overall, gold's upward momentum has strengthened after a previous moderate rise, suggesting the possibility of further gains.
The upside resistance for gold can be seen around $4250-60, near the upper Bollinger Band on the daily chart. This is also near the intraday high. The 4-hour chart shows significant resistance in this area. Only a break above this level could lead to the $4290-4300 psychological level, which is near the upper Bollinger Band on the monthly chart. If the bulls fail to break through effectively during the US session, shorting at higher levels remains the preferred strategy.
For gold, during the European and American sessions, we need to pay attention to support levels: the first is $4215-25, where buying in batches is possible. Strong support lies at $4210. If this price level holds, we maintain a bullish outlook. Blindly chasing the upward trend is unwise. Trading based on structure and key points is crucial for consistent and stable growth.
For gold this week, if the initial upward momentum continues, reaching 4300 shouldn't be difficult, and many are already accepting this. The expected target for this week's rise is 4290-4300. The market is constantly changing; be a follower, not a die-hard. The strategy has been updated again. If you need to recover significant losses or obtain accurate trading signals, find the channel entry and contact me. Let's work together to flexibly and steadily pursue higher profits in the ever-changing market!
