ETH.D -- A Return AttemptCRYPTOCAP:ETH.D
ETH dominance is forming a clean higher-low and gradually working its way back toward the 15% zone — the same area where the previous drop began.
As long as it holds above the support, the recovery remains healthy.
A clear push above 15% would mark a real trend shift, while losing support would flip the outlook.
X-indicator

Fed cuts rates. Where do we go next?Rate cut of 25bps as expected but where do we go from here?
The S&P is attempting to break out into new all time highs but as we’ve seen recently, there doesn’t seem to be enough buy side liquidity or buyer conviction to push the market into a new leg up. Until we see a catalyst to take it higher I would expect more chop.

Continue cutting interest rates. Prices still have room to rise.Influenced by the Federal Reserve's interest rate cuts, gold is currently exhibiting a rollercoaster-like price action, first pulling back and then rising, highlighting the recent volatile and choppy market pattern.
From a technical perspective, gold prices have stabilized above the key psychological level of $4200 on the daily chart, maintaining short-term bullish momentum.
On the 1-hour chart, the $4220-$4245 area still presents upward resistance, while support has moved up to around $4190, confirming the effectiveness of the lower boundary of the previous $4170-$4165 range. There are still opportunities to go long at this stage, with short-term support levels to watch at $4185 and $4190.
Quaid believes that although the previous gold rally was largely based on predictions of a Fed rate cut, the market still has the potential for a slight upward move after the data release. With two hours remaining before the US market closes, conservative traders can wait for a pullback to around $4200 to enter long positions; aggressive traders can enter long positions at the current price of $4210, with a profit target around $4230. More trading information will be updated in the channel.

USDCHF Sell Setup [1D]
Macro News
USD/CHF remains under pressure as rate cuts weigh on the dollar. In contrast, the Swiss National Bank continues to hold rates steady at 0% and benefits from sustained safe-haven demand for the franc. This divergence keeps the broader bias tilted toward CHF strength.
Technicals
The pair has traded within a defined channel for several months. The price was recently rejected at the top of the channel, forming a clear bearish candlestick. This rejection signals renewed downside momentum, with price likely to move toward the lower boundary of the channel near 0.7887. The RSI is moving down as well and just crossed below the 50 level.
Strategy
A short bias is appropriate following the channel-top rejection. Positioning on minor pullbacks while targeting the lower boundary around 0.7887 aligns with the current technical structure.
Risk
Interventions by SNB are possible, but the short-term looks stable. SL above the channel or use hedging.

Gold Intraday Trading Plan 12/11/2025Gold indeed rose yesterday, not from 4096 but from 4082 due to interest rate decision. And it closed the day above 4225. It successfully broke 4220 resistance. I will buy from 4220 to first tart 4250 and ultimate target 4270 for today.

BTCUSDT SHORT📌 BTCUSD — Institutional Daily Analysis (MPI + ICT Framework)
(Professional Smart Money Market Breakdown)
1️⃣ Higher Timeframe Context
Bitcoin is currently trading inside a bearish dealing range:
Range High: 107,448 (Buy-side liquidity)
Range Low: 80,600 (Sell-side liquidity)
Within this range, price is in a retracement phase, not a reversal.
2️⃣ Market Structure (HH → LH → LL → MSS)
The structure confirms a bearish environment:
HH → LH → LL = bearish sequence
Liquidity sweep below
Internal swing high taken → MSS (Market Structure Shift)
This MSS indicates the start of retracement — not a trend reversal.
3️⃣ Internal Liquidity (94k–96k)
Price cleaned internal liquidity inside the 94k–96k range and confirmed
the internal dealing model (IDM).
This created the engine for a move into premium.
4️⃣ Premium Retracement Targets (FVG + OTE)
Institutional order flow suggests price will seek higher inefficiencies:
0.618 retracement: 97,190
0.705 OTE (Institutional Entry): 99,533
Daily FVG #1: 98k–100k
Daily FVG #2: 101k–103k
Possible sweep zone: ~100k
These are liquidity magnets before any major reversal.
5️⃣ Rejection Zone — Institutional Selling Area
A high-probability sell setup sits in the premium zone:
Daily FVG
0.705 OTE
Old support → new resistance
Breaker + inefficiency cluster
This area is the most likely region for a bearish rejection.
6️⃣ Higher Timeframe Draw-on-Liquidity
Once rejection occurs, institutional flow favors lower targets:
TP1: 80,600 (Range Low)
TP2: 76,000 (HTF imbalance)
TP3: 72,300 (Weekly EQ Low – March 2024)
Sell-side liquidity zone: 72k–76k
This zone is the long-term liquidity objective.
7️⃣ Summary
📉 Trend remains bearish
📈 Current move = retracement into premium, not reversal
🎯 Premium zone (98k–103k) = institutional sell area
🔥 Long-term targets: 72k–76k sell-side liquidity
This structure follows the classic ICT + MPI roadmap:
Sweep → MSS → Retracement → Premium → Rejection → Expansion Lower

TRX: Bullish with high confidenceHey guys, let's break down what's happening with Tron on the 1-hour timeframe because we're seeing some textbook oversold conditions that could set up a solid mean reversion play.
TRX is currently trading at $0.2772, down 1.29% over the last 24 hours and sitting dangerously close to the daily low at $0.2767. The price action has been grinding lower throughout the session, but what's really catching my eye is the confluence of extreme oversold readings across multiple momentum oscillators. RSI has crashed to 19.2, Stochastic is pinned at 9.7, and Money Flow Index is absolutely wrecked at 11.3 - these are capitulation-level numbers that we don't see every day.
When you get RSI below 20 and Stochastic under 10 simultaneously, you're typically looking at selling exhaustion rather than the start of a fresh breakdown. The ADX reading of 59.1 confirms we're in a strong trending environment, but here's the thing: strong trends paired with extreme oversold conditions often mark the final flush before a bounce. Price is literally kissing the lower Bollinger Band at $0.2766, which has been acting as a technical support floor. The 4.5% lower wick on recent candles tells us buyers are already starting to defend these levels, even if hesitantly.
From a moving average perspective, the picture is clearly bearish. TRX is trading below the EMA20 ($0.2795), EMA50 ($0.2811), and EMA200 ($0.2825), with a confirmed lower high formation that validates the downtrend structure. The HMA55 sits at $0.2795, creating a resistance cluster right around that EMA20 level. This convergence zone between $0.2795 and $0.2801 (Bollinger middle band) is going to be your first major hurdle on any bounce attempt. The MACD remains bearish with the histogram negative (MACD at -0.0011, Signal at -0.0008), so we're definitely fighting against the prevailing momentum here.
But here's where it gets interesting: volume analysis is showing a completely different story. Current volume sits at just $3.26M compared to the 24-hour average of $8.43M - that's only 39% of normal activity. When you see price making new lows on significantly below-average volume, it's a red flag that the move lacks conviction. Sellers aren't piling in with force here; instead, we're seeing passive drifting lower, which often precedes reversals. The 24-hour volume of $64.7M is decent, but the intraday weakness in participation suggests this decline is running on fumes.
Let's talk support and resistance levels because these are critical for framing any trade setup. Immediate support is the 24-hour low at $0.2767, which coincides almost perfectly with the lower Bollinger Band at $0.2766. This is your line in the sand - hold here and we're looking at a bounce; break below with volume and the oversold condition could extend further (though that seems less likely given current momentum exhaustion). On the upside, first resistance is that EMA20/HMA55 cluster at $0.2795, followed quickly by the Bollinger middle band at $0.2801. These levels will likely act as magnets for any mean reversion move.
Beyond that initial resistance zone, the EMA50 at $0.2811 and EMA200 at $0.2825 represent more substantial barriers. The EMA200 in particular is significant because it's been capping rallies and would mark a full retracement of today's decline. The 24-hour high at $0.2834 sits just above that and represents the upper boundary of today's range - breaking above that would flip the short-term structure and potentially signal a trend reversal rather than just a bounce.
For a trading setup, I'm favoring a counter-trend long position here with tight risk management. Entry zone would be in the $0.2770 area, essentially current price levels while we're testing support. Your stop loss needs to be tight given we're fighting the trend - I'd place it below $0.2760 to give about 10 pips of breathing room below the support cluster. That's roughly a $0.001 risk per unit. Take profit targets would be layered: TP1 at $0.2795 (EMA20/HMA55, about 2.5:1 RR), TP2 at $0.2801 (Bollinger middle band, about 3:1 RR), and TP3 at $0.2825 (EMA200, roughly 5.5:1 RR) for those wanting to ride extended bounces.
The risk-reward here is favorable if you're disciplined with your stops. This isn't a high-conviction trend-following setup - it's a tactical mean reversion play based on extreme oversold conditions and weak selling volume. The confidence level sits around 73%, which reflects the fact that we're trading against the prevailing trend but with strong technical justification from momentum indicators. You're essentially betting that the rubber band has stretched too far and needs to snap back toward the mean.
One scenario to watch: if we do get that bounce to the $0.2795-$0.2801 zone and price gets rejected hard with increasing volume, that would actually be a great short setup for continuation lower. But right now, at these oversold levels with price testing support, the path of least resistance for a short-term move appears to be up rather than down. The bearish structure remains intact on higher timeframes, so this would be a scalp rather than a swing trade - get in, take profits at resistance, and don't overstay your welcome.
What are you thinking on this setup? Are you comfortable fading this weakness for a bounce, or would you rather wait for confirmation above $0.2795 before getting involved?

ES UpdateSee..... I told you to wait for the Fed meeting. Much easier trading this afternoon. Easy money with calls.
Held a few of my calls because RSI has not hit overbought yet. Not sure if it's going to be a pump and dump or just more whipsaw after, but I'm panning on cashing out tomorrow morning (assuming a gap up), and possibly taking Friday off. Made enough money today anyways.
Based on some major stocks like MSFT, V, NVDA, NFLX and META staying red today, I do not anticipate a huge melt up. I'm doing my best to avoid the whipsaw and trading only when I see a good opportunity. Worked pretty well today.

BTC! Watch Out 88150 !RSI Div is obivous !
I'm waiting for 88150.
I'll decide my position at that level with LTF moves.
I'm bearish 70 percent, I beleive so we gonna see 83500 and 80500.

Long $SPXC NYSE:SPXC Looks like a clean breakout on higher volume. Can take a position here with around 8% stop loss.

SPY FOMC STRUCTURE UPDATE — DAILY & WEEKLY VIEW1D Chart (Daily)
SPY held firm following today’s expected rate cut, closing with a strong green candle and maintaining clear structure.
The 10 EMA continues to lead, confirming firm short-term momentum.
OBV trends upward, showing steady buying interest remains intact even through the event volatility.
RSI holds a constructive posture, rising in a controlled manner and avoiding any signs of exhaustion.
ATR remains steady, suggesting volatility conditions are stable and the market is moving in an orderly manner rather than reacting emotionally.
Overall, the daily structure shows that SPY absorbed the FOMC decision smoothly and continues to trend with clarity.
1W Chart (Weekly)
The weekly timeframe continues to support the broader trend strength.
The 10 EMA remains firmly upward, reinforcing long-term structural momentum.
OBV pushes to elevated levels, aligning with consistent accumulation over recent weeks.
RSI sits near 66, showing a healthy, persistent trend without signs of overheating.
ATR compresses further, signaling a maturing trend with reduced volatility as the market digests macro developments.
The weekly chart confirms that the broader trend remains intact and constructive.
⭐ Final Clarity Note ⭐
When major events hit the market—like today’s rate decision—price often trades loud, but structure always speaks quietly and truthfully.
Short-term reactions can mislead, but alignment across timeframes, sustained volume behavior, and steady volatility conditions provide the real signal.
When both the daily and weekly charts continue to show organized progression, it usually reflects a market that’s moving with intention rather than emotion


Crude Oil Fails to Pull Away From This Year’s LowsBroad-based weakness in WTI crude has persisted in the short term, and the price has lost more than 3.5% over the past three trading sessions, bringing it increasingly closer to the 2025 lows around 57 dollars per barrel. For now, selling pressure remains firmly in place, partly because OPEC+, the world’s most influential oil-producing group, continues moving toward higher production levels heading into 2026. Additionally, the possibility of a peace agreement between Russia and Ukraine raises the chance that certain economic sanctions on Russia could be lifted, further increasing the outlook for global supply. As long as expectations of a potential oversupply in 2026 persist, this scenario may continue to exert downward pressure on WTI and act as a key catalyst for sustained selling pressure in the sessions ahead.
Downtrend Remains Firm
For several months, crude oil has been following a consistent downward path, and the current trendline remains strong despite occasional upward corrections that have been insufficient to break it. As a result, this bearish formation remains the most important technical factor to watch. If selling pressure continues to push prices into new lows or keeps them below 60 dollars per barrel, the bearish bias will likely continue to dominate short-term price action.
RSI
At the moment, the RSI line is fluctuating near the neutral 50 level, suggesting a balance between buying and selling impulses in the short term. If this behavior holds, it may give way to a period of price indecision.
MACD
A similar scenario is observed in the MACD, whose histogram remains near the zero line, indicating an equilibrium in short-term moving-average strength. If this pattern continues, it may lead to a period of sustained indecision in WTI over the coming sessions.
Key Levels to Watch:
61 dollars: The most relevant resistance level, aligned with the 23.6% Fibonacci retracement. A bullish breakout above this area could threaten the broader downtrend and open the door to a stronger bullish bias in WTI.
58 dollars: An intermediate barrier aligned with the downtrend line and the 50-period moving average. Price action that remains near this zone may trigger a short-term sideways range, increasing uncertainty in WTI.
57 dollars: This level corresponds to the 2025 lows and currently acts as the most important support. A break below it could confirm a dominant bearish bias and extend the downtrend into the coming sessions.
Written by Julian Pineda, CFA, CMT – Market Analyst

SUPRA 5D – Long-Term Downtrend Testing Key Support ZoneSummary:
SUPRA continues its multi-month downtrend, making lower highs and lower lows since early 2025. Price is currently sitting directly on a major support band around 0.00100–0.00107, a level that has historical relevance on this higher timeframe. With the 35 EMA and 205 EMA both trending sharply downward, the macro structure remains bearish until proven otherwise — but this is also the type of zone where relief bounces often originate.
📉 Market Structure: Clear Long-Term Downtrend
SUPRA has been in a persistent decline for months, respecting every lower-timeframe breakdown and failing to reclaim prior support levels.
Candle structure on the 5D chart remains weak, with sellers defending every rally attempt.
Both EMAs (35 & 205) are sloping downward, confirming long-term bearish momentum.
This remains a downtrend until price can reclaim and close above significant resistance zones.
📌 Key Levels
🔻 Immediate Support Zone (Current Area)
0.0010711 (current trading region)
0.0010031 (major support)
This zone is critical — a breakdown below 0.0010031 opens the door to new lows and potential capitulation.
🔺 Overhead Resistances to Watch
These are the levels SUPRA must reclaim to shift sentiment:
0.0013750 – first major resistance above current price
0.0019159 – breakdown origin area
0.0046222 – high-timeframe supply zone
0.0079712 – major structural resistance
0.0130722 – long-term bearish retest level
0.0566736 & 0.0800169 – historical high liquidity zones
📊 EMA Signals
35 EMA: Trending steeply down, acting as dynamic resistance since mid-year.
205 EMA: Deeply above price, confirming long-term bearish macro environment.
A true reversal isn’t confirmed until price begins closing above the 35 EMA on the 5D — a level that SUPRA has failed to reclaim for months.
📈 What to Expect
Bullish Scenario (Risky, Counter-Trend)
SUPRA holds above 0.00100 support
Price forms a higher low on the 5D
A reclaim of 0.0013750 would signal first signs of exhaustion in the downtrend
Break and close above the 35 EMA → potential mid-term rally toward 0.0019159 and possibly 0.0046222
Bearish Continuation Scenario (Most Likely Until Proven Otherwise)
Breakdown below 0.0010031
Momentum continues downward, possibly forming new lows
Macro structure remains bearish unless major resistance levels are reclaimed
📌 Trade Thesis
SUPRA is sitting on a critical support cluster after a prolonged multi-month downtrend. The trend is still decisively bearish, with price trading far below both major EMAs. However, this support zone has the potential to act as a short-term reaction level.
Bullish traders will look for a relief rally from this zone.
Bearish traders will look for a clean breakdown to continue the macro trend.

AUDUSD – Clean Rejection From Demand + Bullish Reaction AUDUSD tapped into a fresh 15-minute demand zone after creating a clear liquidity sweep below 0.66310.
Price reacted strongly and broke short-term structure to the upside — confirming bullish momentum.
My Plan
Entry: 0.66330 – 0.66350 (after confirmation bounce)
Stop Loss: Below 0.66220
Take Profit: 0.66540 (previous high)
Bias
⭐ Bullish
As long as price holds above 0.66220, I expect continuation to the upside.

NYSE Sessions indacator 📌 NYSE Open–Close Session Map — by o0psi
This tool marks the exact candles where the New York Stock Exchange opens and closes, and automatically tracks the true session high and low.
Everything is locked to the exact bar where it happened — no drifting, no extended rays, no repainting.
🔹 Features
NYSE OPEN marker (9:30 EST)
NYSE CLOSE marker (16:00 EST)
Faint background highlight showing the full regular session
Real session high/low detection
High/low candles update live as the session forms
High/low markers stay attached to the exact candle that created them
Perfect for futures, indices, and equities traders
🔹 Why traders use this
The NYSE open and close create some of the most important liquidity events of the day.
This indicator makes them obvious — clean visuals, no clutter, no guessing.
🔹 Ideal for
SPY / ES / NQ scalpers
US30 / SPX traders
Liquidity + session-based traders
Intraday momentum and volatility setups
Anyone who uses NY open/close as key decision points
Made with precision by o0psi.
Enjoy the clean look — and drop a comment if you want a pre-market or extended-hours version.

CFD great chartThe US Federal Reserve is expected to cut the policy rate at the last meeting of 2025.
The revised Summary of Economic Projections and Fed Chair Powell’s comments will be key as a rate cut is largely priced in.
The US Dollar could stay on the back foot unless the Fed delivers a hawkish surprise.
The United States (US) Federal Reserve (Fed) will announce its interest rate decision on Wednesday, with markets widely expecting the US central bank to deliver a final 25 bps cut for 2025. While the move is widely priced in, this may be overshadowed by the vote itself as dissent within the Committee is anticipated from both hawks and doves.

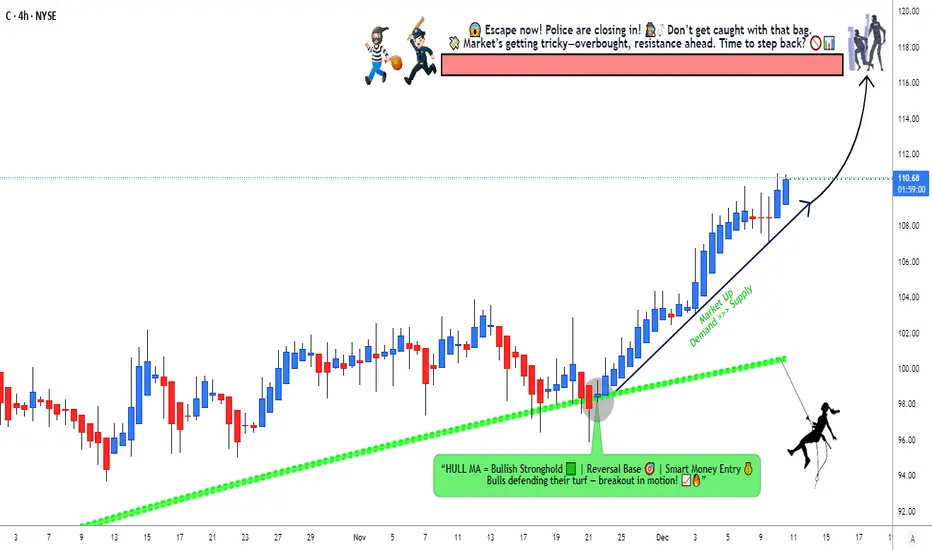
Citigroup Trend Continuation Setup Powered by Hull MA Signal🏦💰 CITIGROUP ($C) - The Bank Heist Setup | Hull MA Pullback Confirmed 🎯
📊 CURRENT MARKET DATA (Real-Time Feed: Dec 10, 2025)
💵 Current Price: $109.26 USD
📈 Day Change: +$0.34 (+0.31%)
🔥 52-Week Range: $55.51 - $109.37
🎯 Analyst Target: $114.29 (High: $134 | Low: $90)
📊 Market Cap: $194.82B
💎 Dividend Yield: 2.2%
⭐ Technical Signal: STRONG BUY
🎭 THE HEIST PLAN | Day/Swing Trade Setup
🧭 Strategy: Bullish Hull Moving Average Pullback Entry
Ladies and gentlemen, gather 'round! 👨💼👩💼 We've got ourselves a proper bank heist brewing with Citigroup. The Hull Moving Average just gave us the green light for a pullback entry, and the vault door is wide open. Time to execute the perfect layered entry strategy! 💼🔓
🎯 ENTRY ZONE - The "Thief Layering Strategy" 🥷
Multiple Limit Order Layers (Scale In Approach):
🔹 Layer 1: $106.00
🔹 Layer 2: $108.00
🔹 Layer 3: $110.00
💡 Pro Tip: You can add more layers based on your own capital allocation and risk appetite. This isn't financial advice—just showing you how the pros layer into positions like a proper heist team! 😎
⚠️ Note: Current price is trading at $109.26, so Layer 2 and 3 are in play NOW! Layer 1 is your safety net if we get a deeper pullback.
🛑 STOP LOSS - The Escape Route 🚪
SL: $104.00 ❌
⚠️ Dear Thief OG's: This is MY stop loss level based on my technical analysis and risk management. You're the captain of your own ship! 🚢 Set your own stop based on YOUR risk tolerance. Remember: preserve capital to fight another day! 💰
💰 TARGET - The Loot Bag 💼
TP: $116.00 🎯✨
🚨 Why $116? Here's the Technical Breakdown:
📍 Strong Resistance Zone - Historical ceiling
📊 Overbought Territory - RSI nearing extremes
Potential Bull Trap - Watch for exhaustion
📉 Correction Zone - Profit-taking area
🏃♂️ THE POLICE ARE WAITING! 👮♂️👮♀️
When we hit that resistance zone with our profit bags, the "market police" (sellers) will be waiting to catch us. Time to be smart—take profits in stages and ESCAPE with the loot! Don't be greedy! 💼💨
⚠️ Dear Thief OG's: Again, this is MY target. You do you! Take profits when YOU feel comfortable. Your money, your rules, your risk! 🎲
🔗 RELATED PAIRS TO WATCH | Correlation Play 🌐
Keep your eyes on these banking sector correlations:
🏦 Direct Banking Sector:
NYSE:JPM (JPMorgan Chase) - The big daddy of banks, moves similar to C
NYSE:BAC (Bank of America) - Retail banking giant, correlates strongly
NYSE:WFC (Wells Fargo) - Domestic focus, sector momentum indicator
NYSE:GS (Goldman Sachs) - Investment banking correlation
📊 Key Correlation Points:
✅ Sector Rotation: When financials heat up, these all move together
✅ Fed Policy: Interest rate decisions impact ALL banking stocks
✅ Economic Data: GDP, employment, and inflation = banking fuel ⛽
✅ Credit Market: Corporate lending trends affect the entire sector
💡 Why Watch These?
If NYSE:JPM or NYSE:BAC breaks out first, $C usually follows! Smart thieves watch the entire crew, not just their own target! 🎯
📈 TECHNICAL ANALYSIS HIGHLIGHTS
🔹 Hull Moving Average: Bullish pullback confirmed ✅
🔹 Volume: Above average, showing institutional interest 📊
🔹 Trend: Strong uptrend since $55 lows, up +97% YTD 🚀
🔹 Momentum: Building bullish momentum post-pullback ⚡
🔹 52-Week High: Just made fresh highs at $109.37 🏔️
⚠️ RISK MANAGEMENT - Don't Be a Rookie! 🎓
🛡️ Never risk more than 1-2% of your portfolio on a single trade
📊 Scale in with layers—don't go all-in at once!
🔄 Trail your stop loss as price moves in your favor
💰 Take partial profits at resistance levels
🧠 Trade what you see, not what you think!
🎬 FINAL THOUGHTS
This setup is clean, technical, and backed by real market data. Citigroup is showing strength, analyst targets support higher prices, and the Hull MA pullback gives us a strategic entry. But remember—this is YOUR money and YOUR decision! 💪
The vault is open, the plan is set, now we execute! But do it smart, do it calculated, and most importantly—do it YOUR way! 🎯💼
✨ If you find value in my analysis, a 👍 and 🚀 boost is much appreciated — it helps me share more setups with the community!
⚖️ DISCLAIMER
🎭 This is the "Thief Style" trading strategy—just for fun and educational purposes!
#Citigroup #C #NYSE #BankingStocks #Financials #HullMovingAverage #PullbackStrategy #DayTrading #SwingTrading #TechnicalAnalysis #StockMarket #BullishSetup #TradingIdeas #StockAnalysis #RiskManagement #LayeringStrategy #ThiefStyle #JPMorgan #BankOfAmerica #SectorRotation #FinancialSector #WallStreet #TradingCommunity #MarketAnalysis #PriceAction
BABA BUYBUY BABA at 106.0000 to 95.0000, riding back up to 148.0000 to 158.0000 as Profit Targets, Stop Loss is at 80.000!
Warning: This is only for entertainment and opinion purpose. Trading is a risky business, so do your own due diligence, and trade at your own risk. You can loose all of your money and much more.

WBD ShortLots of news about the merger happening, but nothing set in stone. Possible anti-trust issues. Who knows what could happen, but the pattern looks pretty. I am pretty sure that is all that counts.

EURUSD buy???EU looks like it may close above those body highs, if it does I will no longer be looking for sells and start looking for buy opportunities...

Review and plan for 11th December 2025Nifty future and banknifty future analysis and intraday plan.
siemens, kaynes.
This video is for information/education purpose only. you are 100% responsible for any actions you take by reading/viewing this post.
please consult your financial advisor before taking any action.
----Vinaykumar hiremath, CMT

