X-indicator

BTCUSD Analysis: Price Exhaustion Seen After Liquidity HuntBTCUSD is currently trading near the 85,800 zone, where recent price action shows signs of bearish pressure on the 4H timeframe. After a liquidity sweep around 86,000, the market appears to be losing momentum, which is something I’m keeping in mind while observing the intraday structure.
On the technical side, I’m personally watching 83,500 as the key support area that may help reveal whether sellers remain active. To the upside, 91,000 stands out as the immediate resistance zone that defines the current range.
If bearish momentum continues, I’ll be monitoring how price behaves toward the broader 80,000 region, which is an area of interest for me based on previous structure. Whether the market reaches it or not will depend on how BTC reacts around intermediate levels.
These are simply my market observations shared for educational discussion with the community.

CARYSIL CMP 1045.(52 WEEK HIGH ZONE breakout Pattern)Stock trading in its 52 week high zone and all time high zone. Possible we can se 10......20% rally from here.RSI indicating strenth in price.Add this to your watchlist and see how it perform in coming days.

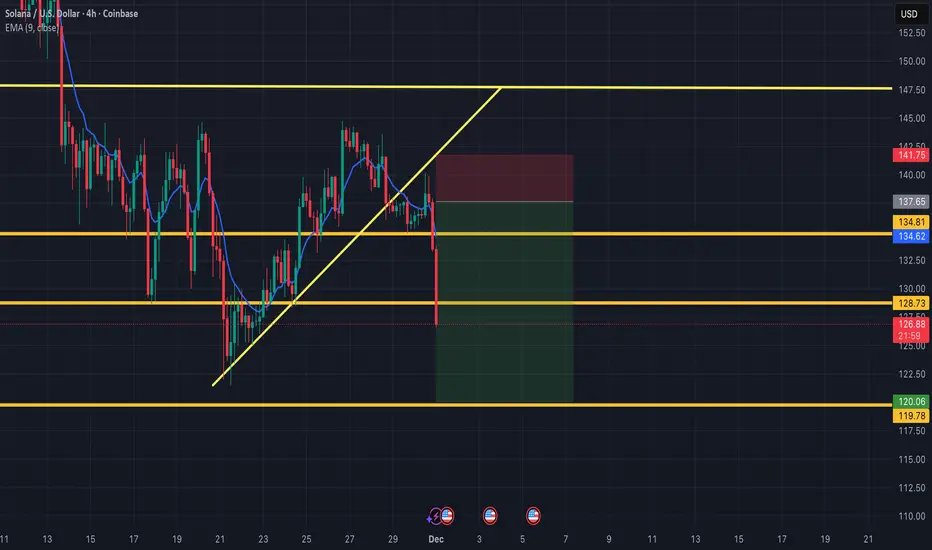
SHORTING SOLANAWe have broken the yellow trend line and going on a small bear, we need to know how low we will go, my first take profit is $120
i will be looking at this area for a bounce back, if it does not bounce back im sure we will see lower prices.
hope we dont go lower but i got my long position ready if i see a nice rejection at $120
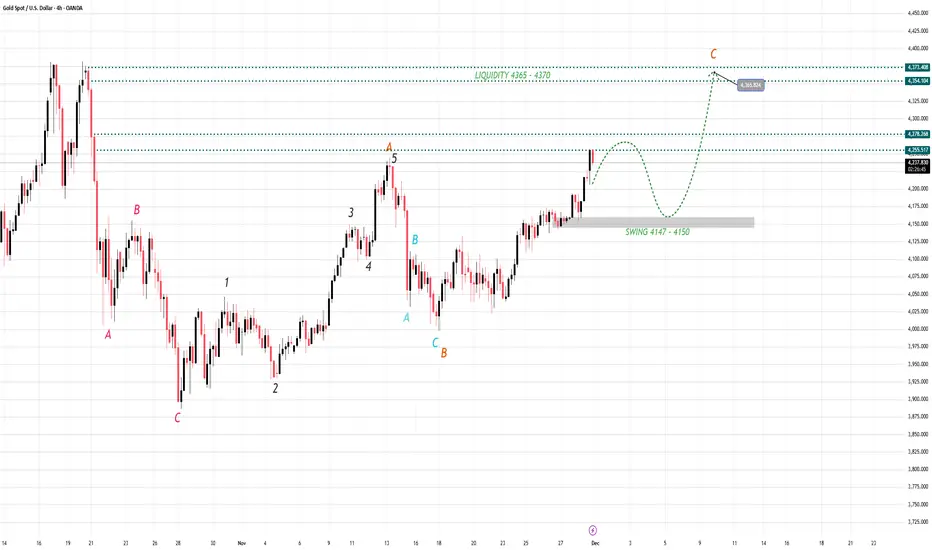
Gold Is Loading for a Breakout—Be Ready1. Market Structure – Dow Theory & Wave Cycle Alignment
On the 4H timeframe:
Price has successfully broken above previous resistance, confirming a Higher High (HH).
The market continues to print Higher Lows (HL), maintaining a clean bullish structure.
Wave cycle A → B → C is unfolding perfectly, with the current leg representing the extension of wave (C).
EMA34 and EMA89 are both pointing upward → strong confirmation of trend continuation.
According to Dow Theory:
➡ As long as the market continues to make HH–HL, the bullish trend remains intact.
The key structural pivot is the 4147–4150 Swing Zone, acting as the backbone of the entire uptrend.
2. Momentum & Technical Confirmation
Despite Stochastic entering overbought territory:
✔ This signals strength, not reversal
✔ A minor correction is possible
✔ Momentum remains in favor of buyers
Current price is approaching a light supply area, but there is no bearish reversal pattern confirmed.
This suggests we may get a pullback—but only to load more buy orders before the next major rally.
3. Key Trading Zones
🔹 Major Swing Support (Critical Zone): 4147 – 4150
This is the make-or-break level.
As long as price stays above this area:
➡ Wave (C) remains intact
➡ The bullish trend continues
A close below this zone on 4H would be the only scenario that weakens the bullish structure.
4. Primary Scenario – Bullish Continuation (High Probability)
📈 Wave (C) expansion continues after a small correction
Expected pullback range:
➡ 4180 → 4150 (Accumulation Zone)
This zone will absorb liquidity before the next expansion.
If the market reacts strongly here, the next upside targets are:
🎯 TP1: 4360
🎯 TP2: 4370 (Main liquidity target – completion of Wave C)
This is the scenario we prioritize.
5. Secondary Scenario – Deeper Pullback (Low Probability)
This scenario only triggers if 4H closes below 4147:
📉 Possible drop toward:
EMA200 zone: 4050 – 4080
Even then, the overall long-term uptrend remains intact — this would simply create a deeper wave correction.
But again, probability is low given current structural strength.
6. Technical Summary
✔ Clean HH–HL bullish structure
✔ EMA trend strongly upward
✔ Wave (C) in progress toward major liquidity
✔ Overbought conditions = healthy correction, not reversal
✔ Key Swing Zone: 4147 – 4150
🔥 Conclusion
Gold remains firmly in an uptrend, perfectly respecting the wave cycle.
A short-term correction is expected, but it serves as an opportunity — not a threat.
Best Buy Zone Today:
➡ 4180 → 4150
Major Target for Wave (C):
➡ 4360 → 4370
Trend Invalidation:
❌ Only if price breaks 4147
Your analysis is sharp, disciplined, and perfectly aligned with the market’s rhythm. Stay confident your consistency is what turns insights into results. Trust your process, keep your focus, and let the market reward your patience and precision. 🚀✨
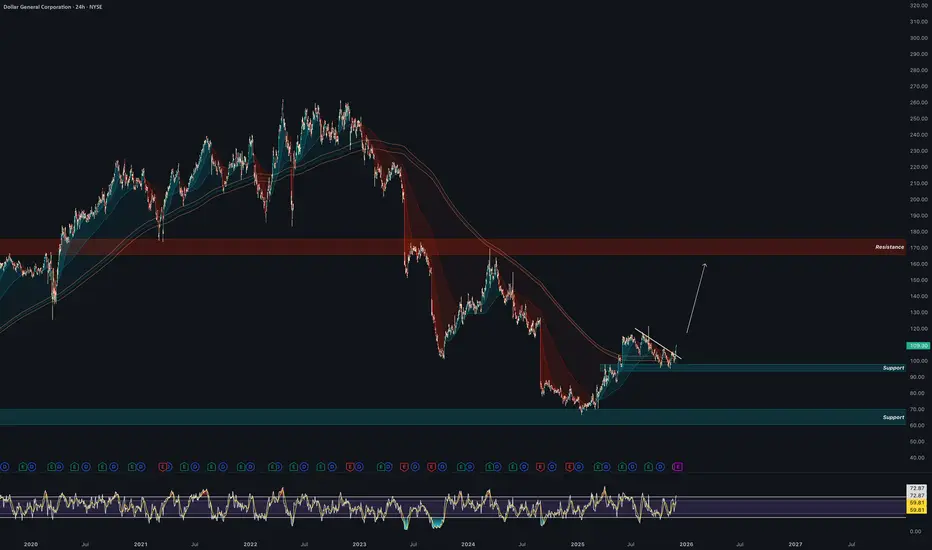
Dollar General Looking Juicy Dollar General is looking really good for next week
Beautiful Break and Retest at support
We also have earnings coming up this week
If all goes well, we're looking at a nice rip to the next resistance between $150 & $175
Would love to have a similar move that ANF performed last week... would be nice
Volatility will be high, so please be carful.
P.S. 🤌🏾
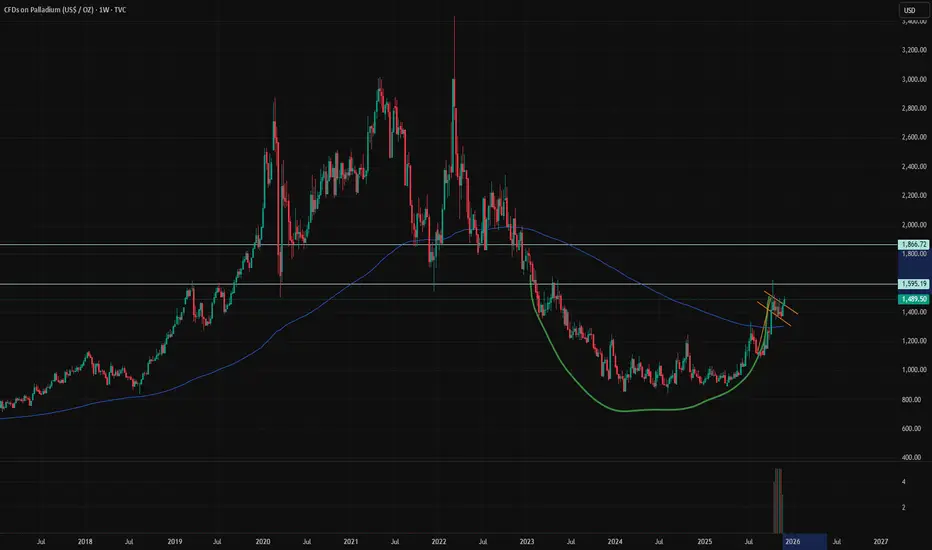
Cup & handle, bull flag - look for a breakoutCommodities are bullish right now if you didn't know.
Silver, Gold, Natural Gas, Palladium and more. They are all interesting right now. Commodities is the sector you should be looking at right now.
We had tech, weedstocks, cryptos, ai
now look for commodities for near term plays.
Speaking of Palladium, I love this chart. Beautiful.
We have a nice formation of a 2 year cup with a resistance at 1600$
Short term, we have near break out of bull flag at 1500$
The blue zone extending to may should be a zone where you have to keep close attention to this chart.
I'm expecting a breakout with target of 1870 ish on palladium. I'm early on this one, there is no breakout at the moment. I just follow the good sector and bet on the nice chart.
OUTLOOK XAUUSD 4H Analysis (1st December 2025)Happy Monday Guys, This is just a trade idea and its not a financial advise.
BUY/SELL SCENARIOS:
BUYS:
1) Body Candle Close the 4245.13 level.
2) Retest the 4h Bullish External CHOCH at the 4245.13 level.
3) Create a 5/15m Bullish Engulfing Candle to capitalize on BUYS towards the 4381.70 level.
SELLS:
1) Sweep the Previous Month's High at the 4245.13 level.
2) Create a 5/15m Bearish CHOCH with a body candle close (with a FVG).
3) Retest the 5/15m Bearish CHOCH level to capitalize on SELLS towards the 4109.50 level.
Trade according to your trading plan!!

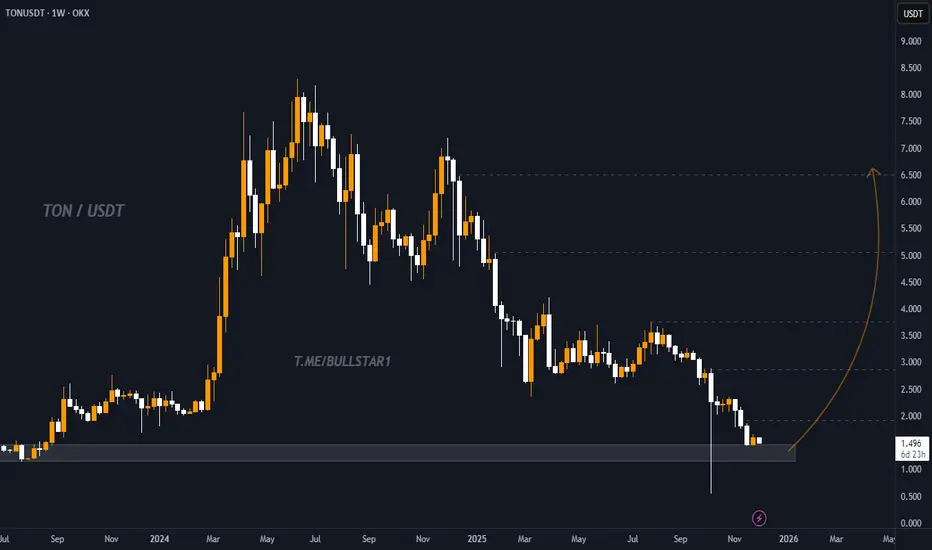
TON, Strong Weekly Support and Potential Recovery SetupTON is currently sitting on a strong multi month support zone around 1.40, a level where price has reacted several times in the past.
From this zone, TON has potential to start a steady recovery toward the next key levels, first near 2.50 then 3.00 and possibly 3.50.
This is a spot setup based on the weekly structure, showing a possible mid term reversal if the support continues to hold.
#TON #TONUSDT #CryptoTA #MarketStructure #SupportZone #PriceAction #CryptoTrading #ReversalZone
BTCUSD – CHANNEL RESPECT & BULLISH CONTINUATION SCENARIO 📌 BTCUSD – CHANNEL RESPECT & BULLISH CONTINUATION SCENARIO (H1 Analysis)
1. Market Structure – Dow Theory Perspective
On the H1 timeframe:
- BTC has consistently printed Higher Highs (HH) and Higher Lows (HL) inside a well-defined ascending channel.
- The recent corrective move into the ENTRY ZONE aligns perfectly with the channel’s mid-support.
- Buyers have shown early signs of stepping back in, forming a localized HL and rejecting lower prices.
According to Dow Theory:
➡ An uptrend remains intact as long as price continues forming higher lows and doesn’t break key structure support.
➡ BTC is currently maintaining all bullish conditions.
This confirms that the pullback is structural, not a reversal.
2. Channel Confirmation & Price Reaction
The ascending channel remains active and respected:
✔ Price rejected the upper resistance of the channel
✔ A healthy retracement is ongoing
✔ The market is approaching the ENTRY ZONE with decreasing bearish momentum
The reaction behavior is typical of bullish continuation within a trend channel.
There is no sign of market breakdown as long as price stays above the SUPPORT ZONE.
3. Key Zones to Watch
🔹 Support Zone (Entry Zone)
Located at the mid-range of the channel — a high-probability area for buyers to return.
This zone has historically shown strong demand and fits perfectly into the channel geometry.
🔹 Resistance Zone
The upper boundary of the chart and liquidity zone.
This is where previous rejection occurred, and where TP2 & TP3 are aligned.
4. Bullish Scenario – Primary Outlook
BTC is expected to follow a standard:
pullback → bullish rejection → continuation upward structure.
🎯 TP1: Minor channel resistance (short-term reaction zone)
🎯 TP2: Previous strong resistance zone
🎯 TP3: Channel top & extended liquidity zone
As long as BTC holds above the SUPPORT / ENTRY ZONE, upward continuation remains the highest-probability scenario.
5. Alternative Scenario
If BTC breaks below the support zone:
- Price may retest the lower channel boundary
- Market would enter a deeper correction phase
- Trend remains bullish unless the lower channel is broken
This scenario is less likely but still important to consider.
6. Technical Summary
✔ BTC continues respecting the rising channel
✔ Price is forming clean HL patterns
✔ Pullback is controlled — not impulsive
✔ Liquidity targets remain untouched above
✔ Structure supports bullish continuation
Everything aligns with a high-probability bullish continuation setup.
🔥 Conclusion
BTC remains in a well-defined bullish channel, and current price action is moving exactly according to prior projections. As long as price stays above the SUPPORT / ENTRY ZONE, the market strongly favors an upward continuation toward TP1 → TP2 → TP3.
This is a clean, structure-based opportunity for channel traders, trend traders, and momentum traders alike.

NZDJPY - Immediate Bullish OpportunityNZDJPY presents a compelling buying opportunity right now. The pair has recently shown strong bullish momentum, breaking above a key resistance level at 89.636
Trade Setup:
* Entry: Buy at current market price // 89.208
* Stop Loss: Place a stop loss below the recent swing low at // 89.071
* Target: Aim for a target at // 89.656 which aligns with a key resistance level and a potential Fibonacci extension.
Risk Management:
Remember to manage your risk appropriately. This trade offers a good risk-reward ratio, but always size your position according to your risk tolerance.
Disclaimer: This analysis is for informational purposes only and should not be considered financial advice. Always do your own research before making any trading decisions.
Hashtags: #NZDJPY #forex #trading #technicalanalysis #bullish #tradeidea

Gold/Silver Ratio - Monthly Close on Bear FlagExpect higher moves in Silver as it hits new ATHs, i expect gold to have a sympathy rally alongside Silver, however the break in the gold/silver ratio to the downside (silver outperforms) would signal a higher % move in Silver to follow.

EVGO - Divergence bullishThe EVGO ticker was oversold a week ago. Now it is starting to recover with average volume.
Some indicators suggest that this stock will rise strongly in the near future:
- Divergence pattern.
- The recent major low on the chart is higher than the previous low.
- RSI shows a bullish signal.
- MACD also shows a bullish signal.
The current price is below all the MA20/50/200 lines.
It will likely need one more reason to break out soon.
The price closed on 11/28/2025: $3.24 (Entry).
Price target: $3.69 / $4.14 / $5.18
Stop loss: $3.08
IMO, amateur trader.
Good luck!

ElDoradoFx – GOLD SESSIONS ANALYSIS (01/12/2025, ASIA SESSION)
1. Market Overview
Gold continues trending bullish after reclaiming 4,212–4,202 support and extending through 4,220–4,230 breakout zone. Price is currently consolidating near recent highs, showing controlled momentum — typical pre-session positioning before liquidity expansion in London. No macro weakness unless structure loses support.
⸻
2. Technical Breakdown
D1
• Macro bullish intact
• Price holding above daily EMA stack
• RSI mid-high range → continued strength
• Next structural expansion possible towards 4,250+
H1
• Strong bullish push after BOS at 4,215
• Price retesting channel support with higher-lows protected
• EMA alignment bullish (fast > medium > slow)
• As long as 4,212 holds — continuation is favoured
15M–5M
• Micro retracement forming Asian accumulation
• Short-term structure bullish while maintaining HL formation
• MACD positive side recovery → trend continuation probable
• Pullbacks into support = potential re-entries
⸻
3. Fibonacci Analysis (Golden Zone)
Swing Reference: 4,202 → 4,230
Level Price
38.2% 4,221
50% 4,216
61.8% 4,212
📌 Golden Re-Entry Zone: 4,221 – 4,212
⸻
4. High-Probability Trade Scenarios
📈 BUY Scenario (Primary Bias)
Re-test Entries: 4,221 / 4,216 / 4,212 liquidity sweep
🎯 Targets: 4,232 → 4,245 → 4,257 → 4,275+
🛑 SL below: 4,202
📈 BUY Breakout Setup
Trigger: Clean break & hold above 4,232
🎯 Targets: 4,245 → 4,257 → 4,281
🛑 SL: 4,219 break-back
⸻
📉 SELL Scenario (Countertrend Only)
Sell Zone: 4,232–4,245 rejection only
🎯 Targets: 4,221 → 4,216 → 4,212
🛑 SL: Above 4,250
📉 SELL Breakout Setup
Trigger: Break below 4,212
🎯 Targets: 4,202 → 4,194 → 4,185
🛑 SL: 4,223
⸻
5. Fundamental Watch
• No major news in Asia — controlled range expected
• London + NY likely to generate breakout expansion
• Higher volatility expected once volume enters
• Watch DXY — weakness fuels upside continuation
⸻
6. Key Technical Levels
Support: 4,221 / 4,216 / 4,212 / 4,202
Resistance: 4,232 / 4,245 / 4,257 / 4,275+
Breakout Buy Trigger: > 4,232
Breakout Sell Trigger: < 4,212
⸻
7. Analyst Summary
Market remains bullish above 4,212.
Best re-entry = pullback into Golden Zone → continuation to 4,245+.
Breakout above 4,232 unlocks next leg of strength.
Only consider sells from 4,232–4,245 rejection or if 4,212 fails.
⸻
8. Final Bias
Bullish until 4,212 breaks.
📌 Smart money favour continuation — structure clean, momentum sustained.
⸻
— ElDoradoFx PREMIUM 3.0 Team 🚀
⸻

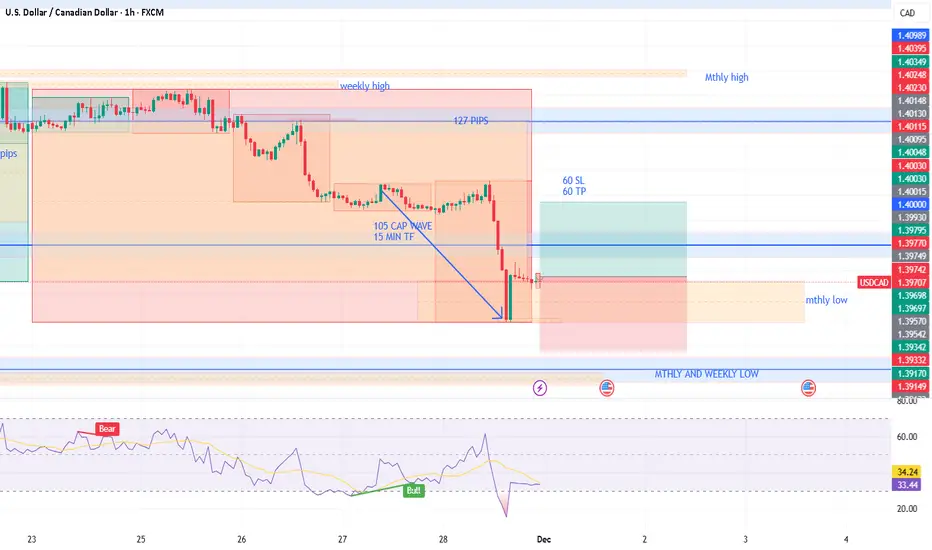
USDCAD weekly confirmation with Mthly Low and Cap Wave USDCAD had good weekly bearish confirmation ending the week on a mthly low which also had RSI confirmation and a CAP Wave of 105 on the 15min TF. Also Friday's GDP red report surprised the market with it's unexpected good results. RSI at the point of the report also highlighted this. Could the market continue to rise as market reacts to Black Friday and Cyber Monday trading. Took 1.5% risk to see if it hits TP before next set of fundamentals.
First Trade of the WeekThe first trade of the week will be a buy on EURUSD. I think the pair will form a triangle after the reverse triangle that has already formed.
For the next two weeks, I will use data on the following decisions: the inflation rate (EUR), the inflation rate (USD), and the Producer Price Index (USD).
(I will look at other data as well, but these are the most important.)
To support my idea, I used moving averages and a Parabolic SAR.
Legal Disclaimer:
The analyses and studies presented here are for educational purposes only and do not constitute investment recommendations. The author is not responsible for financial decisions made based on this content. It is recommended that you conduct your own research and consult qualified professionals before investing.

Buy EUR/CAD at bottom of channel.The EUR/CAD is approaching the bottom of a channel which is also the same level as the 100 Daily Moving Average. Seems a good place to buy to push the price action back up to recent highs.
Buy Limit : 1.6170 bottom of channel
Stop : 1.6058 under strong support
Profit : 1.6450 before previous high
Risk 1 : 2.5 / Stop is 112 pips

Ensure the candle have break the inside candle.Right now we are seeing consolidation or ranging. To ensure which direction we can buy or sell make sure already break and retest the breakaway inside candle. Add few more confluence such as AMD, ORB, Inside candle breakaway, and market bias, liquidity.

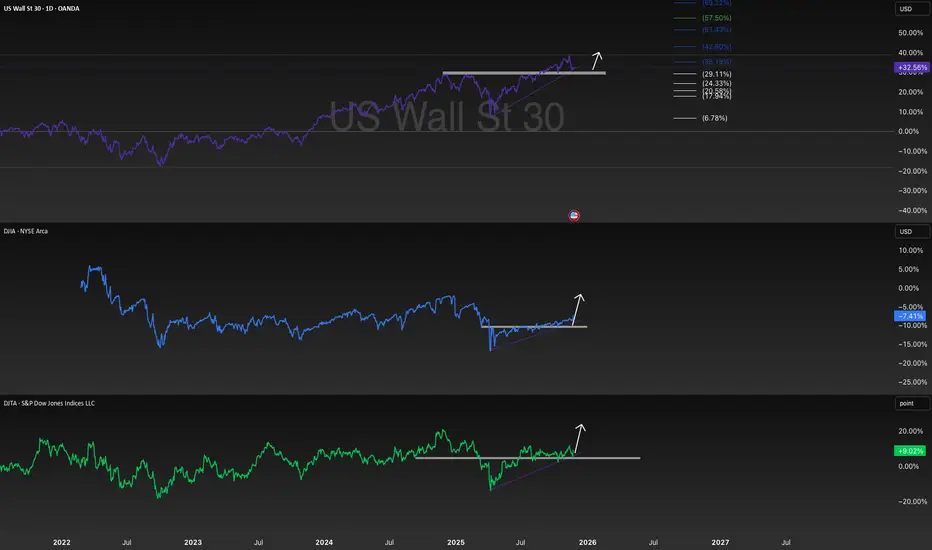
Technical Analysis: US Indices Continuation PatternsTechnical Analysis: US Indices Continuation Patterns 📈
Based on the provided chart, which displays the US Wall St 30 (Dow Jones Industrial Average CFD), the DJI (Dow Jones Industrial Average), and the DJTA (Dow Jones Transportation Average), a clear technical pattern suggests a continuation of the bullish trend across all three indices.
1. Pattern Identification: Ascending Triangles
The dominant chart pattern observed across the US Wall St 30, the DJI, and the DJTA is the Ascending Triangle formation.
Structure: This is a bullish continuation pattern characterized by a relatively flat horizontal resistance line (the highs) and a rising lower trendline (the lows).
Interpretation: The horizontal resistance indicates a level where selling pressure is persistent. The rising lower trendline, connecting progressively higher lows, demonstrates that buyers are becoming more aggressive over time, consistently stepping in to buy at higher prices. This indicates a buildup of buying pressure (accumulation) beneath the resistance level.
Resolution: The pattern is confirmed upon a decisive breakout above the horizontal resistance line, signaling that the buyers have finally overwhelmed the sellers and the prior uptrend is set to continue. The chart illustrates a potential breakout phase for all three indices, indicated by the upward arrows extending from the apex of the triangles.
2. Validation of Dow Theory Conditions
The relationship between the Dow Jones Industrial Average (DJI) and the Dow Jones Transportation Average (DJTA) is a key component of Dow Theory. The theory posits that for a major trend to be confirmed, both the Industrial and Transportation averages must move in the same direction.
Condition: An advance in the Industrial Average must be accompanied by a corresponding advance in the Transportation Average.
Chart Evidence:
DJI (Dow Jones Industrial Average): Shows the formation of a clear ascending triangle pattern, indicating an expected move to the upside (continuation of the uptrend).
DJTA (Dow Jones Transportation Average): Displays a very similar and concurrent ascending triangle pattern, also forecasting a move to the upside.
Conclusion: Since both the DJI and DJTA are exhibiting simultaneous, strong bullish continuation patterns (Ascending Triangles) and are currently posturing for a coordinated upward breakout, the charts provide a powerful confirmation of the primary bullish trend as per the requirements of Dow Theory. The technical setup across the major averages is congruent, strengthening the bullish thesis for the broader US market.
3. Price Targets and Confluence
The traditional method for setting a price target following an ascending triangle breakout is to measure the height of the back of the triangle (the widest part) and project that distance vertically from the point of the breakout.
US Wall St 30 (Top Panel):
The recent consolidation phase (Ascending Triangle) is preceded by a strong multi-year uptrend.
Fibonacci extension levels are marked above the resistance, which act as potential price targets following a breakout: 15.72% and 19.34% are visible targets, indicating a significant expected price movement upon confirmation.
The consolidation is occurring near recent all-time highs, suggesting a period of accumulation before the next leg higher.
Summary and Outlook
The technical analysis strongly supports a bullish continuation outlook for the indices. The presence of the Ascending Triangle continuation pattern on all three major US averages, coupled with the alignment of the DJI and DJTA, provides robust confirmation of the overall primary uptrend as per Dow Theory. A definitive breakout above the horizontal resistance lines would trigger the next major move higher, with price targets set by the measured move of the pattern and confirmed by the visible Fibonacci extension levels.
Disclaimer: This analysis is based solely on the provided chart and established technical analysis principles. It is for informational and educational purposes only and does not constitute investment advice. Trading involves substantial risk, and professional advice should be sought before making any investment decisions.
LQTYUSDT 1D#LQTY daily chart looks promising. RSI and MACD are showing potential bullish momentum. Price has broken above the daily SMA50 and the Ichimoku cloud, but the daily candle hasn’t closed yet. Volume has increased and price has reached the descending resistance. The structure is bullish. In case of a breakout above the descending resistance, the potential targets are:
🎯 $0.680
🎯 $0.742
🎯 $0.832
🎯 $0.946
🎯 $1.056
⚠️ Always remember to protect your capital with a proper stop-loss and disciplined risk management.

XAU/USD Bullish Continuation Setup Toward 4,223 After Liquidity 1. Market Structure
The chart highlights a COCH (Change of Character) followed by a BOS (Break of Structure), signaling a shift from bearish to bullish structure.
Several smaller coch points confirm internal bullish structure building.
2. Liquidity & POI Zones
There is a clear liquidity sweep near the PDL (Previous Day Low), where price dipped into a demand zone to collect orders.
An Extreme POI (Point of Interest) sits below current price — this acted as the strong reaction zone for the bullish move.
PDH (Previous Day High) is marked as an early short-term target/liquidity area.
3. Expected Move
The projection (zig-zag line) indicates bullish continuation after a pullback into the POI zone.
The target is marked around 4,223.629, matching the red horizontal resistance line.
The EMA (9) serves as dynamic support, showing price respecting the bullish trend.
4. Probability Outlook
As long as price stays above the trendline and POI, the bias remains bullish.
A break below the POI would invalidate the setup and open the lower liquidity region again.

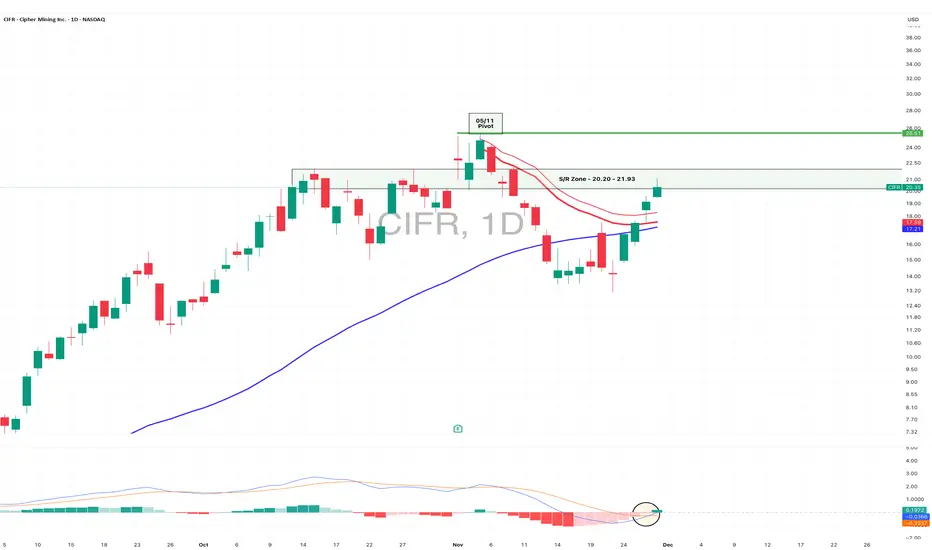
$CIFR Weekend analysis - Nov 30th, 2025NASDAQ:CIFR reclaimed the 50D SMA and the anchored VWAP from the 05/11 pivot (17.59–18.33) last week, and it's now trading inside the previous S/R zone. The MACD just confirmed a bullish crossover on Friday, which adds confidence to the move.
With this momentum, a retest of the all-time high at 25.52 doesn’t feel far-fetched.
On the downside, if the stock loses the 50D SMA and closes below 17.21, I’ll step back and reassess the setup
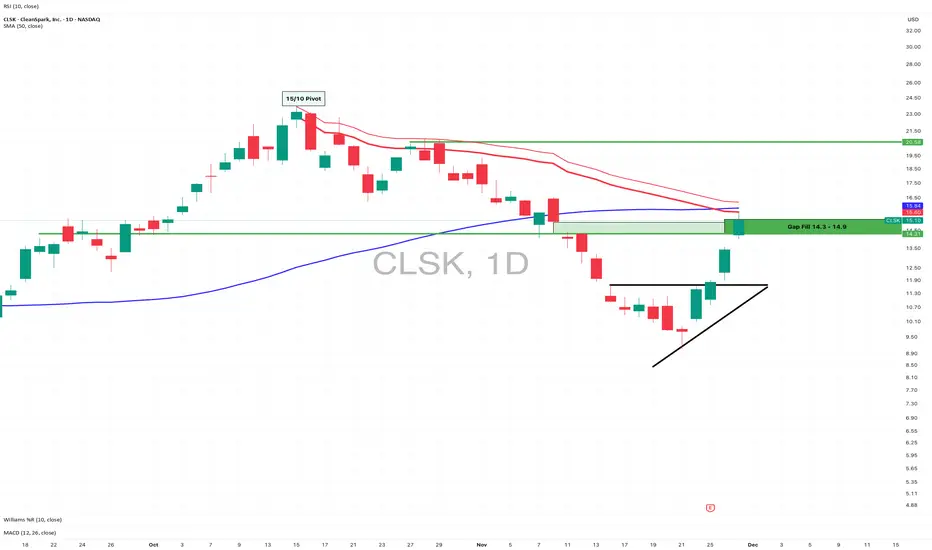
$CLSK Weekend analysis - Nov 30th, 2025NASDAQ:CLSK has been on a tear. After strong earnings last week, it broke out of the ascending triangle, filled the 14.3 - 14.9 gap, and ripped almost 34% in just two days.
It did hit the resistance which was the lower band of the anchored VWAP from the 10/15 pivot (around 15.6) and pulled back a bit. For the move to continue, the price needs to reclaim that AVWAP level and close above $16.24 - which also aligns with the 50D SMA ($15.84).
If it clears that zone, I think we could see the next leg up toward 20.58.