USDJPY remains in a consolidation phase with a bullish biasUSDJPY remains in a consolidation phase with a bullish bias. If price reacts positively and bounces from current support levels, we could see renewed upward momentum and a potential continuation toward higher resistance zones.
Global equities pulled back on Wednesday as investors braced for a pivotal Federal Reserve policy meeting, with the board appearing increasingly divided on the path forward. The market is also weighing upcoming earnings results, particularly in the AI sector, where elevated valuations may be tested.
technically USDJPY a rising channel and is currently retesting a key demand zone around 156.40–156.90 after a strong impulsive move upward. Price action suggests a potential bullish continuation if this zone holds.
A breakout above the minor resistance trendline could trigger an upside move toward the first target at 157.560. If momentum remains strong, the next major bullish target is located at 158.552.
You may find more details in the chart.
Trade wisely best of Luck buddies.
Ps; Support with like amd comments for better analysis thanks for supporting.
X-indicator

Ethereum Holds Its Bullish Channel as Markets Stabilize🔹 MARKET BRIEFINGMarket State:
– Price is pulling back from the channel’s upper resistance and is now stabilizing around mid-range, while still respecting the ascending channel structure.
Key Levels:
– Support: 3,160
– Resistance: 3,440
– Breakout Zone: 3,440 – 3,520
Next Move:
– Bullish bias remains intact as long as ETH continues to hold above the channel’s support; reclaiming 3,440 would open momentum toward 3,520 and potentially the upper boundary. – ETH/USD (4H)

SOLUSDT — Strong Supply Rejection & Bearish Target in FocusSOLUSDT has reacted sharply from the strong supply zone, confirming active sellers after a fake breakout and clean rejection from resistance. Price is now holding below the seller zone, forming a bearish structure after high volatility movement. If the market breaks the support zone around 131–132, a continued drop toward the demand zone becomes highly likely.

GOLD 4H CHART ROUTE MAP UPDATE & TRADING PLAN FOR THE WEEKHey Everyone,
Please see our 4h chart remaining levels and targets for the coming week with one updated Goldturn.
We are now seeing price play between two weighted levels with a gap above at 4222 and a gap below at 4124. We will need to see ema5 cross and lock on either weighted level to determine the next range.
We will see levels tested side by side until one of the weighted levels break and lock to confirm direction for the next range.
We will keep the above in mind when taking buys from dips. Our updated levels and weighted levels will allow us to track the movement down and then catch bounces up.
We will continue to buy dips using our support levels taking 20 to 40 pips. As stated before each of our level structures give 20 to 40 pip bounces, which is enough for a nice entry and exit. If you back test the levels we shared every week for the past 24 months, you can see how effectively they were used to trade with or against short/mid term swings and trends.
The swing range give bigger bounces then our weighted levels that's the difference between weighted levels and swing ranges.
BULLISH TARGET
4222
EMA5 CROSS AND LOCK ABOVE 4222 WILL OPEN THE FOLLOWING BULLISH TARGET
4328
EMA5 CROSS AND LOCK ABOVE 4328 WILL OPEN THE FOLLOWING BULLISH TARGET
4422
EMA5 CROSS AND LOCK ABOVE 4422 WILL OPEN THE FOLLOWING BULLISH TARGET
4494
BEARISH TARGETS
4131
EMA5 CROSS AND LOCK BELOW 4131 WILL OPEN THE FOLLOWING BEARISH TARGET
4042
EMA5 CROSS AND LOCK BELOW 4042 WILL OPEN THE SWING RANGE
3964
3873
As always, we will keep you all updated with regular updates throughout the week and how we manage the active ideas and setups. Thank you all for your likes, comments and follows, we really appreciate it!
Mr Gold
GoldViewFX

GOLD Consolidation bullish testing the upper momentumGold market has been moving within a broad ascending trend channel, recently break the resistance and could move to upside if the price maintain that range we could expect price growth further.
Recently, price broke out strongly to the upside, creating a bullish momentum shift. After clearing the upper trendline, gold pushed into a higher resistance zone highlighted on the chart. The candles show a steep upward move, followed by a projected pullback and continuation pattern illustrated with white arrows.
Gold has been in consolidation, but the recent breakout signals bullish continuation. If price holds above the 4,305–4,332 region, further growth is possible. However, a drop below 4,260 test the support then again price growth to upside.
Overall, the chart illustrates a bullish breakout, a potential retest of the trendline, and an anticipated continuation toward upper resistance targets.
You may find more details in the chart,
Trade wisely best of luck buddies.
Ps: Support with like and comments for better analysis thanks for supporting.

GBPUSD: medium-term opportunities🛠 Technical Analysis: On the 4-hour timeframe, GBPUSD is trading within an ascending channel but is approaching a critical resistance zone near 1.3450. The analysis anticipates a final "liquidity grab" push higher to test this upper boundary (aligning with the 1.34544 level) before exhausting its bullish momentum. Following this peak, a bearish reversal is projected, driven by the structural resistance, targeting a return to the channel support and the SMA cluster around 1.3200.
———————————————
❗️ Trade Parameters (SELL)
———————————————
➡️ Entry Point: Sell at 1.34544
🎯 Take Profit: 1.31994
🔴 Stop Loss: 1.35812
⚠️ Disclaimer: This is a potential trade idea based on current analysis; market conditions and price direction are subject to change based on news factors and volatility.

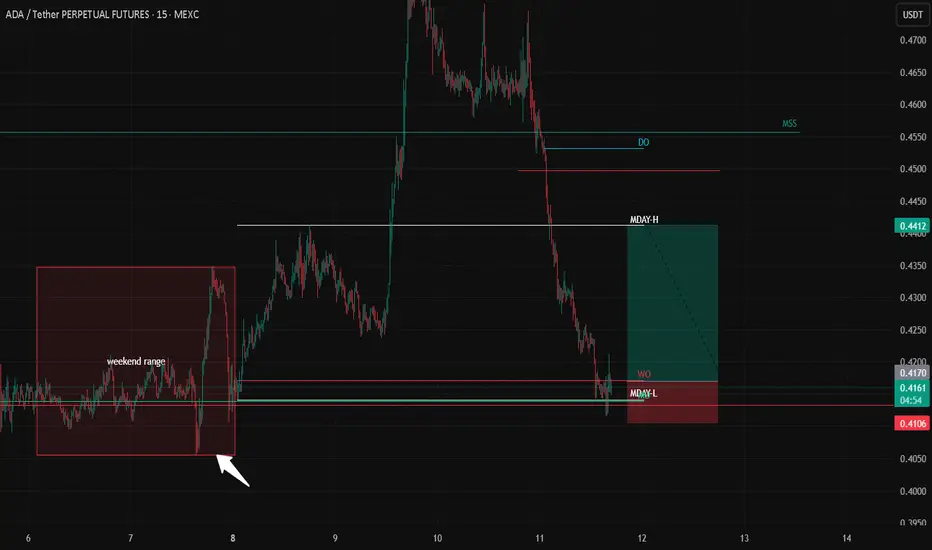
ADA Scalp long ideaScalp long setup
Taking a quick long based on a 5m MSS on Total Market Cap, showing a short-term momentum shift. Price also printed a clean V-shape recovery on the 5m, suggesting downside exhaustion and potential for a retrace toward intraday levels.
Risk-to-reward remains strong, with clear invalidation below the V-shape low.
Risk note: The weekend range hasn’t been taken yet, meaning weekend longs may still be targeted. This increases the risk of the setup — but the 5m MSS R:R is still compelling enough to consider the trade for me
That said, I’m not fully comfortable sharing this setup, given the weekend risk profile.
NFA
MrC

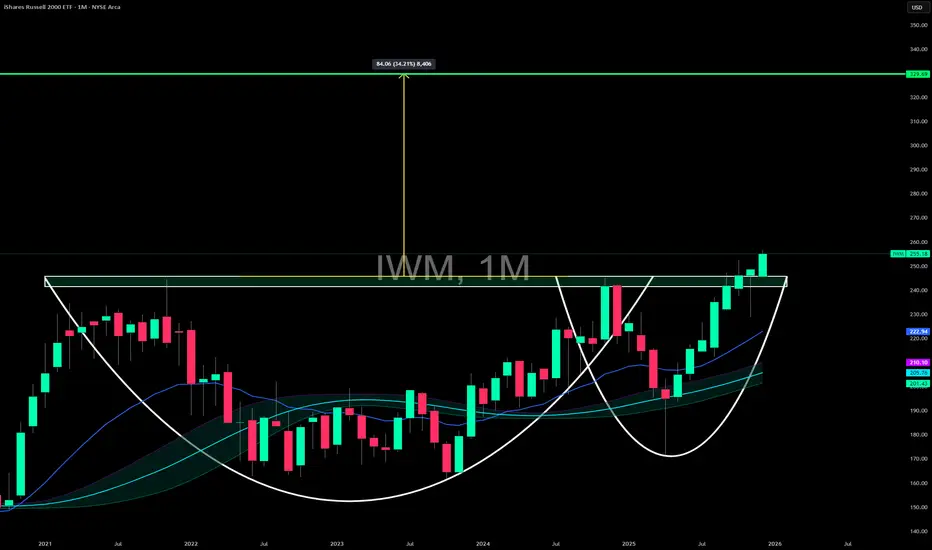
MASSIVE move inbound...🚨 AMEX:IWM is coiling for a MASSIVE move.
We’re breaking out of a 4-year Cup & Handle on the monthly chart—one of the most powerful continuation patterns you can get.
📈 Measured move? ~$330.
Yes… $330.
This checks every box:
• 4 years of underperformance vs. AMEX:SPY and NASDAQ:QQQ
• Small–mid caps are among the most undervalued in the entire market
• Rate cuts are rocket fuel for risk-on segments like AMEX:IWM
• Broad participation = healthier market = Russell strength
This is the breakout I’ve been waiting on.
🔥 Small caps might finally be waking up.
Buckle up.
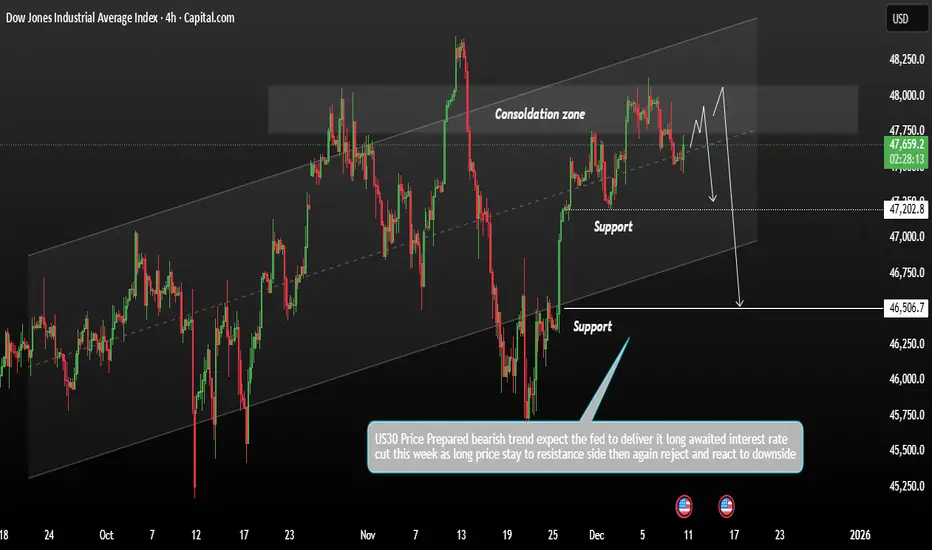
US3O Price Consolidation within its broader bearish momentumUS30 remains in a consolidation phase within its broader bearish trend. After failing to break down convincingly, price may retest overhead resistance before determining the next direction.
Technically Wall Street futures edged slightly higher as traders positioned themselves ahead of one of the most closely watched and divisive upcoming Federal Reserve meetings. Despite this temporary lift, technical structure still favours the bears.
US30 continues to show signs of weakening momentum, and as long as price remains below key resistance levels, bearish control is expected to persist. The index may revisit the support zone between 47,202 and 46,506, which continues to act as an important downside target area.
You may find more details in the Chart.
Trade wisely best of luck buddies.
Ps; Support with like and comments for better analysis thanks for supporting.
BTCUSDT Bullish Reversal: Potential Move to Supply Zone at 93,58BTCUSDT has recently formed a strong low around 89,205, suggesting that the market could be preparing for a bullish reversal. The price has pulled back into the demand zone, offering a potential entry point for traders looking to capitalise on this move. This setup follows a break of structure (BOS) to the upside, indicating that the market may be shifting towards a bullish trend.
As the price approaches the demand zone, traders should closely monitor for any signs of confirmation, such as a bullish candlestick pattern or a significant increase in volume. These signals could provide the necessary confirmation that the market is ready to move higher. The strong low near 89,205 is expected to provide support, and a bounce from this level could push the price back towards higher levels.
The next key target for Bitcoin is the supply zone around 93,580, which represents a potential area of liquidity. Once the price enters this zone, it is important to monitor the price action for signs of rejection or continuation. If the price breaks through the supply zone, it could indicate further upside momentum. However, if the price fails to break through, a reversal could be expected, and traders should be prepared for potential pullbacks.
For those considering entering the market, it is crucial to wait for confirmation before placing any trades. Entering prematurely could expose traders to unnecessary risk, as the market could still reverse or consolidate. A well-timed entry at the demand zone with proper risk management strategies in place could yield positive results if the market continues to move higher.
In summary, BTCUSDT is showing signs of bullish potential after forming a strong low and pulling back into the demand zone. Watch for confirmation before entering, and use the supply zone at 93,580 as a key level to monitor for possible price rejection or breakout. Proper risk management is essential to navigate this setup and capitalise on potential price movements."

Gold Market Update & Technical OutlookGold currently leans bearish, but the next move will depend heavily on how the price behaves around key intraday levels.
If the 1-hour candle closes above 4230, market structure may begin to shift bullish. In that case, the price could retest the resistance zone near 4253.
A rejection from this zone may lead to a pullback toward previous support before any continuation higher if bullish momentum fails to hold, and price reacts weakly, gold may revisit the medium-term support area between 4200 and 4182, these levels will be important to watch for confirmation of either scenario.
If you found this analysis helpful, feel free to leave a comment and share—thanks!

Breaking: Adobe Forecasts Annual Revenue Above EstimateAdobe (NASDAQ; ADBE), forecast fiscal 2026 revenue and profit above Wall Street expectations on Wednesday, signaling strong demand for the Photoshop maker's design tools and increasing monetization for its artificial intelligence offerings.
Since the launch of ChatGPT in 2022, Adobe has made heavy bets on generative AI with its Firefly tool, which can be integrated across the company's Creative Cloud suite to create images and videos, in an attempt to draw users in.
Adobe is seeing strong growth in AI adoption, with monthly active users for its freemium offerings increasing 35% year over year to over 70 million, Says CFO Dan Durn.
"We're seeing significant strength in Creative Cloud Pro, Photoshop, Lightroom," he said, adding that natively embedding generative AI into these products is paying off.
In its push into the ad market, last month, Adobe said it would acquire Semrush (SEMR.N), opens new tab for $1.9 billion to help marketers better understand how their brands are seen by online consumers through searches on websites and GenAI bots such as ChatGPT and Gemini.
Technically, NASDAQ:ADBE stock is in a Diamond-like pattern characterised by a widening and then narrowing price range, creating a shape similar to a diamond. These pattern often provide us with a hint of market reversal points in the financial markets.
With RSI at 58 s little thrust from NASDAQ:ADBE stock to break the ceiling of the diamond could resort to a bullish reversal pattern in the long run.
Analyst Summary
According to 23 analysts, the average rating for ADBE stock is "Buy." The 12-month stock price target is $453.48, which is an increase of 32.16% from the latest price.
About ADBE
Adobe Inc. operates as a technology company worldwide. Its Digital Media segment offers products and services that enable individuals, teams, and enterprises to create, publish, and promote content; Document Cloud, a cloud-based document services platform; and Creative Cloud, a subscription service that allows subscribers to use its creative products and applications (apps) integrated with cloud-delivered services across various surfaces and platforms

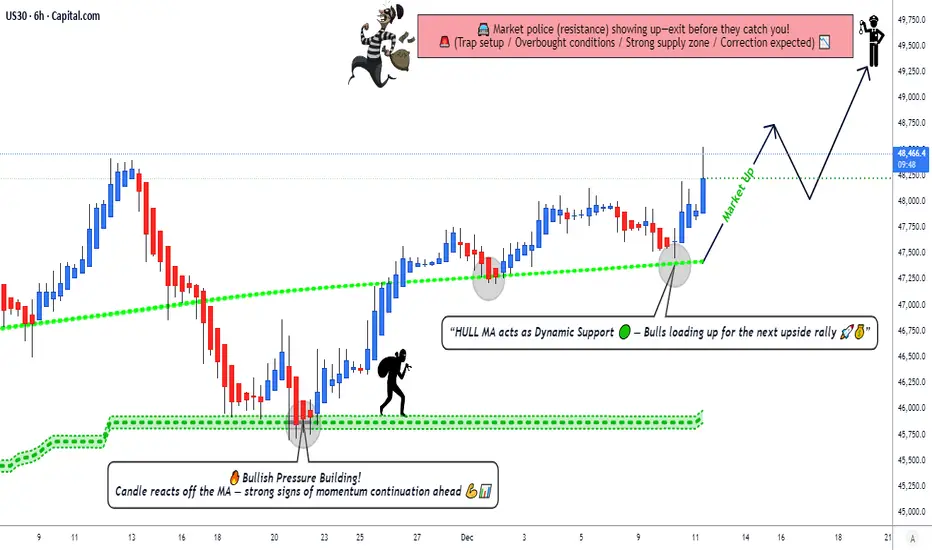
US30 Momentum Rebuild: Breakout Retest Signals Potential Upside📈 DJI30 / US30 – Dow Jones Industrial Average Trade Opportunity Guide
🏛️ Market Context
The index is showing strong accumulation pressure, with buyers stepping back in as volatility narrows. Momentum tools and trend metrics continue to lean toward the upside, creating a setup where disciplined layering becomes highly effective for precision entries.
🔥 Trade Plan – Bullish Strategy in Play
✅ Technical Confirmation
KIJUN MA accumulation indicates steady buy-side pressure building beneath price.
HULL Moving Average breakout completed with a clean pullback + retest, confirming trend continuation strength.
Market structure remains constructive with higher lows forming consistently.
🎯 Entry Plan (Layering Method Included)
Any price level can be used, but this plan uses Thief Layering Strategy for controlled scaling:
💠 Buy Limit Layers:
47,000
47,250
47,500
47,750
48,000
(Traders can add more layers depending on personal risk and capital allocation style.)
🛡️ Stop Loss (SL)
Thief SL → 46,750
Dear Ladies & Gentlemen (Thief OGs): Please adjust according to personal strategy and risk. This SL is an example, not a fixed rule. Trade with your own management principles.
🎯 Target (TP)
Main Target → 49,500
The market is approaching major moving-average resistance + overbought zones + potential trap regions. It’s wise to secure profits as the index reaches upper supply levels.
Again, Ladies & Gentlemen (Thief OGs): TP is flexible. Manage your profit bookings based on your personal approach.
🌍 Related Pairs to Watch & Correlations
1️⃣ SP:SPX / S&P 500
Often moves in high correlation with US30.
Strong bullish momentum here typically supports US30 upside.
Watch for divergence → if SPX stalls while US30 pushes, upside may weaken.
2️⃣ NASDAQ:NDX / NAS100 (Nasdaq 100)
Tracks tech sentiment, which influences overall US risk appetite.
If NAS100 shows weakness while Dow is rising, expect mixed flows → Dow may slow down but still hold structure.
3️⃣ TVC:VIX (Volatility Index)
Inverse correlation to US30.
Falling VIX = stronger risk-on behavior, supporting bullish Dow positions.
Sudden VIX spikes signal caution on existing long positions.
4️⃣ TVC:DXY (US Dollar Index)
Strong Dollar sometimes suppresses equity momentum.
If DXY drops, US30 tends to gain strength as liquidity flows to equities.
5️⃣ CBOT_MINI:YM1! (Dow Futures)
The closest real-time mirror of US30 price action.
Useful for re-entry timing during pullbacks and session gaps.
🧭 Final Notes
Stay disciplined with your own SL/TP logic, manage exposure through layered entries, and monitor correlation assets for confirmation. This is a flexible play designed for DAY & Swing traders who thrive in momentum-driven environments.
XRP/USDT Long
— Strong $2 support retested, higher-timeframe divergence in play, and a retest of the lower accumulation trendline. The rate-cut news has already been priced in. The cut itself means liquidity is coming.
— Entry: $2.015 (market buy)
— Stop: $1.98 (-1.65% price movement from entry; not percentage loss)
— Target: $2.25
Risk per trade: 0.3% of total account (this is the actual potential loss)
Position size: 15% of account, 10x leverage
RR: 1:7

EURUSD Sell Setup: Rejection at Resistance, Potential DowntrendEUR/USD is encountering strong resistance near the swing high. After a break of structure (BOS) and change of character (ChOCH), a reversal seems likely. Price action shows slowing momentum at this resistance zone, which suggests a potential decline towards the demand zone. Sellers should look for confirmation of rejection at this level, such as a bearish candle formation or a failed attempt to break the resistance. A successful rejection could trigger a short position targeting lower support areas. Watch for price to test the demand zone for further signs of a continued downtrend.

BTCUSD: Bullish Structure Intact as Price Eyes $95,000 Breakout.Analysis:
Bitcoin is currently trading around $90,050, holding within a constructive range after recent volatility. The market structure continues to lean bullish as buyers defend key demand zones and sentiment remains supportive across the crypto landscape.
🔹 Key Technical Levels
Support: $89,445
Resistance: $92,625
Bullish Targets: $95,000
Price remains above the $89,445 support, which is acting as a strong base for continued upside movement. As long as this level holds, BTCUSD maintains a bullish structure. A breakout above $92,625 would confirm renewed momentum and open the door toward the next major upside target at $95,000.
Market flow suggests increasing buying interest on dips, and the overall trend structure favors continuation to the upside. If bulls secure a daily close above resistance, the path toward $95,000 becomes highly probable.
🔸 Outlook
BTCUSD remains positioned for a bullish continuation as long as support is respected. Traders should watch the $92,625 resistance closely for a decisive breakout that validates the next leg higher.
Regards: Chart Analyst Pro
#BTCUSD #Bitcoin #BTCAnalysis #CryptoTrading #CryptoMarket #BTCBullish #BitcoinPrice

KSE-100 Index - Cup & Handle FormationOn daily TF, KSE-100 index has made a Cup formation and likely handle formation is quite possible.
RSI and Stochastic indicators are suggesting that index is likely to continue its upward momentum; however, likely formation of Cup & handle cannot be over ruled.
Anyway, It looks as if by beginning of year 2026 bull run will be quite confirm which should last till May 2026 at least.
However, key value to confirm the bull run is closing of daily index above 172,000. Likely value for Index to test are 183000 and 197,000. Then three to five odd weeks of very sharp up trend till 220,000 to 224,000 zone will trigger the market sharp break down and eventually will cause Bear run spanning for at least 4 years.
What you guys think ?

XAU/USD Elliott Wave Analysis: Potential Bearish Reversal OANDA:XAUUSD PEPPERSTONE:XAUUSD ICMARKETS:XAUUSD
The chart suggests that Gold Spot/U.S. Dollar (XAU/USD) has completed a major correction pattern and is now on the verge of a significant downward move.
Major Correction (A) ➡️ (B):
The price action from the major peak appears to be forming a complex correction, with the current phase completing the major (B) wave.
The sharp drop to the low around November 1st is labeled as a major (A) wave.
The subsequent rally is labeled as the major (B) wave, which is currently subdividing.
Subdivision of Wave (B): The corrective rally (B) is showing signs of completion as a smaller ABC pattern:
o Wave A (of B): A strong 5-wave impulse (labeled 1-2-3-4-5) completed in mid-November.
o Wave B (of B): A correction followed this high.
o Wave C (of B): The current rally is the final leg, Wave C (of B), aiming for the final target.
• Critical Reversal Target for (B) Wave: The chart anticipates the completion of the final Wave C (of B) at a specific price point, coinciding with a key Fibonacci level and trendline resistance:
61.80% Fibonacci Retracement at $4,313.88
This $4,313 zone is the high-probability reversal point before the major downside move begins.
📈 Technical Levels and Trendlines
Major Resistance (The Reversal Zone):
Upper Red Trendline: This descending trendline connects the initial peak with the top of the internal Wave (B), serving as strong dynamic resistance.
Key Price Target: The $4,313.88 level is the projected apex of the rally.
Understood. Here is the full analysis and titles for your post, presented in English, as requested.
📉 XAU/USD Elliott Wave Analysis: Potential Bearish Reversal from $4,313
🌊 Wave Count Interpretation (Elliott Wave)
The chart suggests that Gold Spot/U.S. Dollar (XAU/USD) has completed a major correction pattern and is now on the verge of a significant downward move.
Major Correction (A) ➡️ (B): The price action from the major peak appears to be forming a complex correction, with the current phase completing the major (B) wave.
The sharp drop to the low around November 1st is labeled as a major (A) wave.
The subsequent rally is labeled as the major (B) wave, which is currently subdividing.
Subdivision of Wave (B): The corrective rally (B) is showing signs of completion as a smaller ABC pattern:
Wave A (of B): A strong 5-wave impulse (labeled 1-2-3-4-5) completed in mid-November.
Wave B (of B): A correction followed this high.
Wave C (of B): The current rally is the final leg, Wave C (of B), aiming for the final target.
Critical Reversal Target for (B) Wave: The chart anticipates the completion of the final Wave C (of B) at a specific price point, coinciding with a key Fibonacci level and trendline resistance:
61.80% Fibonacci Retracement at $4,313.88
This $4,313 zone is the high-probability reversal point before the major downside move begins.
📈 Technical Levels and Trendlines
Major Resistance (The Reversal Zone):
Upper Red Trendline: This descending trendline connects the initial peak with the top of the internal Wave (B), serving as strong dynamic resistance.
Key Price Target: The $4,313.88 level is the projected apex of the rally.
Major Support (The Target Zone):
Lower Green Trendline: This ascending trendline connects the key lows and represents the potential final target for the upcoming decline.
Target Price Zone: The final target for the major (C) wave is indicated near the $3,826.25 level.
🎯 Trading Strategy Implication
Imminent Move: The price is completing the final internal wave towards the $4,313.88 reversal zone.
Short Entry: The ideal short-entry zone is near the $4,313.88 level, with a tight stop-loss placed just above the upper red trendline to manage risk.
Profit Target: The anticipated sharp decline, labeled as the massive (C) wave, targets the lower green trendline around $3,826.25, offering a substantial risk/reward opportunity.
Disclaimer:
This analysis is for educational purposes only and is based on Elliott Wave Theory and technical indicators. It is not financial advice. Trading foreign exchange, cryptocurrencies, and commodity futures involves significant risk of loss and is not suitable for all investors. Past performance is not indicative of future results.
Always do your own research

Gold | Bulls Loading UpGold is currently pulling back into a key intraday support zone near the 200-EMA after a sharp bullish spike, creating an ideal “dip-buy” opportunity as long as price holds above the 4,209–4,210 region. The corrective candles show shrinking bearish momentum, while the MACD histogram is easing—hinting that sellers are losing strength. As long as the support holds, buyers can target the upside continuation toward 4,245, with a well-defined stop around 4,200 to maintain a clean risk-reward profile. A bounce from this area could trigger the next bullish leg, making this setup attractive for momentum-based long entries

EURUSD: Buying the Dip on Central Bank Divergence⚡ Macro Thesis: Monetary Divergence underway.
Fed (Dovish): Market convinced of a rate cut in December.
ECB (Neutral/Hawkish): Lagarde signals there is no rush to cut further given that service inflation remains sticky. This narrowing of the interest rate spread favors the euro against the dollar in the medium term.
📊 Technical Setup (D1/H4): The pair has broken the psychological resistance of 1.1600. We are looking for a retest of this zone (now support) to enter the trend.
Entry Zone: 1.1620 - 1.1630 (Pullback on former resistance)
Trigger: Level held on H4 with bullish price action.
Stop Loss: 1.1575 (Invalidation of the bullish structure).
Target: 1.1750 (Bullish projection).
⚖️ Risk/Reward: ~1:2.2
Happy trading!
Sic Parvis Magna

AUDUSD: resistance rejection🛠 Technical Analysis: On the 4-hour timeframe, AUDUSD has flashed a "Global bullish signal" via a Golden Cross (SMA 50 crossing above SMA 100, SMA 200). The price is currently consolidating above the breakout zone, with a short-term rally projected towards the strong resistance level at 0.6700. The trade setup anticipates a "sell-the-news" reaction or technical rejection at this ceiling, targeting a bearish rotation back towards the support cluster around 0.6615.
———————————————
❗️ Trade Parameters (SELL)
———————————————
➡️ Entry Point: Sell Limit at Resistance (approx. 0.6700 – 0.6710)
🎯 Take Profit: 0.6615 (Support)
🔴 Stop Loss: Above the resistance structure (approx. 0.6735)
⚠️ Disclaimer: This is a potential trade idea based on current analysis; market conditions and price direction are subject to change based on news factors and volatility.

Can Gold Reach 4265? US Session Strategy Update.
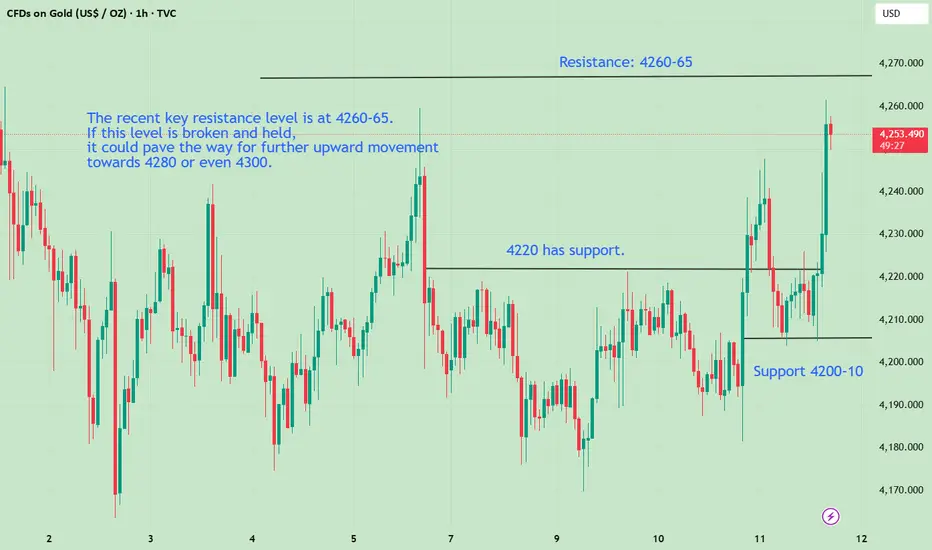
Gold prices rebounded after a brief dip this trading day, consolidating at higher levels. Throughout the day, it remained firmly above the key support level of 4200, indicating a clear bullish bias. Our strategy of buying in batches between 4200 and 4210 was wise, yielding multiple profitable buy-low-sell-high trades. In the US session, positive initial jobless claims data further boosted gold. The key resistance level recently is 4260-65. Watch this level closely; a break and hold above it could lead to further gains towards 4280 or even 4300. The key is whether the US session can break the current stalemate.
Today, you must seize every opportunity to buy on dips. If you struggle with precise execution, try my method: first test the market with a small position, then add to your position on pullbacks. This way, you won't miss any opportunities. If you need to recover significant losses or obtain precise trading signals, you can...
True high-level trading isn't about sifting through massive amounts of information, but about extracting the essence, focusing on the most effective signals, repeatedly applying them, and continuously optimizing them. The simpler the strategy, the more stable the results. The more focused the execution, the more profitable you'll be in the face of market volatility. Our stable returns are the best proof.