US100 | NASDAQ – 15 Min Price & Time Analysis NASDAQ (US100) is trading inside a critical Price & Time zone based on Gann 144.
Primary scenario (Sell):
Sell is activated only after a clear break below 25150.
SL: 25320
Targets: 24980 – 24880 – 24750
Alternative scenario (Buy correction):
Buy only if price breaks and holds above 25350.
SL: 25150
Targets: 25500 – 25620
Current movement is corrective within a broader bearish structure.
Risk management is required.
US100, NASDAQ, GANN, PRICEACTION, INTRADAY
X-indicator

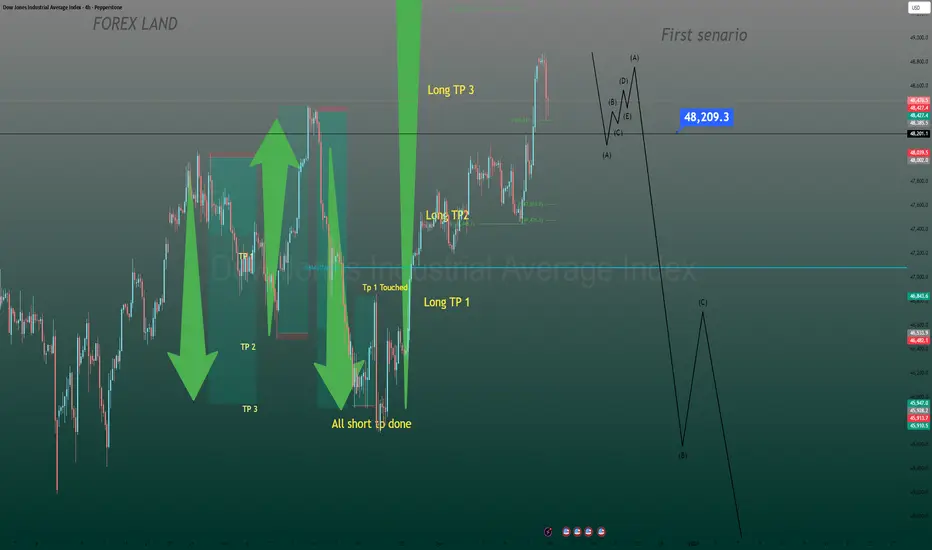
Dow Jones Is About to Show Its Hand This WeekIn my view, the market is about to show its hand this week, and this could open the door for another round of strong, high-quality trades.
The 48,209 level is extremely important for me.
If price moves below this level, the scenario becomes very clear — from that point on, I’ll be focused only on short positions.
For now, I’m closely monitoring how the market reacts around this zone.
I’ll share the second scenario in the next post.
The system that turned ordinary traders into millionaires!!🐢 Turtle Trading Strategy
A classic, rule-based, and repeatable trend trading system
Introduction
The Turtle Trading strategy is one of the most documented and successful trading systems in financial market history. It was designed in the 1980s to prove that trading is a skill that can be taught, not an innate talent.
This strategy is built on three key principles:
• Trend Following
• Strict Risk Management
• Eliminating Emotional Decision-Making
1. Suitable Markets and Timeframes
Turtles only traded markets with the potential for large, sustained trends.
Suitable markets:
• Commodities (oil, gold, metals)
• Forex
• Indices
• Cryptocurrencies
Recommended timeframes:
• Daily (as the main timeframe)
• Weekly for long-term trend filtering
📌 Higher timeframes provide more reliable signals.
2. Entry Logic
Entries in this system are based on price breakouts, not predicting reversals.
System 1 – Short-Term Breakouts
• Buy: Break above the high of the last 20 candles
• Sell: Break below the low of the last 20 candles
System 2 – Long-Term Breakouts
• Buy: Break above the high of the last 55 candles
• Sell: Break below the low of the last 55 candles
📌 Enter only after a candle closes beyond the valid range.
ICT Turtle Soup Indicator:
To optimize entries, especially in short-term breakouts, the ICT Turtle Soup indicator can be used. It focuses on false breakouts, helping reduce invalid signals:
Identifies short-term high/low breakouts and checks volume/strength
Trades in the opposite direction of false breakouts (e.g., high breakout → short)
Quick exits with stop-loss near the breakout level
This tool allows the classic Turtle system to improve entry accuracy and reduce risk.
3. Filtering Invalid Trades
To avoid trading in ranging markets:
• If the last trade in the 20-day system was profitable → ignore the next signal
• If the last trade was a loss → the next trade is allowed
This rule ensures the system is only active under favorable conditions.
4. Stop-Loss and Exit Rules
Initial Stop-Loss:
• Distance: 2 × N (market volatility)
• Placed where the trend scenario is invalidated
Exit:
• Long trades: Break below the low of the last 10 candles
• Short trades: Break above the high of the last 10 candles
📌 Exits are entirely mechanical; no reevaluation is needed.
5. Risk Management
The core of the Turtle Trading system is risk management, not entry timing:
• Risk per trade: maximum 1% of capital
• Trade size adjusted according to market volatility
• All trades evaluated independently
🎯 Goal: Survive the market until large trends develop
6. Pyramiding
Turtles built big profits by adding positions logically:
• Add positions only on profitable trades
• Every 0.5 × N, add a new position
• Maximum 4–5 positions per trend
• Manage stop-loss across all positions
7. Psychological Structure
This strategy is psychologically challenging:
• Many small losses
• Few very profitable trades
• Low win rate but positive expected value
📌 Traders must endure losing streaks without breaking the rules.
8. Strengths and Weaknesses
Strengths:
• Fully rule-based and testable
• Removes emotions from decision-making
• Applicable across all markets
• Compatible with automation
Weaknesses:
• Weak performance in ranging markets
• Requires patience and discipline
• Occasional drawdowns
Final Summary
The Turtle Trading strategy teaches you to:
• React, don’t predict
• Accept losses quickly
• Let profits run
• Stick to the rules
• Use modern tools like ICT Turtle Soup to improve entry accuracy and turn false breakouts into opportunities
In this system, “being right” doesn’t matter; adherence to rules determines success.


Apple Inc. Swing Setup – Breakout or Breakdown Ahead?🍎 AAPL | Apple Inc. - Swing Trade Profit Blueprint 💰
NASDAQ: AAPL | Breakout Pattern Setup ⚡
Master the Swing Trade Game 🎯
📊 TECHNICAL OVERVIEW
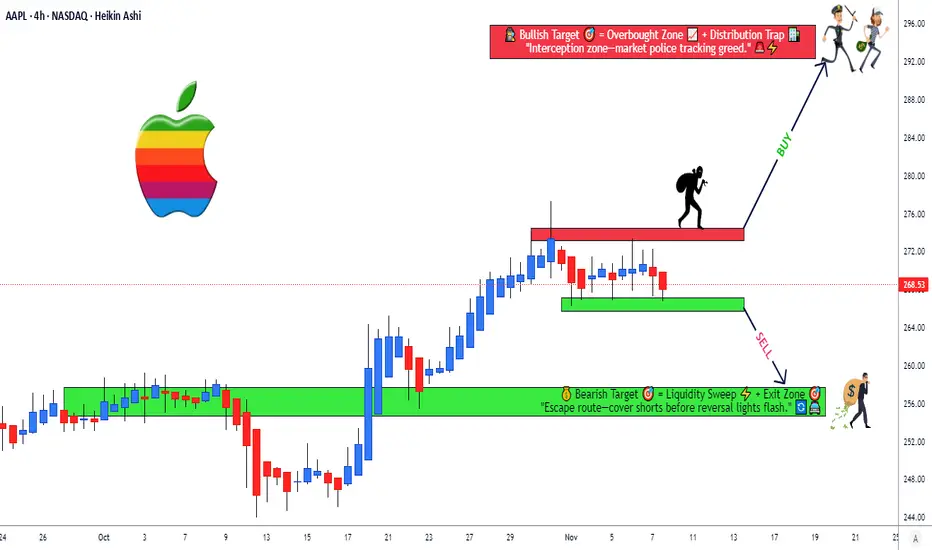
Currently trading at $268.47 with strong momentum indicators aligning for a breakout scenario. Apple is positioned in a critical decision zone with defined technical levels offering professional risk/reward opportunities.
🎲 Market Structure: Tight consolidation phase with multiple confluences at key resistance and support zones.
📈 SWING TRADE SETUP - DUAL SCENARIO ANALYSIS
SCENARIO 1: BULLISH BREAKOUT 🚀
Entry Signal: Price breaks above resistance with volume confirmation
Entry Zone: Above $272.00 (Daily Close Confirmation)
Initial Target: $290.00 TP1 🎯
Extended Target: $295.00 TP2 (Ultimate Profit Zone) 🏆
Stop Loss: $264.00 (Risk Management Point) 🛑
SCENARIO 2: BEARISH BREAKDOWN 📉
Entry Signal: Price breaks below support with selling pressure
Entry Zone: Below $266.50 (Daily Close Confirmation)
Target 1: $262.00 TP1 🎯
Target 2: $256.00 TP2 (Profit Protection Zone) 🏆
Stop Loss: $276.00 (Risk Management Point) 🛑
🔍 KEY TECHNICAL FACTORS
✅ Momentum Alignment: Multiple timeframe convergence detected
✅ Volume Profile: Above average volume supporting breakout potential
✅ Support/Resistance: Well-defined levels from historical price action
✅ RSI Positioning: Neutral to strong momentum setup
✅ Moving Averages: Key dynamic support levels in play
🎯 SCENARIO CORRELATION PAIRS TO MONITOR
Primary Correlations:
🔗 NASDAQ:MSFT (Microsoft) - Tech sector strength indicator | Tech giants move together | Watch for divergence signals
🔗 NASDAQ:QQQ (Nasdaq-100 ETF) - Broader market direction | If QQQ breaks down, AAPL pressure increases | Use as macro confirmation
🔗 AMEX:VGT (Vanguard Info Tech ETF) - Sector sentiment gauge | Tech rotation plays | Confirms sector health
🔗 AMEX:IVV (iShares S&P 500 ETF) - S&P 500 correlation | Broad market support/resistance | Risk-on/risk-off indicator
🔗 AMEX:GLD (Gold) - Risk sentiment inverse correlation | Gold up = Risk-off = Tech pressure | Macro economic climate
📍 IMPORTANT REMINDERS FOR TRADERS
Your Entry Is Your Choice ✓ Only enter when YOUR checklist is complete
Your Stop Loss Is Your Decision ✓ Set it where YOU feel comfortable with risk
Your Take Profit Is Your Call ✓ Exit when your profit target is achieved or thesis breaks
Every trader's risk tolerance differs. These levels are technical reference points, not personal recommendations.
🎓 STRATEGY NOTES
✨ Best used on 1H-4H timeframes for swing trading
✨ Volume confirmation is CRITICAL before entries
✨ Wait for candle closes above/below levels - no wick trading
✨ Use this alongside your own technical analysis
✨ Market conditions can invalidate setups rapidly - stay flexible
✨ The breakout zone is where patience rewards traders
💡 CORRELATION SUMMARY
Green Lights ✅: When MSFT, QQQ, and VGT all confirm uptrend = Stronger AAPL bullish case
Yellow Caution ⚠️: When divergence appears between AAPL and QQQ = Possible reversal warning
Red Lights 🔴: When GLD spikes & IVV breaks support = Risk-off environment = Tech pressure incoming
✨ If you find value in my analysis, a 👍 and 🚀 boost is much appreciated — it helps me share more setups with the community!
Broadcom Technical Setup - Systematic Entry Approach🎯 AVGO: The Great Heist Setup | Layered Entry Strategy 💰
📊 Asset Overview
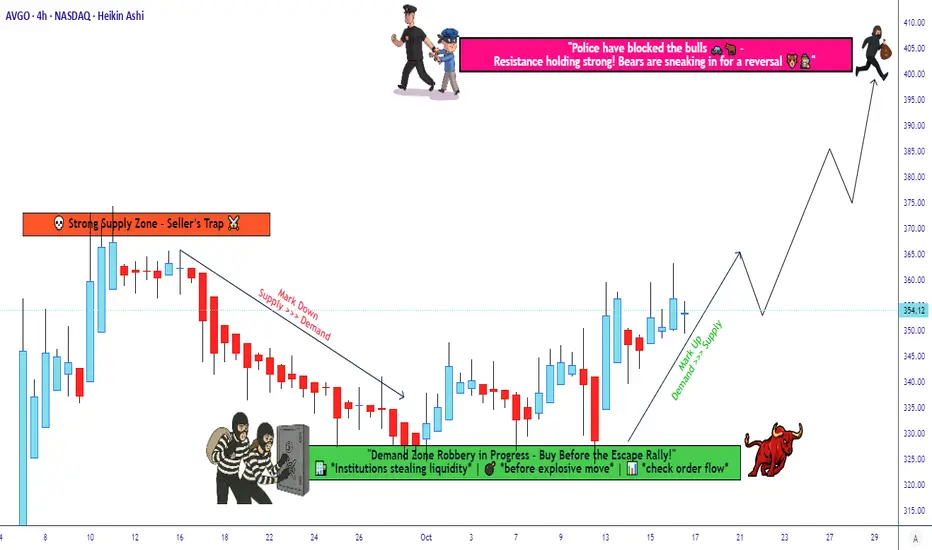
Broadcom Inc. (AVGO) - The semiconductor kingpin that's been printing money like a Vegas casino! 🎰
🎭 The Heist Plan: BULLISH Setup
Strategy Style: The "Thief Method" - Layered Limit Orders (Ocean's Eleven style but legal! 😎)
🚪 ENTRY ZONE: The Multi-Layer Approach
This ain't your grandma's single entry point! We're going full stealth mode with multiple limit buy orders spread across the zone like a well-planned heist:
Suggested Entry Layers:
💵 Layer 1: $330
💵 Layer 2: $340
💵 Layer 3: $345
💵 Layer 4: $350
💵 Layer 5: $355
OR feel free to enter at ANY current price level if you're feeling bold! 🎲
Pro Tip: You can add more layers based on your capital and risk appetite. More layers = Better average price = Smoother ride! 🎢
🛑 STOP LOSS: The Emergency Exit
Thief's Escape Hatch: $320
⚠️ RISK DISCLAIMER: Dear Thief OG's (Ladies & Gentlemen of Fortune), this is MY stop loss level for MY strategy. You're the boss of your own money! Set your SL based on YOUR risk tolerance. Make money, take money - at your own risk! 🎲
🎯 TARGET: The Vault Unlocks Here!
POLICE BARRICADE ZONE (Strong Resistance Alert! 🚨): $400
This level is where we expect:
💪 Strong resistance
📈 Overbought conditions brewing
Bull traps potentially forming
Strategy: Escape with your bags of cash before the sirens go off! 🚔💨
⚠️ PROFIT DISCLAIMER: Again, Thief OG's - this is MY target, not financial advice! Take profits whenever YOUR plan says so. Your money, your rules, your responsibility! 💯
🔗 Related Pairs to Watch (Correlation Play)
Keep your eyes on these accomplices in the semiconductor/tech heist:
NASDAQ:NVDA (NVIDIA) - The GPU mastermind, moves often correlate with AVGO
NASDAQ:AMD (Advanced Micro Devices) - Another chip champ in the gang
NYSE:TSM (Taiwan Semiconductor) - The supplier kingpin
NASDAQ:QCOM (Qualcomm) - Wireless chip crew member
NASDAQ:SMH (VanEck Semiconductor ETF) - The whole gang in one basket
Key Correlation: When semiconductor sector heats up, AVGO typically rides the wave. Watch NASDAQ:SMH for sector-wide momentum! 📡
🎪 Why This Setup Works (Technical Edge)
✅ Layered entries reduce timing risk
✅ Multiple support zones below current price
✅ Clear risk/reward structure
✅ Room to run toward resistance at $400
✅ Semiconductor sector showing strength
🎬 Final Words from Your Friendly Neighborhood Thief
This is the "Thief Strategy" - a layered, calculated approach to catching moves in AVGO. It's all about spreading your risk, averaging your entry, and having a clear exit plan whether things go right (🎯 $400) or wrong (🛑 $320).
Remember: The best thieves always have an escape plan! 🏃💨
Trade smart, not hard! And always remember: Past performance doesn't guarantee future results, but a solid plan beats panic every time! 🧠💪
✨ If you find value in my analysis, a 👍 and 🚀 boost is much appreciated — it helps me share more setups with the community!
#AVGO #Broadcom #SwingTrading #DayTrading #TradingStrategy #StockMarket #TechnicalAnalysis #LayeredEntry #ThiefStrategy #Semiconductors #TechStocks #RiskManagement #TradingIdeas #StockTrading #BullishSetup #TradingView #MarketAnalysis #PriceAction #SupportAndResistance
LLY Market Blueprint – From Pullback Base to Profit Zone🎯 LLY Stock Market Heist Plan 🏦💰 | Swing Trade Setup
📊 Asset Overview
Eli Lilly and Company (LLY) - NYSE
Pharmaceutical Giant | Market Cap Leader
🔍 The Setup: What We're Seeing
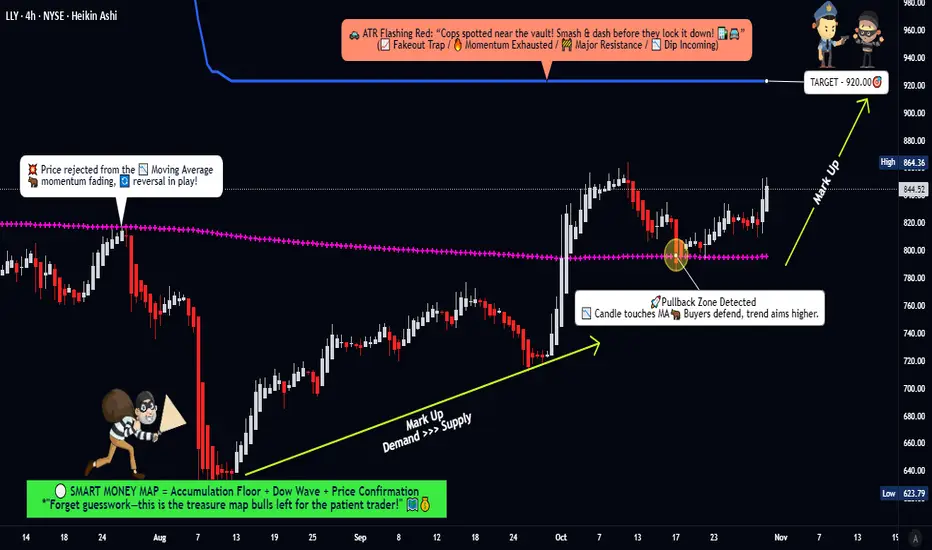
The chart is screaming opportunity! 🚨 LLY is showing classic bullish pullback behavior with strong accumulation zone activity. We've got:
✅ Accumulation Zone Pressure - Big money is quietly loading up
✅ Weighted Moving Average Breakout & Retest - Technical confirmation ✓
✅ Bullish Momentum Building - The spring is coiling for the next leg up
🎯 The Thief's Game Plan
Entry Strategy: The Layered Approach 🪜
You've got two options here, fellow thieves:
Option 1: Simple Entry
→ Any current price level works if you're confident in the setup
Option 2: The Thief's Layered Entry 🧠
This is where we get tactical. Use multiple limit orders to ladder into the position:
Layer 1: $780
Layer 2: $800
Layer 3: $820
Layer 4: $840
You can add more layers based on your capital and risk tolerance. This approach averages your entry and reduces timing risk.
🛑 Risk Management: The Escape Hatch
Stop Loss: $760
⚠️ Important Note: This is MY stop loss level based on my risk tolerance and analysis. You are the captain of your own ship! Set your SL based on YOUR risk appetite. Make money, take money - but do it at your own risk. 🎲
💰 Target: The Vault 🏦
Take Profit: $920
Here's the situation: The ATR line is sitting at $920 acting like a police barricade 🚔. This is a strong resistance zone where:
Overbought conditions likely
Potential trap zone for late entries
Natural profit-taking area
🎯 My Advice: When you reach the vault, grab the cash and RUN! Don't get greedy.
⚠️ Another Important Note: This is MY target. You make your own rules. Scale out, hold longer, take profits earlier - whatever fits YOUR trading plan. This is your heist, not mine! 💼
📈 Related Pairs to Watch
Keep these on your radar for correlation and broader market context:
Healthcare/Pharma Sector:
NYSE:JNJ (Johnson & Johnson) - Healthcare bellwether, moves often correlate
NYSE:UNH (UnitedHealth Group) - Health sector leader, shows sector strength
NYSE:PFE (Pfizer) - Direct pharma competitor, industry sentiment gauge
NYSE:ABBV (AbbVie) - Biopharmaceutical peer, similar market dynamics
Market Context:
AMEX:SPY (S&P 500 ETF) - Overall market direction matters
AMEX:XLV (Health Care Select Sector SPDR) - Sector health indicator
Key Correlation Points:
LLY often leads pharma sector during strong diabetes/obesity drug cycles
Watch NYSE:JNJ for defensive rotation signals
AMEX:SPY correlation increases during risk-on markets
AMEX:XLV breakouts often precede individual pharma stock runs
🎭 The Thief's Philosophy
This setup combines patience (layered entries), discipline (clear stop loss), and calculated risk-taking (defined target). We're not gambling - we're executing a well-planned heist with multiple contingencies.
The market is the vault. The chart is the blueprint. Your risk management is your getaway car. 🚗💨
Remember: The best thieves know when to strike AND when to walk away. Don't fall in love with a position. Take your profits and live to steal another day! 😎
✨ If you find value in my analysis, a 👍 and 🚀 boost is much appreciated — it helps me share more setups with the community!
#LLY #EliLilly #SwingTrading #StockMarket #TechnicalAnalysis #NYSE #PharmaStocks #BullishSetup #TradingStrategy #ThiefStyle #LayeredEntry #RiskManagement #PriceAction #MovingAverage #AccumulationZone #HealthcareStocks #TradingIdeas #StockTrading #ChartAnalysis #MarketHeist
ETH-USDTIt has once again reached its static support floor at $3020. This is an important support for Ethereum, which has reacted to it multiple times, so for now, this support could slow down the correction 📉📈
On the other hand, for a rise, it needs to break the trendline and the static level at $3150 📈
If it breaks, it could have a new leg up to $3380 ✔️🚀

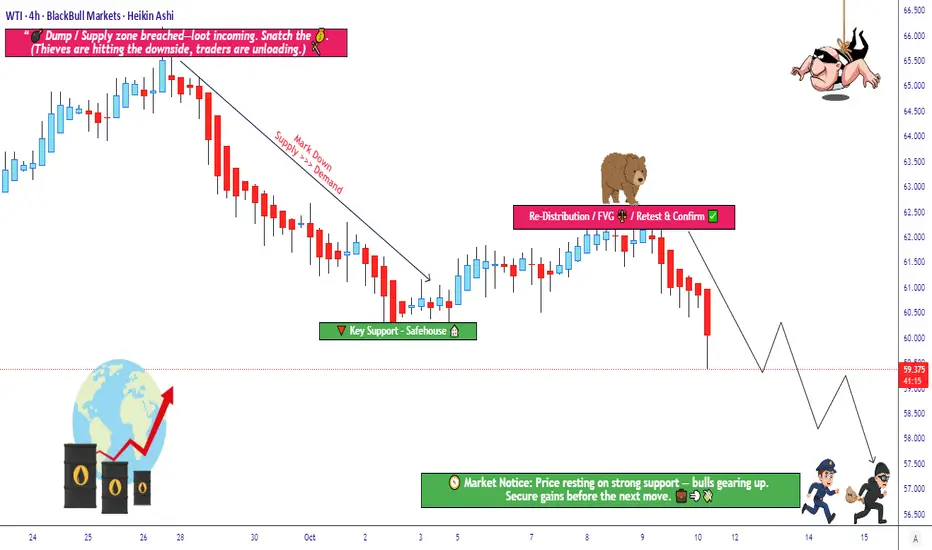
Is Crude Oil Setting Up for a Major Bearish Reversal?🛢️ XTI/USD “WTI” – Bearish Redistribution Zone Incoming (Thief Strategy Inside)
📉 Setup Overview
Market: XTI/USD (WTI crude oil)
Bias: Bearish confirmed — we’re looking for re-distribution / supply pressure to take control
Trade Type: Swing / Day Trade hybrid
🎯 Entry Plan (Thief-Layer Strategy)
I use a layering / multiple limit order approach (aka “Thief Strategy”). You may use any price level as entry, but here’s my preferred ladder:
Sell Limit @ 61.500
Sell Limit @ 61.000
Sell Limit @ 60.500
Sell Limit @ 60.000
Sell Limit @ 59.500
(You may extend more layers if you like)
You don’t need to hit all layers — just get partial fills, ride the move downward.
🚫 Stop Loss
Thief’s SL: 62.500
⚠️ Note to Thief OG’s: I’m not forcing you to follow my SL. You choose what works. Make money, take money — at your own risk.
🎯 Target
We see police barricade as a strong support zone + oversold trap possibility.
So primary target: 57.000
⚠️ Note to Thief OG’s: Don’t blindly hold to my TP. If price gives you your gains early, escape with your money — don’t wait for perfection.
🔍 Related Pairs & Correlations
AMEX:USO or USOIL (oil ETFs / indices) – real-world crude correlation
$BRENT/USD – watch for strength or weakness divergence
AMEX:XOP / AMEX:OIH (oil & gas sector indices) – sentiment in energy names
Key point: if Brent weakens while WTI breaks down, it reinforces the bias.
📌 Key Technical Notes
We’re waiting for ** redistribution / supply zone** to hold — a retest or failure bounce is ideal setup.
Oversold conditions + a “trap” candle (fake breakout) strengthen the move.
Use layering to average in, not “all-in” at once.
Be ready for whipsaws around support zones; partial exits can help.
✨ “If you find value in my analysis, a 👍 and 🚀 boost is much appreciated — it helps me share more setups with the community!”
Disclaimer: This is Thief-style trading strategy just for fun. I am not giving financial advice. Trade at your own decision and risk.
#WTI #CrudeOil #XTIUSD #EnergyTrading #OilStrategy #Layering #SwingTrade #DayTrade #BearishBias #ThiefStrategy
BCH/USDT Long Set-up— Compression near a key resistance level, triangle continuation pattern forming, price holding above the MA50/200 crossover
— Entry: $581 Market Buy
— Stop: $545 — 6% price movement from entry to stop (this is price movement, NOT account loss)
— Target: $680
Risk per trade: 1% of total deposit (actual account risk)
Position size: 15% of total deposit, 10x leverage
RR: 1:3


BCH DWEB Node trend chart.Gann fans made with DWEB trends, intersections marked for potential pivots along with important levels if it get bullish. Use the Gann fans (in-place) as trends if it fails here. One step at a time

Bulls Flexing StrengthHey guys, AAVE is setting up one of those textbook bullish continuation patterns that makes you sit up and pay attention.
The current price of $199.14 sits right in the equilibrium zone, perfectly balanced between premium and discount levels. What's immediately striking is the clean higher low formation that's been confirmed, with price holding firmly above all major moving averages. The EMA20 at $197.14, EMA50 at $196.87, and EMA200 at $193.39 are all stacked bullishly beneath current price, creating a support ladder that's characteristic of strong uptrends. This alignment doesn't happen by accident - it's the result of sustained buying pressure and institutional accumulation.
The ADX reading of 53.3 is absolutely critical to understanding the current market state. This indicator measures trend strength, and anything above 25 signals a trending market rather than choppy consolidation. At 53.3, we're looking at a strong, established trend that has momentum behind it. When you pair this with the MACD showing powerful bullish divergence (0.6012 vs 0.0205 signal line), the technical picture becomes crystal clear. The MACD histogram is expanding positively, indicating accelerating bullish momentum rather than a weakening trend.
The RSI at 68.7 is approaching overbought territory but hasn't reached extreme levels yet. This is actually ideal for continuation setups - we want to see strength, not weakness. The RSI has room to push into the 70-80 zone during strong trending moves, so this reading suggests we're in the middle of a move rather than at an exhausted top. The MFI at 66.8 confirms that money flow is supporting this price action, with capital flowing into AAVE rather than exiting.
From a Smart Money Concepts perspective, this setup gets even more interesting. Price is currently trading above a bullish order block that spans $196.09 to $197.71. This zone represents an area where institutions likely accumulated positions during the previous move up, and it's now acting as a demand zone. Order blocks are one of the most reliable SMC concepts because they mark areas where smart money has shown their hand. The fact that we're holding above this level suggests institutional support remains intact.
There's also an unfilled bullish Fair Value Gap sitting at $195.26-$195.54. FVGs represent inefficiencies in price action where the market moved too quickly, leaving behind an imbalance. These gaps act as magnets - if we see any pullback, this $195.26-$195.54 zone would be an ideal area for smart money to add to positions. It's essentially a discount entry point within the broader uptrend.
The bearish order block at $204.48-$199.70 represents the immediate supply zone we need to reclaim. This is where sellers previously showed strength, and reclaiming this zone with volume would be a significant bullish signal. A break above $204.48 with expanding volume would likely trigger stops and fuel a move toward the swing high at $206.80.
The market structure is showing higher lows, which is the definition of an uptrend. The recent swing low at $189.16 held firm, and the even stronger low at $186.85 provides an additional backstop. The Bollinger Bands show price trading above the middle band at $195.32, with the upper band at $202.02 within striking distance. When price walks the upper Bollinger Band in a strong trend, it often signals continuation rather than reversal.
Volume analysis reveals current levels at $19,995 versus an average of $22,867. While this is slightly below average, it's not concerning given we're in a consolidation phase. What we want to see is volume expansion as price approaches the $204.48 resistance zone. A breakout on declining volume would be suspect, but a breakout with volume above $25,000+ would confirm institutional participation. The 24h volume of $161 million shows healthy overall interest in AAVE.
The wick analysis is particularly revealing. The lower wick represents 24.9% of the candle range, while the upper wick is only 11%. This asymmetry tells a story - buyers are aggressively defending lower prices (creating large lower wicks), while sellers aren't showing the same aggression at higher prices (small upper wicks). This imbalance in supply and demand dynamics typically precedes upside moves.
For a complete trading setup, here's how I'd approach this: Entry zone is $197-199, with aggressive traders potentially entering at current levels given the strong technical backdrop. More conservative traders might wait for a pullback to the $195.26-$195.54 bullish FVG for a better risk-reward entry. The stop loss should be placed below $188.00 - a 4H close beneath the discount zone at $188.09 would invalidate the bullish market structure and break the higher low formation. This isn't just a random percentage-based stop; it's a structural level where the thesis breaks.
Target the swing high at $206.80 for TP1, which represents a 3.85% move from current levels. If we get a clean breakout above $206.80 with volume confirmation, look for extension targets at $210 and potentially $215 based on measured moves. The risk-reward on this setup is approximately 1:2.5 from current levels, which is solid for a continuation play. If entering from the FVG around $195, the R:R improves to nearly 1:4.
The confidence level on this setup is 78% - high conviction but not maximum. What keeps this from being a 90%+ setup is the slightly below-average volume and the fact that we're in equilibrium rather than deep discount. The ideal scenario would be a quick wick down to $195 on a volume spike (liquidity grab), followed by immediate reclaim and push through $204.48. That would be the textbook smart money playbook.
Alternative scenarios to consider: if price rejects hard at the $204.48 bearish order block without volume confirmation, we could see a deeper pullback to the $195.26 FVG or even the $189.16 swing low. This wouldn't invalidate the bullish thesis unless we close below $188.00. Consolidation between $197-204 for another 12-24 hours would actually be healthy, allowing the RSI to cool off slightly before the next leg up.
What are you thinking here? Are you waiting for a pullback to the FVG for a better entry, or taking the trade at current levels given the strong momentum?

Lower Prices for $BTC is Bullish!If CRYPTOCAP:BTC takes a dip this week, it could set up a bullish divergence that could really get the year end to Q1 rally started!

The Same liquidity roadmap TVC:GOLD keeps respecting the same liquidity roadmap mapped in previous sessions.
Premium PD arrays rejected again, sellers showed up on cue, and price rotated cleanly back into discount before finding support.
My OG Indicators stayed in sync:
• 🔻 Clean sell-off from the premium Trend / PD zone
• ⚡ FlowMaster flagged exhaustion right at the sweep
• 🎯 ScalpMaster printed early short signals before the drop
• 📉 TrendMaster held as dynamic resistance on 15M and 1H
As long as discount holds, dips are getting bought.
⏳ 1H Short Term View
Market is doing what it does best: rotating between discount demand and premium supply.
• 🟢 Bulls stay in control above 4,250
• 🎯 Upside targets: 4,340 → 4,365
• ❌ Invalidation: loss of the 4,240–4,250 demand band
Any touch into premium without acceptance still invites sell pressure.
📅 1D Mid Term View
Zooming out, the bigger picture stays bullish.
The 4,110-4,020 demand zone continues to absorb sell-side liquidity and keep the macro structure intact.
• 🟢 Bulls remain in control above 4,110
• 🎯 Mid-term targets: 4,380 → 4,420 → 4,460
• ⚠️ Daily acceptance below 4,020 shifts the bias
Momentum cooled short term, but the higher timeframe trend is still alive.

Btc Buy Setup Elliott Wave Analysis not an adviceThis count is based on my assumptions so anything can happen not a trading or financial advice just for educational purposes only kindly do your own ta thanks trade with care good luck.

Review and plan for 15th December 2025Nifty future and banknifty future analysis and intraday plan.
This video is for information/education purpose only. you are 100% responsible for any actions you take by reading/viewing this post.
please consult your financial advisor before taking any action.
----Vinaykumar hiremath, CMT

New Week Analysis Gold (XAUUSD) – New Week Market Structure Outlook
Gold has shown a strong impulsive move into a key supply / resistance zone, followed by rejection. Price is currently reacting around a previous structure area, which makes the new week important for confirmation.
Key Observations:
Price tapped into a higher-timeframe resistance zone and faced rejection
Market is now consolidating near a key decision level
Overall structure suggests corrective movement before the next major direction
Key Levels to Watch:
Resistance: 4300 – 4328
Immediate Support: 4260
Next Supports: 4233 → 4204 → 4198
Expectation for the Week: If price continues to respect the resistance zone, a step-by-step retracement toward lower support levels is possible. However, acceptance above resistance may change the structure, so patience and confirmation are essential.
Trading Approach:
Let price react at key levels
Wait for confirmation on lower timeframes
Risk management remains the priority
⚠️ This analysis is for educational purposes only. Always manage risk according to your plan

GBP/JPY) Bullish trend analysis Read The captionSMC Trading point update
Technical analysis of GBP/JPY 1H – SMC + Technical breakdown based exactly on the chart you shared:
---
Market Structure
Market has shifted bullish after:
A strong impulsive move up
Followed by a corrective pullback
Recent candles show break of the descending correction trendline, confirming:
> Change of Character (CHoCH) → Bullish continuation
---
EMA Confirmation
EMA 50 ≈ 206.66
EMA 200 ≈ 206.17
Price:
Rejected strongly from EMA 200
Now trading above EMA 50
This confirms:
> Trend realignment to the upside
---
Fibonacci Confluence
Your fib is drawn perfectly:
0.62 – 0.79 retracement zone aligns with:
EMA 200
Structural demand
Trendline support
→ This forms a high-probability institutional buy zone.
---
SMC Logic
Sequence visible:
1. Bullish impulse
2. Deep pullback into discount (0.62–0.79)
3. Liquidity sweep below the low
4. Strong bullish displacement
5. Break of corrective structure
This is a classic SMC bullish continuation model.
---
Key Levels
Strong Demand: 206.00 – 206.30
Mid Support: 206.60
Breakout Level: 207.00
Major Target / Liquidity: 208.19 (your marked target)
---
Trade Idea (From Your Chart)
Buy Setup
Entry Zone: 206.60 – 206.90
Stop Loss: Below demand → 205.85
Target 1: 207.40
Final Target: 208.20
Risk : Reward: 1:3+
---
Projected Price Path
Minor pullback → Higher low → Strong impulsive rally
Final expansion into:
Previous high
Liquidity pool at 208.19
Premium zone
---
Invalidation Criteria
This bullish setup is invalid if:
H1 candle closes below 205.85
Or price re-enters and holds below EMA 200
Mr SMC Trading point
---
Final Verdict
Trend: Bullish continuation
Structure: Break of bearish correction
Entry: Fib discount + EMA 200 + Demand
Target: 208.19 liquidity
Bias: BUY on pullbacks
---
Please support boost 🚀 this analysis

BTCUSD – Range-Bound Distribution | Liquidity-Driven Enviro🔍 Market Structure:-
HTF Range High / Sell-Side Resting Above:
94,500 – 95,200
HTF Range Low / Buy-Side Resting Below:
84,500 – 85,000
Mid-Range (Equilibrium):
~89,500 – 90,000 (current price area)
Price is currently hovering around equilibrium, which is typically low-probability for directional bias.
⚠️ Risk Disclaimer (TradingView-Friendly)
This analysis is for educational purposes only and does not constitute financial advice.
Market behavior is probabilistic and subject to change at any time.
Always apply proper risk management and use your own confirmation before executing trades.


BTC BearishBTC looks like its been consolidating on a rising wedge on declining volume. This would indicate we are about to breakdown again down to the 80k level but possibly farther to 74k. If we tap 74k, I'll be looking for a big bounce and a midterm trend change

Bitcoin Myth Busting.Bitcoin Myth Busting.
The days of the greatest GAINS in the SHORTEST amount of time are NOT AHEAD of us.
They are BEHIND us.
Don't let ANY Maxi promise you otherwise.
