XAUUSD Reversal Zone Targets 4250📊 Gold (XAUUSD) Analysis
Gold has bounced strongly from the lower support zone and is now reclaiming structure after breaking out of the previous consolidation block. Price is currently stabilizing around 4195–4200, showing exhaustion from the earlier sell-off.
The key level to watch is 4220, which acts as the bullish flip zone:
✔ Above 4220 → Buyers gain control
✔ Clean path toward 4250
✔ Breakout retest structure matches your projection
Once 4220 is secured as support, momentum is likely to push toward the 4250 resistance, which aligns with the chart’s mapped target zone.
---
🎯 Bullish Outlook
First confirmation: Break & close above 4220
Main target: 4250
X-indicator

ETH Is Quietly Loading Up for Its Next Major Rally1. Current Market Structure (1H)
ETH continues to maintain a clean short-term uptrend with:
- Higher lows forming consistently → buyers remain in control.
- Price holding above EMA 34 → intraday bullish rhythm intact.
- EMA 89 sitting lower, confirming strong medium-term momentum.
- Demand zone 2280–2300 acting as the key intraday support.
- Liquidity resting below 2230–2250, potential draw if a pullback occurs.
Price action shows compression → energy buildup → preparing for the next expansion leg.
2. Macro Alignment
Macro conditions continue to support a bullish bias:
-DXY weakening → risk assets get a tailwind.
-US Treasury yields cooling → reduces pressure on crypto.
-Market pricing in earlier Fed cuts for 2025 → liquidity shifts toward risk-on assets.
-BTC and ETH correlation stays elevated → BTC strength fuels ETH upside.
Macro flow + technical structure both point to continuation of the upward cycle.
3️⃣ Current Structure (Right Range)
You marked SUPPORT ZONE & RESISTANCE ZONE.
ETH is repeating the same playbook:
- Long wick rejection into Support
- Price oscillates inside the range (liquidity creation)
- A breakout is likely to follow once enough orders are collected.
This is the third accumulation cycle — textbook bullish continuation.
🎯 TRADING SIGNAL
BUY SETUP
Entry Zone:
3310 – 3350 (Support Zone dips / liquidity sweeps)
Stop Loss:
Below support box: 3250
Take Profit:
Partial at 3450–3500
Full target at 3600+ (expected breakout continuation)
Why this works:
ETH has shown the exact pattern twice:
Range → Liquidity Sweep → Expansion.
Current price is building the third range — probability favors another upward expansion.
📈 SUMMARY:
ETH is not random it is systematically accumulating before each major pump.
As long as price holds the Support Zone and continues ranging, the bullish continuation scenario remains the highest-probability play.
Next Move:
– Bullish bias remains intact as long as ETH continues to hold above the channel’s support; reclaiming 3,440 would open momentum toward 3,520 and potentially the upper boundary. – ETH/USD (1H)

S&P500 Key Trading Levels
Key Support and Resistance Levels
Resistance Level 1: 6898
Resistance Level 2: 6922
Resistance Level 3: 6958
Support Level 1: 6809
Support Level 2: 6790
Support Level 3: 6768
This communication is for informational purposes only and should not be viewed as any form of recommendation as to a particular course of action or as investment advice. It is not intended as an offer or solicitation for the purchase or sale of any financial instrument or as an official confirmation of any transaction. Opinions, estimates and assumptions expressed herein are made as of the date of this communication and are subject to change without notice. This communication has been prepared based upon information, including market prices, data and other information, believed to be reliable; however, Trade Nation does not warrant its completeness or accuracy. All market prices and market data contained in or attached to this communication are indicative and subject to change without notice.

XRP Technical Outlook: Channel Break Could Signal New Highs !!The price is currently moving within a bullish channel and may reach the upper boundary of this channel. If the channel is broken to the upside, we can expect a new all-time high (ATH) for Ripple.

Can Gold Sustain Momentum Above 4250 for the Next Leg Up?🔥 XAU/USD BREAKOUT ALERT! 🚀
Gold vs. U.S. Dollar – Metals Market Opportunity (Day/Swing Trade)
Blueprint for the bullish breakout setup with pending order strategy!
🟡 Asset:
XAU/USD – “GOLD vs U.S. DOLLAR”
Metals Market Opportunity Blueprint (Day / Swing Trade)
🔶 TRADE PLAN – Bullish Breakout Pending Order ✨
Gold is building momentum and preparing for a key breakout structure.
The bullish continuation plan remains valid only after price breaks and holds above 4250, confirming fresh demand flow.
📌 Entry:
You can enter at any price level after the confirmed breakout @ 4250,
or use stack-layering entries based on your preferred “Thief layering technique”.
🔻 STOP LOSS (Risk Advisory Inside)
SL Zone: Around 4170 (Thief SL)
📝 Note:
Dear Ladies & Gentlemen (Thief OG’s) — adjust your SL according to your own strategy and risk comfort.
This is not a mandatory level; you can protect your capital in your own style.
🎯 TARGET – Resistances, Police Barricade Zone & Profit Escape Route
Market structure shows a strong resistance cluster + potential trap area ahead.
📌 Primary Target: 4340
This zone aligns with:
Strong police barricade resistance
Overbought pressure zones
Liquidity trap pockets where price may reverse
📝 Note:
Dear Ladies & Gentlemen (Thief OG’s), you are NOT required to use my TP.
Make your money and take it at your own pace and your own risk.
🌍 RELATED PAIRS TO WATCH (Correlated & Inversely Correlated Markets)
Monitoring correlated markets helps confirm breakout strength, money flow, and sentiment.
🟦 1. TVC:DXY (U.S. Dollar Index)
Inverse correlation with XAU/USD.
If DXY weakens, GOLD often surges faster.
If DXY strengthens, GOLD upside may slow down.
🟩 2. SP:SPX / PEPPERSTONE:NAS100 (US Indices)
Risk sentiment gauge.
If indices drop → flight-to-safety boosts GOLD.
If indices rally strongly → GOLD may stall or pull back.
🟪 3. TVC:SILVER / XAGUSD
Commodity correlation.
Silver breakout usually supports GOLD momentum confirmation.
Watch for synchronized metal market buying.
🟥 4. TVC:US10Y (10-Year Treasury Yield)
Bond yields affect GOLD heavily.
Falling yields → lower opportunity cost → GOLD bullish.
Rising yields → limited GOLD upside.
🟧 5. TOCOM:DBAIE / OIL
Macro inflation correlation.
Rising oil = inflation risk = GOLD safe-haven bids.
Sharp oil drops = deflation fear = GOLD might contract.
🧭 KEY POINT SUMMARY
Breakout confirmation only after 4250
SL flexibility encouraged based on trader strategy
Take-profit zone at 4340 aligns with trap & resistance
Cross-asset correlation strengthens directional conviction

Breaking; Agape ATP Corporation (ATPC) Surge 100% Today After tanking almost 100% yesterday, Agape ATP Corporation (NASDAQ; NASDAQ:ATPC ) saw a noteworthy uptick of 102% today in Thursday's premarket trading geating for a move to the $1 resistant.
In recent news, AGAPE ATP Corporation ("ATPC") signed an Irrevocable Corporate Purchase Order ("ICPO") with Swiss One Oil & Gas AG ("Swiss One") and entered into a strategic partnership to enhance oil and gas sales and purchase operations. The ICPO entails the procurement of approximately 200,000 metric tons of EN590 10PPM diesel and 2,000,000 barrels of Jet Fuel A1 for an initial trial phase.
This collaboration brings together ATPC's expertise in sustainable business strategies and global trade with Swiss One's extensive experience in the oil and gas sector, strengthening their position in the energy market, optimizing supply chain efficiency and integrating advanced technologies.
Financial Performance
In 2024, Agape ATP's revenue was $1.32 million, a decrease of -7.57% compared to the previous year's $1.43 million. Losses were -$2.47 million, 17.5% more than in 2023.

XAUUSD, Expecting sell from 4220XAUUSD, I am Expecting sell from 4220 with targets of 4208 & 4187 area.
good luck

DXY may sell off from or above 98.77With rate cut, as expected DXY as created new lower low. The gap resistance at 99.32 has been tested and price finally managed break the trend line with FOMC realse.
Daily price opened with gap, which in currently retesting the swing high and possible rejection at 98.77 or above after a false breakout can lead the market to go futher lower to 97.84 or below.

Gold Pullback or Reversal? Key Zone Decides the Next Move🔹 MARKET BRIEFING – XAU/USD (1H)
Market State:
– Price is pulling back after the recent bullish impulse and is hovering just above the minor support zone, suggesting a potential retracement setup before continuation.
Key Levels:
– Support / Entry Zone: 4204 – 4205
– Stop-Loss Zone: 4193 – 4194
– Take Profit 1: 4229
– Take Profit 2: 4247
Next Move:
– A clean retest of the 4204–4205 support zone may trigger another bullish leg toward 4229 → 4247, as long as price holds above the 4193–4194 rejection area.

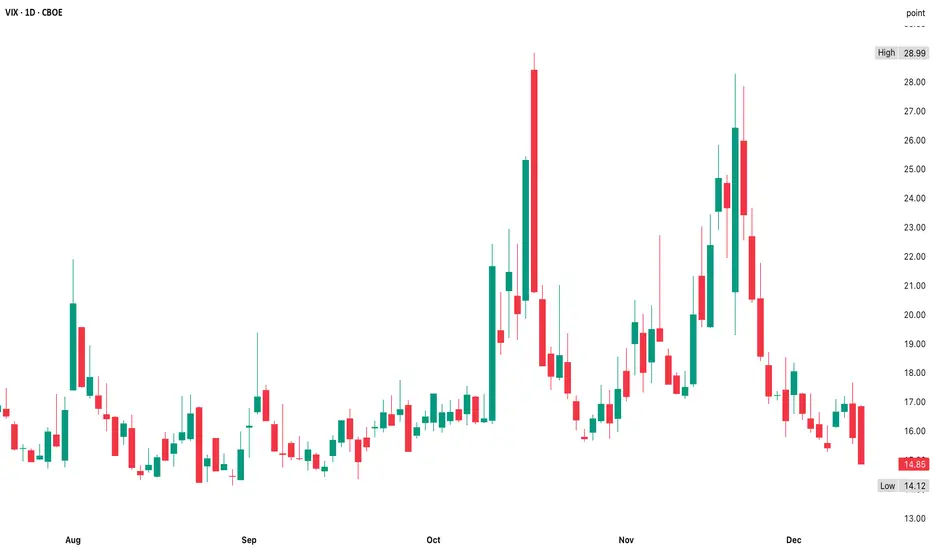
VIX Maybe Too Relaxed?When the VIX is sitting around 15, it usually signals a low-volatility, risk-on environment, but with some nuances that traders often forget
1. Options market is pricing in calm conditions
A VIX of 15 corresponds to ~15% implied volatility for S&P 500 options over the next 30 days
Historically, 15 is below the long-term average (~19–20)
Markets are expecting small daily moves
2. Traders are not hedging aggressively
Demand for downside protection tends to be low
Put/call skew typically flattens when the VIX is low
3. Markets may be vulnerable to shocks
Low VIX ≠ “safe"
It means complacency
Historically, very low VIX often precedes sharp, but short volatility spikes, but it's not a timing tool - it can stay low for months during strong uptrends
4. For directional traders
A VIX around 15 generally lines up with small intraday follow-through on breaks (low expansion), higher chance of grindy price action & harder to get big downside moves unless a catalyst hits, since vol sellers dominate
A VIX ~15 during a macro-calm period normally means the market believes no near-term recession risk, earnings risk contained & the Fed's path relatively stable, but it also means any surprise (Fed tone shift, earnings miss, geopolitical flare) can cause outsized reactions, because positioning is light on hedges
Low-volatility regimes tend to support grinding rallies
Dip-buying often shows up quickly
VIX ~15 says pullbacks are likely to be shallow unless triggered by news
1.5-3% dips, but they are usually fast & bought
10-13 Extreme calm, often complacency
14-17 Mild calm, typical bullish grind
18-22 Normal volatility, healthy corrections
23+ Stress, hedging, risk-off
30+ Panic
When the VIX is this low, QQQ tends to operate in a low-volatility, mean-reversion–biased regime unless a catalyst disrupts it
1. Even though VIX is for the S&P, QQQ’s volatility correlates closely
Typical QQQ daily range in a VIX 15 regime is ~0.9%–1.3%
This makes big impulse moves harder, both up & down
Breakouts can look significant on low timeframes, but fail more often because volatility expansion is muted
This is why you're observing weak follow-through on selloffs
2. Dips bought quickly
In a low-VIX backdrop, institutions run lighter hedges, buy dips mechanically & rebalance toward tech/mega-cap growth (which dominates QQQ)
ITypical pullback depth during VIX 14-16 periods are commonly between 1-2.5%, 3-5% dips require a catalyst (earnings, Fed tone shift) - pure technicals rarely generate that move alone
3. QQQ in low VIX mean uptrends extend slowly, downtrends fail faster unless news hits & breakdowns on the 1H/4H need volume + macro fear to stick
The environment doesn't support large downside legs unless something shocks implied vol
4. Calls inflate less, puts deflate hard
Puts decay brutally
IV is suppressed → premium is thin → directional bets need fast movement
If price doesn’t follow through within 24-48 hours, puts lose value even if you’re still near your entry
Calls don’t explode unless we get vol expansion
Up moves in low VIX are grindy, not impulsive
So calls rarely give outsized returns unless QQQ surges 1-2% in a day
This is why positioning both ways right now feels “sticky” - price isn’t moving enough to reward options
5. QQQ tends to outperform SPX when VIX is below 17
Low VIX = risk-on
Risk-on = mega-cap + tech flows
Mega-cap + tech flows = QQQ leadership
So even in choppy conditions, QQQ often has a drift upward
If you’re looking for a sharp 2-3% drop, you need a catalyst
AVGO earnings, a Fed comment, or some macro surprise
A slow grind toward $630-$640 is what a VIX 15 regime naturally supports
Multiple retests of resistance without fear in the market typically favor eventual breakout, not breakdown, but the grind can be agonizing & fake-breakouts are common intraday
NASDAQ:QQQ AMEX:SPY
LONG ON UJ PART 2Possible push to the upside on UJ
Sell Side Liquidity taken and the high broken right after giving me the impression that big institutions may have forced the SSL in order to enter the market
1;55 rr, may seem far fetched but looks like a good trade to me
Second part of UJ trade i posted with a lightly different point of entry

Trading Setup – Silver (XAGUSD)🔍 Technical Overview:
Silver has completed a classic bull flag formation on the 4H chart, following a strong impulsive move higher (flag pole). Price has now broken out above the channel resistance, confirming continuation.
MACD has just printed a fresh bullish cross, signaling renewed upside momentum.
Price is holding above the key $60.00 breakout level, which now acts as short-term support.
The structure favors a continuation move to the upside as long as price stays above the breakout zone.
Fundamental Momentum:
Silver remains supported by strong industrial demand, especially from the solar and electronics sectors.
Expectations for softer monetary policy ahead continue to support precious metals.
Ongoing geopolitical uncertainty and USD sensitivity keep silver attractive as a hedge, reinforcing bullish sentiment.
Trade Idea – Swing Long Setup
Entry Zone: $60.10 – $60.40
Stop Loss: $57.40 (below the flag structure and invalidation level)
Take Profit Levels:
TP1: $62.37 → First resistance (measured move from flag).
TP2: $64.57 → Next key supply zone.
TP3: $67.50 → Full bullish extension target.
Risk Note:
Silver is fast-moving and volatile. Partial profits are recommended at TP1, with stop moved to breakeven to protect capital. A clean hold above $60 keeps the bullish structure valid.

it is a time for BULL - 80% potential profit - 18.30 USDThe chart shows a clear attempt to reverse a prolonged downward trend, which previously pushed the price toward a strong support zone. In this area, a visible phase of accumulation has formed, suggesting that buyers are gradually taking control. The price has begun to build a sequence of higher lows and has broken above the nearby moving averages, which technically confirms the first signs of a potential trend reversal. At the same time, the RSI indicator has rebounded sharply from oversold levels and moved quickly into higher ranges, reflecting strengthening bullish momentum.
The current structure of the chart suggests that the market is attempting to establish a new upward trend. The rebuilding momentum supports the possibility of further price appreciation. Historical price action also confirms this potential: after breaking out of the current consolidation zone, the next significant resistance level aligns with a projected upward move of approximately 83% from current price levels. This target fits both the technical chart formation and the market logic following an extended period of sell-off.
In summary, the chart currently presents several technical factors favoring a bullish continuation: improving momentum, a breakout above moving averages, strong RSI recovery, and an accumulation pattern developing at a key support zone. If buyers maintain control and the price stays above the newly reclaimed support level, the scenario pointing toward an 83% upward move remains a technically reasonable possibility.
Potential TP: 18.30 USD
⚠️ Disclaimer
This analysis is not financial advice, not an investment recommendation, and should not be used as the sole basis for trading decisions. It is an educational interpretation of chart patterns and market structure. Always conduct your own research and consider consulting a licensed financial advisor before making investment decisions.

GBPCAD sideways consolidation support at 1.8430The GBPCAD remains in a bullish trend, with recent price action showing signs of a breakout within the broader uptrend.
Support Zone: 1.8430 – a key level from previous consolidation. Price is currently testing or approaching this level.
A bullish rebound from 1.8430 would confirm ongoing upside momentum, with potential targets at:
1.8580 – initial resistance
1.8665 – psychological and structural level
1.8750 – extended resistance on the longer-term chart
Bearish Scenario:
A confirmed break and daily close below 1.8430 would weaken the bullish outlook and suggest deeper downside risk toward:
1.8380 – minor support
1.8326 – stronger support and potential demand zone
Outlook:
Bullish bias remains intact while the GBPCAD holds above 1.8430. A sustained break below this level could shift momentum to the downside in the short term.
This communication is for informational purposes only and should not be viewed as any form of recommendation as to a particular course of action or as investment advice. It is not intended as an offer or solicitation for the purchase or sale of any financial instrument or as an official confirmation of any transaction. Opinions, estimates and assumptions expressed herein are made as of the date of this communication and are subject to change without notice. This communication has been prepared based upon information, including market prices, data and other information, believed to be reliable; however, Trade Nation does not warrant its completeness or accuracy. All market prices and market data contained in or attached to this communication are indicative and subject to change without notice.

BTC OutlookHere we go.
Yesterday the Fed has cut for another 25 bps and Powell has given us a not so great outlook into interest rates for the next two years, forecasting only another two cuts of 50 bps total, expecting us to be near 3.1% in 2028.
As fellow BTC Traders that is something we don't like to hear. We want 50 bps in ONE, but it makes sense considering Powell wants to keep aiming for 2% Inflation while also supporting the labor market.
Anyways folks, while this isn't ideal we can expect the Fed to be turned upside down once Powell isn't chair anymore and Trump sweeps through there.
Besides interest rates in the US, we are at an interesting point in time as we have the Russell hit a new ATH, which indicates Risk-On, while we have the BoJ Meeting next week with them most likely hiking rates.
I'd be careful in the current macro regime as you have one side of the market scream AI Bubble, Yen Carry Unwind while the others are continuing to push for new upside as interest rates drop and DXY will start cooling.
For BTC this means uncertainty and mixed signals. We want and need a market that's risk-on, but a lack or even the pulling of liquidity through the yen carry unwind would sweep us off our feet.
In terms of Liquidity the Fed has also announced their $40B. T-Bill purchase program.
For BTC where we are headed to is all I can say, everyone and their grandma are screaming for higher prices right now. I could imagine this being the bottom, but if we do lose $76k I see us back in the range of $63k very quick.

Is NZD/USD Ready for a Bullish Drive? WMA Breakout Validated🎯 EUR/USD "THE FIBRE" BREAKOUT SETUP | Multi-Layer Entry Strategy 📊
📈 MARKET ANALYSIS | EUR/USD SWING/DAY TRADE
Asset: EUR/USD (The Fibre)
Bias: BULLISH ✅
Setup: Triangular Moving Average Breakout + Retest Confirmed
Strategy Type: Swing/Day Trade | Multi-Layer Entry (Thief Method)
🎯 TRADE PLAN BREAKDOWN
Entry Strategy: "THIEF LAYERING METHOD" 💰
This strategy uses multiple limit orders to scale into position:
📍 Multi-Layer Buy Limit Entries:
Layer 1: 1.16400
Layer 2: 1.16600
Layer 3: 1.16800
Note: You can add more layers based on your capital allocation and risk tolerance
🛑 Stop Loss:
Thief SL: 1.16200
⚠️ Adjust based on YOUR strategy and risk management plan
🎯 Take Profit Target:
Primary TP: 1.17600 (Strong resistance + potential overbought zone)
💡 Exit Strategy: Watch for trap patterns near resistance—secure profits wisely!
⚡ KEY TECHNICAL LEVELS
Entry Zone: 1.16400-1.16800 (Multi-layer accumulation)
Stop Loss: 1.16200 (Risk management level)
Target: 1.17600 (Resistance + overbought zone)
🔗 RELATED PAIRS TO WATCH (USD CORRELATION)
Monitor these pairs for confirmation and correlation analysis:
Direct USD Pairs:
GBP/USD (Cable) 📉 - Positive correlation with EUR/USD approximately 70-80%. When Cable moves higher, it typically confirms USD weakness across the board and supports EUR/USD bullish momentum.
USD/JPY 📊 - Inverse correlation, acts as a USD strength indicator. If USD/JPY drops below 150.00, it signals USD selling pressure which benefits EUR/USD longs.
USD/CHF 🇨🇭 - Inverse correlation, serves as a risk-off sentiment gauge. When USD/CHF falls, it indicates USD weakness and supports EUR/USD upside.
EUR Cross Pairs:
EUR/GBP 🇪🇺🇬🇧 - Measures EUR strength versus GBP. Rising EUR/GBP shows Euro outperformance and confirms EUR/USD bullish bias.
EUR/JPY 📈 - Risk appetite indicator. When EUR/JPY climbs, it signals risk-on sentiment which typically supports EUR/USD gains.
EUR/CHF - Euro zone stability measure. Stable or rising EUR/CHF indicates confidence in the Eurozone economy.
💡 Correlation Key Points:
USD Index (DXY) - Watch for weakness below 106.00 for EUR/USD bullish continuation. A breaking DXY confirms broad USD selling.
GBP/USD alignment - If Cable breaks higher simultaneously, this confirms USD weakness is widespread, not just EUR strength.
USD/JPY divergence - A drop below 150.00 signals significant USD selling pressure across all pairs.
Risk Sentiment - EUR/JPY rising equals risk-on environment which generally supports EUR/USD bullish moves.
⚠️ RISK DISCLAIMER
Dear Traders (OG Thief Gang),
This is NOT financial advice—educational analysis only
ADJUST YOUR SL/TP based on YOUR risk tolerance
Money management is YOUR responsibility
Take profits at YOUR comfort zone
Never risk more than you can afford to lose
Markets can be unpredictable—trade smart! 🧠
📊 WHY THIS SETUP WORKS
✅ Triangular MA breakout confirmed
✅ Retest of breakout level completed
✅ Multi-layer entry reduces timing risk
✅ Clear risk/reward ratio defined
✅ Correlation analysis supports directional bias
📌 Remember: The market rewards patience and discipline. Trade your plan, not your emotions! 🎯💪

USDJPY analysis In this analysis, I highlight the previous descending channel that controlled USDJPY for an extended period. After multiple reactions at the channel boundaries, price eventually broke above the upper trendline, signaling a potential shift in market structure.
Following the breakout, USDJPY formed a bullish leg and is now undergoing a corrective move. The demand zones marked on the chart represent areas where buyers may attempt to regain control. These zones include several stacked short-term demand levels, along with a broader and stronger demand region lower on the chart.
The primary scenario in this setup is based on how price reacts once it reaches these zones. A strong bullish response could support continuation of the post-breakout trend, while a weak reaction may open the door for a deeper correction into the next demand region.
This analysis focuses purely on market structure and price behavior. It does not represent financial advice.

Gold Analysis: Volatility Ahead in NY Session (Dec 11, 2025)FXOPEN:XAUUSD GOLD ANALYSIS VOLATILITY AHEAD IN NY SESSION (December 11, 2025)
Welcome back to Trade with DECRYPTERS
*Market Overview*
Gold rallied to $4,232/oz after the Fed’s third straight 25bp cut weakened the dollar and eased yields, giving bullion classic upside fuel. Silver outperformed with a 1.9% jump to a new all-time high amid a historic squeeze, while gold’s gains were limited by the Fed’s hawkish 2026 dot plot. Powell’s announcement of $40B/month Treasury bill buys acted as stealth QE, lifting both risk assets and safe haven flows. China’s continued gold accumulation and elevated geopolitical risks added further support. Overall, gold holds a bullish bias toward $4,300 as long as DXY stays below 98.5.
*Key Fundamentals*
Spot Gold: $4,215/oz, up 57% YTD, with 50+ ATHs showing strong momentum.
Central Banks: 254t bought YTD, on track for 1,000t/year a powerful structural floor.
ETF Flows: $64B inflows (record AUM $530B; holdings 3,932t), signaling surging investment demand.
Inflation: CPI ~3% with Nov expected 2.7–2.99%; real yields near 2%, supportive for gold.
Dollar & Yields: DXY at 98.59 (soft), 10Y at 4.13% (low real yields) both bullish tailwinds for gold.
*Geopolitics*
1. China Warns Against US Tariffs
Rising US China trade tensions pushed gold up and pressured tech/Asian markets.
2. US Tech Export Curbs on China
New US restrictions on semiconductors/software lifted gold and hurt tech stocks, especially chipmakers.
3. Israel Iran Tensions Increase
War rhetoric boosted safe-haven buying (gold, oil) and weakened global equities.
4. US China Trade Truce Talks Fail
Talk breakdown revived trade-war fears, increasing gold ETF inflows and pressuring EM currencies.
5. Houthi Attacks in Red Sea
Shipping disruptions lifted oil and gold, increasing market volatility and hurting shipping stocks.
Emerging Flashpoints
South Korea, Syria, and European debt worries added fresh volatility, pushing the GPR index higher and reinforcing upside risks for gold and other safe-haven assets.
*Risk-On/Risk-Off Analysis*
1. Yields Stabilized After Fed Cut but Stay Elevated
Treasury yields eased slightly after the Fed’s 25bp cut (10-yr at 4.13%), but real yields remain high (~2.05%), signaling persistent inflation pressure and fewer expected cuts in 2026.
2. Market Sentiment = Mild Tactical Risk-Off
Yen carry unwinds, tariff fears, and the Fed’s cautious outlook have shifted markets into a 55/45 risk-off tilt, supporting gold and Treasuries, even as U.S. equities remain resilient with low VIX.
3. Cross-Asset Signals Flash Mixed Outlook
Stocks rise on strong earnings and AI demand, but rising yields (-0.85 correlation), a soft USD (-0.75 correlation with gold), and global policy shifts (BoJ hikes) create a fragile setup where risk-on/bullish momentum depends heavily on next week’s CPI.
*Key Insights From Credible Sources*
Trump Comments on Markets & Growth
Trump expressed extremely bullish views, suggesting GDP could reach 20–25% and that markets should continue rising adding short-term optimism to equities and risk assets.
Powell Comment on Housing
Powell said a 0.25% rate cut won’t significantly improve housing affordability, signaling limited impact of small cuts on the housing market and keeping pressure on real estate linked assets.
*Key Events To Watch*
🔸 US Unemployment Claims (TODAY — HIGH IMPACT)
Higher claims → Weak labor → Dovish → Bullish gold
Lower claims → Strong labor → Hawkish → Bearish gold
Expect immediate spike reactions toward your zones.
*Conclusion*
Gold remains supported by strong macro foundations Fed easing, a softer dollar, and record central-bank demand keeping the broader trend firmly bullish above $4,200. Geopolitical tensions and rising risk-off flows continue to fuel safe-haven demand, while ETF inflows reinforce a structural floor. Although yields remain elevated and sentiment is cautiously mixed, the path toward $4,300 stays intact as long as DXY holds below 98.5. With high-impact labor data ahead, expect sharp intraday volatility, but the overall bias remains upward.
Support the Analysis
If this breakdown added value to your trading:
👍 Drop a like
💬 Comment your levels
📈 Share your charts with the community
Let’s grow together.
Best Regards,
M. MOIZ KHATTAK | Founder — TRADE WITH DECRYPTERS

EURUSD: pre-Fed breakout🛠 Technical Analysis: On the 4-hour timeframe, EURUSD has confirmed a "Global bullish signal" (SMA 50 crossing above SMA 200), following a breakout from a steeper descending channel. The pair has found solid footing at the immediate support zone around 1.1640 and is projected to rally towards the overhead resistance at 1.17386. The technical structure suggests a continuation of the upward momentum, driven by the moving average crossover and stabilizing price action above key levels.
———————————————
❗️ Trade Parameters (BUY)
———————————————
➡️ Entry Point: Buy approx. at 1.1640 – 1.1660
🎯 Take Profit: 1.17386 – 1.1750 (Resistance)
🔴 Stop Loss: Below the local consolidation structure (approx. 1.1610)
⚠️ Disclaimer: This is a potential trade idea based on current analysis; market conditions and price direction are subject to change based on news factors and volatility.

EURUSD continues its Bullish TrendEURUSD continues to follow a strong bullish trend with no clear signs of reversal. The market is consistently forming higher highs (HHs) and higher lows (HLs), indicating steady buyer control. As long as this structure remains intact, the safest approach is to ride with the trend

GEN: The Inverse Head & Shoulders SetupGEN: The Inverse Head & Shoulders Setup
Hi team,
Hope you're having a great trading week.
I've traded a great reversal pattern forming on Gen Digital Inc. (GEN) that I had to share immediately.
The setup is clean , the risk is definable, and the potential move is significant.
We are looking at a beautiful Inverse Head and Shoulders pattern on the Daily timeframe.
This is one of the most reliable chart patterns signaling the end of a downtrend and the start of a new bullish cycle.
Here is my rationale of why this chart deserves your attention:
1. The Violent "V-Shape" Head :
Aggressive Institutional Buying! 💥
Forget the slow, rounded bottoms. The "Head" of this pattern is a violent, sharp V-shape reversal.
What this means: It shows that the sellers were completely overwhelmed by aggressive, likely institutional, buying interest at those lows.
It wasn't a consensus reversal, it was a powerful defense of the price.
Pro TIP: Zoom out to the Monthly chart, and this V-shape translates into a massive bull Hammer Candlestick. This adds significant weight to the low as a major Buy Zone.
2. The Activation Point:
The structure is complete , and we are currently flying.
This is exactly where you want to see a breakout !
The Trigger: The Neckline, the key resistance level that connects the tops of the pattern, is sitting firmly at $27.50.
The Signal : A clean, strong break and a decisive daily close above $27.50 to confirm this Inverse Head and Shoulders is active.
This will likely trigger stop losses from trapped shorts and ignite the momentum.
3. The Execution Plan & Risk Management
The beauty of the Inverse Head and Shoulders is that it provides a mathematical target and a fantastic spot to manage risk. I'll sell around $29 to follow my strategy, even though the price could fly higher due to this great pattern.
🎯 Why This Pattern Makes Money
This whole setup is a classic Bear Trap.
The violent dip sucked in a lot of short sellers, and now the pattern's recovery is squeezing them.
When $27.50 breaks, those shorts are forced to buy back, adding fuel to the rally.
Remember: 80% of trading success isn't finding the pattern, it's executing the exit strategy properly.
👇 WANT MORE?
🚀 Hit the rocket and follow to see me again :)

Robots taking off?I like the 5 wave impulse up and ABC correction into the golden pocket. Great risk reward setup especially if the Santa rally kicks in.

XAUUSD How to become successful in forex and stock trading: 1.Master fundamentals and technical analysis. 2,Build and follow a solid trading plan. 3.Apply strict risk management (1–2% rule). 4.Stay disciplined—control fear and greed. 5.Record and analyze every trade. 6.Focus on high-quality setups only. 7.Diversify across assets and markets. 8.Keep evolving—study, adapt, and grow daily.
