NFP Bears gathering their troops? or will the Bulls stampede...The past 9 days have been quite interesting for the EUR/USD which has been relentless. Price has been rising like a helium balloon let loose at the park...
Bulls have clearly been in control, not only the past 9 days but since the beginning of the year with the exception of the strong pullback in April & May only to bounce for another 700 pip run.
I am totally USD bearish across the board as I have been mentioning in my analysis videos for the past few months but like all macro moves, we always have pullbacks along the way and that is why I have been shorting the EUR/USD back from 1.1500+ - 1.1700+
I've given this a lot of room to breathe, more than usual but considering the following technical setup, I'm willing to give the Bears some leeway and potentially show me they'll come through.
•Rising Broadening pattern (Where two trendlines start close together only to divergence and expand) - This is a bearish pattern.
•Negative Divergence on the MACD, Linear Regression & the RSI.
•Price has made a run to the yearly R3 pivot level. (Rare extension)
•Last daily candle is a hanging man candlestick (Reversal candle)
•Weekly chart has the EUR/USD at the upper band of a polynomial regression channel which calculates for price extremities in the market.
There are a few more setups as well but it's too much to describe here and I'd have to show it in a video (Which I plan to do over the weekend)
With all of that said... It could all fail lol but seriously speaking... You just can't ask for a better probabilistic setup so whatever happens during NFP... happens.
Aside from the technical aspect... I know yearly R2 around 1.1600 was a hotspot for shorts because divergence was at the early stages and taking a short there wouldn't have been a bad idea but we know institutions are in play as well, so above 1.1600 could have been a huge area to run stop losses and margin calls before a potential reversal.
250 pips would be enough to run a large pool of stops and liquidation.
IF price is going to reverse here during NFP, I believe late longs and breakout/pullback traders are going to try and buy at the trendline at 1.1660ish but it wont hold and trap them on the other side of the trade.
Under that, I can see us pulling back towards 1.1200ish...
If the Bears give up and price continues to climb... the original macro target may very well be under way which was 1.2000 - 1.2200 (Based on a Monthly and 3-Month chart analysis)
As of this writing the EUR/USD is pretty much completely flat which is expected before the NFP fireworks ahead of July 4th.
We'll see what happens tomorrow morning! buckle up!
As always, Good luck and Trade Safe! See you post NFP.
X-indicator

Si1! - A "Short" Silver Heads-UpWhat we see on these two charts are two different Andrews Pitchforks.
- same time window
- different time period
- different pitchfork placement
The left chart maps the pendulum swings.
The right chart maps the real swings.
LEFT CHART
The market has almost reached the maximum stretch point, arriving at the U-MLH. A reversal toward the centerline is very likely, as the market tends to seek balance after such an extreme stretch. Classic mean reversion.
RIGHT CHART
Here we see that silver has reached the centerline - the classic 80% target for a pitchfork trader. From here, the market can break/zoom through the centerline, retest it, and continue upward. In the LEFT chart, this would correspond to a larger stretch toward Warning Line 1. Or the market may turn at the centerline because it has found its balance, which in the LEFT chart would confirm the stretch-and-turn scenario.
Either way, caution is warranted. I would at least take partial profits (50% is always good) and treat myself to an enjoyable Christmas party!
Anyone who would like to learn more about pitchforks, please read my bio here on TradingView.
Happy profits to you Silver Arrows §8-)

Strong bounce by cable continues for nowCable moved further up on 11 December to highs of around six weeks as the dollar generally weakened. Possible political instability in Britain is out of focus now and a cut by the BoE on 18 December seems to be fully priced in with around 85% probability. Inflationary pressure in Britain remains overall high, though, so the BoE might be significantly less dovish in 2026 while most participants are expecting two cuts by the Fed next year.
Although cable’s bounce from November’s lows has been vigorous overall this phase might be approaching exhaustion. The slow stochastic has signalled oversold for nearly a fortnight and buying volume has dropped since 28 November. $1.35 would be the next clear possible target while the 23.6% weekly Fibonacci retracement around $1.337 is a technical reference.
Most of the round numbers are possible supports with different likely strengths. Another push all the way down to $1.30 seems very unlikely in the near future unless data and sentiment shift significantly. As for euro-dollar, the double NFP on 16 December and American inflation two days later are centrally important releases which might make upcoming movements clearer.
For the latest analysis and opinions, visit the link on my profile to follow me on X too.
This is my personal opinion, not the opinion of Exness. This is not a recommendation to trade.

Buy EUR/NZD at strong support.The EUR/NZD has been on a downtrend for a few weeks now and is closing in on strong support. There is also a leading diagonal pattern being formed which meet at around the same level. Stocks at all time highs and AUD, NZD close to strong resistance seems like a perfect time for USD strength. Might not be a change of trend but a nice correction so just need a catalyst now.
Buy Limit : 2.0039 strong support
Stop : 1.9942 under strong support
Profit : 2.0330 before minor high
Risk 1 : 3 / stop is 97 pips.

Ethereum 1H: Holds Its Bullish Channel 🔹 MARKET BRIEFINGMarket State:
– Price is pulling back from the channel’s upper resistance and is now stabilizing around mid-range, while still respecting the ascending channel structure.
Key Levels:
– Support: 3,160
– Resistance: 3,440
– Breakout Zone: 3,440 – 3,520
Next Move:
– Bullish bias remains intact as long as ETH continues to hold above the channel’s support; reclaiming 3,440 would open momentum toward 3,520 and potentially the upper boundary.
The bullish structure on XAUUSD has now been fully established and this is a valid buy signal at the current price.
Momentum, structure, and demand alignment are all pointing in the same direction, confirming that buyers are in control and the market is ready for the next upward leg.
Why ETH Dropped After the Fed Rate Cut
1. Macro Overview – Why ETH Pulled Back Even After the Fed Cut
Despite the Fed cutting interest rates a move typically supportive for risk assets ETH corrected sharply due to short-term “sell the news” positioning, profit-taking from the recent rally, and liquidity reshuffling as markets reassessed the pace of future cuts. However, the broader macro environment still favors long-term bullish continuation: lower borrowing costs, easing financial conditions, and improving risk appetite all support capital rotation back into crypto once volatility cools. In other words, yesterday’s drop was a tactical shakeout, not a structural trend reversal, and the market is now forming a sideways accumulation phase consistent with a bullish continuation setup.
2. Market State
ETH is pulling back from the ascending channel’s upper resistance and is now stabilizing around the mid-range. The price is still respecting the channel structure, indicating that buyers are absorbing supply and forming a consolidation base rather than breaking trend. This aligns with a sideways phase before the next expansion leg upward.
3. Key Levels
Support: 3,160
Resistance: 3,440
Breakout Zone: 3,440 – 3,520
4. Next Move
The bullish bias remains intact as long as ETH trades above the channel’s support. Reclaiming 3,440 would signal renewed buyer strength and open a clean path toward 3,520, with potential continuation into the channel’s upper boundary. Until then, ETH is likely to move sideways within the range as the market digests the macro shift and prepares for the next bullish leg.


DAX40 resistance at 24300The DAX remains in a bullish trend, with recent price action showing signs of a breakout within the broader uptrend.
Support Zone: 23870 – a key level from previous consolidation. Price is currently testing or approaching this level.
A bullish rebound from 23870 would confirm ongoing upside momentum, with potential targets at:
24300 – initial resistance
24450 – psychological and structural level
24560 – extended resistance on the longer-term chart
Bearish Scenario:
A confirmed break and daily close below 23870 would weaken the bullish outlook and suggest deeper downside risk toward:
23712 – minor support
23600 – stronger support and potential demand zone
Outlook:
Bullish bias remains intact while the DAX holds above 23870. A sustained break below this level could shift momentum to the downside in the short term.
This communication is for informational purposes only and should not be viewed as any form of recommendation as to a particular course of action or as investment advice. It is not intended as an offer or solicitation for the purchase or sale of any financial instrument or as an official confirmation of any transaction. Opinions, estimates and assumptions expressed herein are made as of the date of this communication and are subject to change without notice. This communication has been prepared based upon information, including market prices, data and other information, believed to be reliable; however, Trade Nation does not warrant its completeness or accuracy. All market prices and market data contained in or attached to this communication are indicative and subject to change without notice.

The Day Ahead - US trade balance, initial jobless claimsThursday brings a full slate of data releases, with attention on the US trade balance, wholesale sales, and initial jobless claims, which will help gauge the strength of US demand and labour conditions. The UK’s RICS house price balance, Italy’s Q3 unemployment rate, Canada’s merchandise trade, and Australia’s labour force survey round out a busy global data calendar.
On the central bank front, the Swiss National Bank delivers its policy decision, and BoE Governor Bailey is scheduled to speak.
Corporate focus includes earnings from Broadcom, Costco, and Lululemon, while the US Treasury will auction a 30-year bond (reopening).
This communication is for informational purposes only and should not be viewed as any form of recommendation as to a particular course of action or as investment advice. It is not intended as an offer or solicitation for the purchase or sale of any financial instrument or as an official confirmation of any transaction. Opinions, estimates and assumptions expressed herein are made as of the date of this communication and are subject to change without notice. This communication has been prepared based upon information, including market prices, data and other information, believed to be reliable; however, Trade Nation does not warrant its completeness or accuracy. All market prices and market data contained in or attached to this communication are indicative and subject to change without notice.

Is #KSM Ready to Recover or will Bears Drag it Further Down? Yello Paradisers! Is #KSM setting up for a nasty flush toward new lows, or are we about to witness a fakeout trap before a bigger move? Here's what the # Kusama chart is showing us:
💎#KSMUSDT is currently trading within a clearly defined symmetrical triangle, with the price consistently being rejected from the descending resistance trendline. This structure has broken down, and as of now, the 50EMA is acting as dynamic resistance, reinforcing the bearish bias.
💎The current price of #KSMUSD is $7.75, sitting right below the strong resistance around the $9.32 zone, where the descending trendline aligns with heavy volume on the visible range. As long as price trades below this $9.32 invalidation level, the bearish setup remains valid. A rejection from this level, combined with a 50EMA retest, would further confirm downside continuation.
💎Next key level to watch is the moderate support zone at $6.65, a potential short-term bounce area. However, the real demand lies lower, with major support at $4.95, where we could see aggressive buyers stepping in. This zone also coincides with the previous swing low and would likely trigger liquidation of late long entries, making it a potential reversal zone if the market reaches there.
💎To flip the structure bullish, #KSM needs to break and hold above $9.32. That would invalidate the descending channel and could spark a rapid move toward the next volume cluster above $10.50. Until then, every retest of resistance remains a potential short opportunity for experienced traders.
Trade smart, Paradisers. This setup will reward only the disciplined.
MyCryptoParadise
iFeel the success🌴

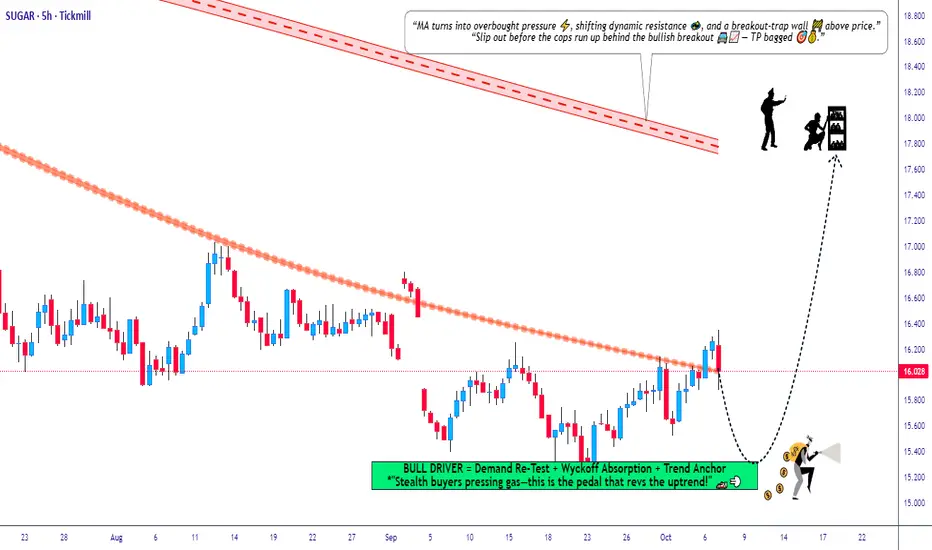
Sugar Market Upside Potential – Smart Entry, SL & TP GuideSUGAR: HULL MA Breakout Confirms BULLISH SWING! 🚀🍭 + Key Pairs Analysis
🔥 Asset: “SUGAR” – Soft Commodities Market Trade Opportunity Guide (Swing / Day Trade)
📈 Market Bias: Bullish continuation confirmed after a HULL Moving Average Breakout
🎯 Trading Style: Suitable for both Swing & Day Traders
🚀 Plan Overview
The bullish structure remains strong as price has completed a clean breakout above the Hull Moving Average, signaling renewed upward momentum. Buyers continue to hold control, and momentum strength supports potential continuation toward higher resistance zones.
🎯 Entry Plan
💠 Entry: Traders can position at any suitable price level after confirming bullish structure continuation.
✔ Use your own filtering tools such as:
– Structure Retests
– Trendline Bounces
– Pullback Zones
– Volume Confirmation
🛡 Stop Loss (Risk Management)
🔻 Suggested SL Zone: 15.200
Dear Ladies & Gentlemen (Thief OG’s), kindly adjust your stop loss based on your personal strategy and risk tolerance. This value is NOT a mandatory SL—trade safely and manage your own risk model.
🎯 Target Zone
🎯 Primary Target: 17.600
This target aligns with:
• Moving Average Resistance Zone
• Overbought Price Conditions
• Potential Bull Trap Formation Near Upper Bands
Dear Ladies & Gentlemen (Thief OG’s), take profits according to your own strategy. You are in full control—make profits, secure profits at your comfort and risk.
🔍 Correlated Pairs & Related Markets to Watch
Monitoring correlated markets helps validate momentum, sentiment, and macro commodity flow.
🔸 1. Sugar Futures (SB1!) — USD Contract
• Direct benchmark for sugar price movements.
• Strong correlation with supply shocks, weather conditions & global trade flows.
🔸 2. Crude Oil (WTI / Brent)
• Indirect correlation through biofuel production.
• When crude rises, demand for ethanol (produced from sugarcane) increases → bullish for Sugar.
• Watch for energy market volatility.
🔸 3. US Dollar Index (DXY)
• Commodities priced in USD react inversely.
• Weak USD = bullish commodities, including sugar.
• If DXY pulls back, sugar tends to strengthen.
🔸 4. Corn Futures (ZC)
• Sugar competes with corn in the biofuel market.
• If corn prices rise, sugar becomes more attractive → increases demand for sugarcane-derived products.
🔸 5. Coffee & Cocoa (Soft Commodities Basket)
• Often experience similar supply chain disruptions.
• Weather cycles impact the entire soft-commodity group together.
• Strength in these markets sometimes signals broader soft commodity momentum.
🧭 Key Takeaways
• Hull MA Breakout confirms bullish control
• Structure remains supportive for higher continuation
• Risk management is personal—trade responsibly
• Soft commodities often move in clusters; keep correlated markets on your radar
• Watch for overbought traps near target zone
SOFI 1D double checking the bill before the next moveSOFI is trading at 27.09 and may retrace toward 25.00, which is a strong demand area combining the 0.786 retracement level, a major VWAP node and a visible volume cluster. Since September 25 the price has been moving inside a broadening channel, signalling liquidity expansion. The 25.00 level remains a balance zone with proven buyers. The pullback from 32.73 looks like a structural retest.
Fundamentally SOFI stays strong as of December 11 2025. The company reports more than 8.2 million members and around 2.5 billion USD in annual revenue. The lending segment generates over 1.3 billion USD, and the banking division adds about 0.85 billion USD. Operating cash flow is positive. Recent news includes an expanded partnership with Mastercard, a new corporate credit platform and full Technisys integration.
As long as the price holds above 25.00, the bullish structure remains valid. A rebound from demand opens the path toward 29.20, 34.51 and 41.48. VWAP and volume behavior confirm buyer interest.
Fintech never avoids a plot twist. SOFI seems to be preparing one more dip before the next act.

SP500 Price consolidating in a bullish structureSP500 is currently consolidating in a bullish structure after successfully holding key support. This stabilization suggests that price may be preparing for another move to the upside.
Technically Wall Street’s main index is expected to remain relatively steady ahead of the closely watched Federal Reserve decision. The Fed is widely expected to deliver a rate cut, although uncertainty remains regarding the extent and pace of potential rate reductions going into 2026.
During the announcement, price may experience temporary volatility—especially upward spikes driven by liquidity grabs. However, the sustained direction will depend entirely on Powell’s tone and forward guidance.
If the market maintains its bullish structure following the Fed release, we could see the SP500 extend higher toward new highs in the 6,924.50 – 7,000.35 zone.
You may find more details in the chart,
Trade wisely best of luck buddies.
Ps; Support with like and comments for better analysis thanks for supporting.

SOL-USDTI had an update on support, and the valid Ethereum support is still $130 📊💱
As long as this level isn't broken, it can prevent further correction 🚀
If it stays above this support, it might again move back toward $135 📈
The next Solana support is $123 📣✔️

Gold before breakout its in range watch levels📊 Gold (XAU/USD) – 30M Timeframe Outlook
📌 Key Range: 4202 – 4218
🔼 Bullish Scenario:
If price breaks above 4218, upside targets are:
✨ 4230
✨ 4237
✨ 4248
🔽 Bearish Scenario:
If price breaks below 4202, downside supports are:
🛑 4193
🛑 4178
🛑 4170
💡 Note: Always use proper risk management and wait for confirmation before entering any trade.
👍 Like | 💬 Comment | 🔁 Share


USOil Long RollerMain idea is based on RSI on 75m TF peaking (technically) {Green Arrow} and trend levels are marked (observationally) for trade executables.
$57.25 is average entry, to be rolled on expiry.
Thank you.
Any comments are welcome :)

GBPUSD LONG From the H4 and H1 time frame, I can see from the structure that it's bullish. On the h1 we have an impulsive move up followed by the pull back to my fib levels (50 and 61.8). Entry signal was the h1 bullish pin bar

Euro-dollar pushes above $1.17Euro-dollar’s recent gains continued in the aftermath of the Fed’s cut on 10 December as senior members of the ECB commented on further cuts being likely unnecessary and focus on political problems in the EU, primarily France, declined. The ECB will probably raise forecasts for growth next year while attention remains on the USA’s seemingly weakening labour market.
With only 11 December clearly above $1.17, it’s too early to call that day’s movement a decisive breakout, but since buying volume is at least not lower and the price is above all of the moving averages it’d be possible to see more gains to come, just maybe not immediately. Both the slow stochastic and Bollinger Bands signal overbought. 16 September’s closing high around $1.187 is an obvious medium-term target.
The main candidate for a static area of support is the 23.6% weekly Fibonacci retracement around $1.149, but before that all four moving averages, 20, 50, 100 and 200, are likely to be dynamic supports. The double NFP on 16 December could drive more significant movement.
For the latest analysis and opinions, visit the link on my profile to follow me on X too.
This is my personal opinion, not the opinion of Exness. This is not a recommendation to trade.

Failed BOS + HH-HL at the lows signals the start of a bullish trPrice has been trending inside a well-defined descending channel, maintaining a clean sequence of lower highs and lower lows. However, the character of the trend shifted at the channel low. Instead of continuing downward, price created a Higher High → Higher Low sequence, signalling the first sign of bullish strength building at the extreme.
The next key confirmation was the failed bearish BOS.
Sellers attempted to break structure again but couldn’t follow through — a classic sign of seller exhaustion and a potential shift in market orderflow.
Once the channel broke and the failed BOS aligned with the internal HH–HL shift, the bearish narrative was invalidated.
This formed the basis for my long entry.
Now, with structure transitioning into a bullish phase, my expectation is for price to reach for the next major Buy-Side Liquidity, located above the previous swing highs. Until that liquidity is taken, my bias remains bullish.
➡️ Summary:
Descending channel breakdown
Failed downside BOS
HH–HL at the channel low
Clear shift in orderflow
Targeting Buy-Side Liquidity above

Bitcoin at the Key Point Many are already burying Bitcoin and believe that it has been in a bear trend for almost all of 2025. But if you look at the situation technically and without emotion: the structure level at $74,450 has not been broken, and the price has not even come close to it yet.
The diagonal support level was tested and a bounce followed. And this is the main thing to watch right now. Because if the two-year diagonal support level (the purple arrow) is broken down again and the price fails to move back above it, this will be the first major signal of the start of a bear market.
✅ This drop as a whole was predictable and has closed a large number of gaps below after the wild rally in the summer. One last big gap remains, and I find it hard to believe the price will go down to close it now, because it — surprise — ends at $74,450.
During the decline two more gaps were also formed at $97,030–$103,265 and $112,296–$121,541. And this means these levels strongly attract the price.
✅ At the same time, selling volumes since November 21 are forming a divergence, which may mean that we have already passed the peak of buying pressure. But buying volumes also still remain at the lows, which means there are still few people willing to buy the dip.
✅ The Supply and Demand indicator shows that demand at the current levels is still low, while supply is high. But a large demand zone has formed at $69,000 and below. I certainly hope we won’t see such prices, although if so many large orders are placed exactly there, maybe they know something?
🌐 In many ways, there is fear dominating the crypto market right now, after it proved its inability to function when, during the crash in October, market makers pulled their orders and many even top altcoins almost went to zero.
And now companies that have been buying crypto on their balance sheets are being threatened with exclusion from all indices, and they are rushing to sell off their holdings.
➡️ Right now the crypto market is not about charts, but about macro factors. And the main macro factor is Strategy. If they are excluded from the index, Saylor will have to sell and reduce the balance to get back into the indices, and then we will see a real crash 2.0.
That’s how it goes in the crypto industry: when Bitcoin’s price is rising, Saylor is a genius on magazine covers; when it’s falling, Strategy gets excluded from all indices.
So don’t fall for talks about technology and the future — that’s what the rich feed you with while they are already closing their positions.
But nevertheless, I believe that we are still at the beginning of a new season, and at least the start of 2026 will be green for the markets 🔥

Bitcoin Price Analysis Uptrend Continuation SetupThis chart highlights a potential uptrend continuation pattern forming on the 4-hour BTCUSD time frame. Price is moving within a rising channel showing steady bullish momentum. After bouncing from the lower trend line Bitcoin is aiming toward two key resistance zones:
1st Target 92475 – A break and close above this level could confirm bullish strength.
2nd Target 96160 – The next major resistance area aligned with the upper channel boundary.
The Ichimoku Cloud is turning supportive, suggesting improving trend conditions. As long as price holds above the channel support, the bullish structure remains valid.
A clean and simple setup for traders watching BTC next move upward.

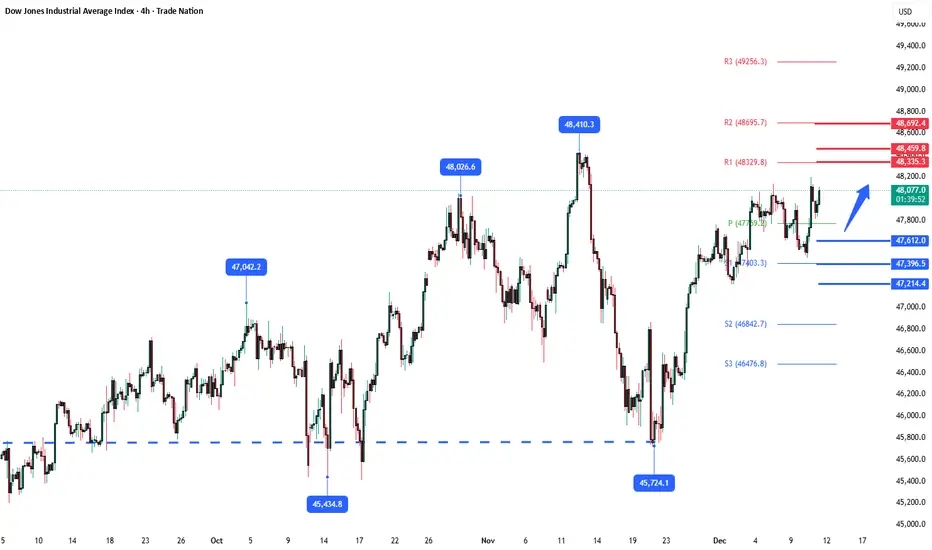
DpwJones Key Trading LevelsKey Support and Resistance Levels
Resistance Level 1: 48335
Resistance Level 2: 48460
Resistance Level 3: 48690
Support Level 1: 47610
Support Level 2: 47390
Support Level 3: 47210
This communication is for informational purposes only and should not be viewed as any form of recommendation as to a particular course of action or as investment advice. It is not intended as an offer or solicitation for the purchase or sale of any financial instrument or as an official confirmation of any transaction. Opinions, estimates and assumptions expressed herein are made as of the date of this communication and are subject to change without notice. This communication has been prepared based upon information, including market prices, data and other information, believed to be reliable; however, Trade Nation does not warrant its completeness or accuracy. All market prices and market data contained in or attached to this communication are indicative and subject to change without notice.
GBPCHF corrective pullback support at 1.0600The GBPCHF remains in a bullish trend, with recent price action showing signs of a corrective pullback within the broader uptrend.
Support Zone: 9490 – a key level from previous consolidation. Price is currently testing or approaching this level.
A bullish rebound from 1.0600 would confirm ongoing upside momentum, with potential targets at:
1.0708 – initial resistance
1.0736 – psychological and structural level
1.0776 – extended resistance on the longer-term chart
Bearish Scenario:
A confirmed break and daily close below 1.0600 would weaken the bullish outlook and suggest deeper downside risk toward:
1.0584 – minor support
1.0555 – stronger support and potential demand zone
Outlook:
Bullish bias remains intact while the GBPCHF holds above 1.0600. A sustained break below this level could shift momentum to the downside in the short term.
This communication is for informational purposes only and should not be viewed as any form of recommendation as to a particular course of action or as investment advice. It is not intended as an offer or solicitation for the purchase or sale of any financial instrument or as an official confirmation of any transaction. Opinions, estimates and assumptions expressed herein are made as of the date of this communication and are subject to change without notice. This communication has been prepared based upon information, including market prices, data and other information, believed to be reliable; however, Trade Nation does not warrant its completeness or accuracy. All market prices and market data contained in or attached to this communication are indicative and subject to change without notice.
