ETHUSD a great chance to grab ETH that cheapRecent BTC drop caused Alt markets crash especially this situation negatively affected ETH. ETH is under pressure of bad fundamentals and is being dumped due to that fact.
Nevertheless the technology is outdated and can not solve the scalability problem there is still no operating platform which can be trusted as ETH.
It'll take time for EOS venture platform to become popular so ETH still has time. We recommend to buy ETH that cheap and sell at the rebound. It is a quick and reliable trading opportunity.
Signal is already in the Premium channel
Xabcd

Another Gartley Pattern on BTCUSDLONGSI've been going on for months about BTCUSDLONGS vs. BTCUSDSHORTS, so I decided to see what I can find in those charts now that I have some knowledge of harmonic patterns. I just wanted to find even more confirmation of the bull trend I've anticipating and believe has officially picked back up as of about 24 hours ago.

USD CAD BULLISH HARMONIC PATTERNFX:USDCAD
looking at a bullish break out of the harmonic pattern shown in yellow.
TP is at green box at price 1. 31250 for 166 pips total

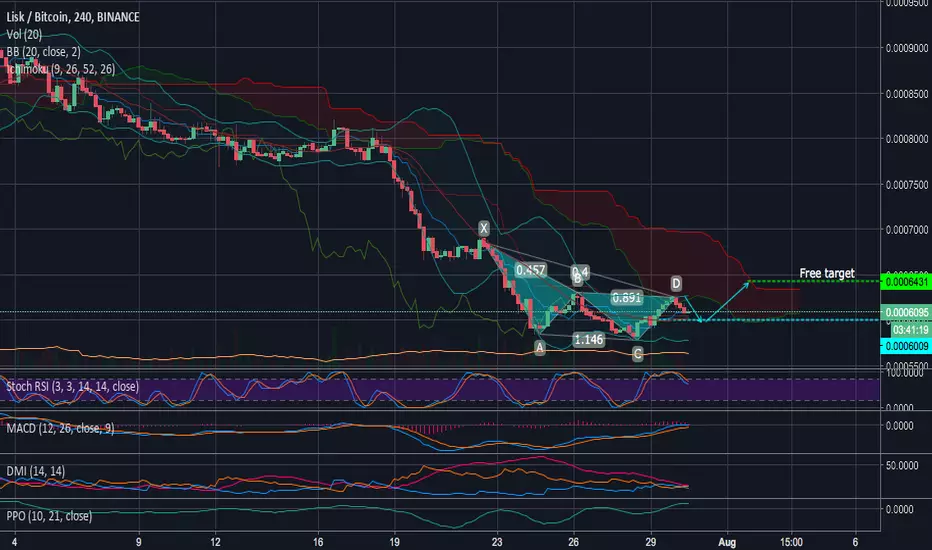
LSKBTC a bit more consolidation before new growth waveAfter an impulse breakthrough in the beginning of the year, Lisk started a downtrend forming a corrective pullback. At the moment the price has fallen to the safe buy zone where the last time a growth wave was started.
The price should decrease a bit due to bearish XABCD formation at the chart. however up from the level drawn at the chart there should be a rebound.
The market forms a descending wedge, breaking through the upper edge of it will give an opportunity for further growth.
If the resistance of 0.00062 will be too strong then the price will go lower till the next support level where it should consolidate and bounce back. in case of this scenario you should buy more in parts around 0.00058.
The final stop loss is located around 0.00055 in case of such negative scenario stay tuned to our updates where we will present the best moment to reenter till the breakeven point.
Overall, the coin looks stable according to DMI and full of strength to start a growth wave
LINKBTC a Perfect butterflyLINK demonstrates bullish mood at various timeframes: indicators are bullish and the trend is positive.
The strongest bullish sign is spotted at 4-hour timeframe where bullish XABCD has been formed. The price should grow till the Ichimoku cloud zone where it will consolidate for a next growth wave. We expect a decrease after our first target to the point near with the buy zone as it usually happens when such XABCD is completed.
Nevertheless the consolidation may took time there should be a significant bounce afterwards. We recommend this coin for medium trade perspective

ONTUSDTThe price is going to penetrate Ichimoku cloud and break through the upper edge of it. Bullish indicators confirm it: Stoch RSI is oversold, DMI shows a strong uptrend mood, MA and EMA are in buy state.
There is formed bullish hidden divergence which enhances our forecast, the Gartley butterfly that is show at the chart should be formed up from this point there will be a small consolidation. Stay tuned to updates to know the best moment of closing this position.
Signal was posted in the Premium channel 1 hour ago.


EUR/USD 4HR AB=CD SETUP AFTER GARTLEY COMPLETIONPreviously, we've seen a Gartley pattern complete and reach the target level (61.8% retracement) of the CD leg. In the chart provided, i have drawn out the AB=CD harmonic tool to help with the projection of this pattern. We've had no candles close below the 61.8% fib, so that's a good sign for me and is why i now have a long bias. C leg of the AB=CD harmonic pattern has been reached and now we are seeing bullish price action play out and now we aim for the D leg (-27% retracement) where relative price points 1.18525 and 1.18628 are.

A Possible sell on GBP/USD.From looking at the chart and plotting a "Bearish" XABCD pattern, its highlighted that there could be an opportunity for a possible sell. This could see us drop down to around the 1.324 zone.

EURCAD - D1 - xabc pattern I can see that price has been bearish from the top at about 1.615€ ...
Now that price seems to have pulled back at 50% around 1.556€ at the beginning of last week.
Price actually ended up last Friday with a nice tail around 1.532€ at a nice support /resistance
Which tells me that price may be ready to go further down forming a nice XABCD pattern.
price has been ranging today (another slow monday) ... and we've got some big new this week
pattern + bearish trend + fibo level .

QLCBTC Breakout confirmedThe coin was in descending channel, however there was a breakout which has been confirmed today when XABCD Gartley formation appeared. Indicators start to become bullish again, probably the best moment to grab this coin cheap. Accurately follow instructions in the signal.
If the price goes to the stop loss around 0.0000135 then wait till rebound which should happen and sell around buying zone or a bit higher, then you should buy the coin again around 0.0000100

NANOBTC a good chance to grab this coin that cheapNANO has finished its retracement, currently there should be a small consolidation according to Stoch RSI and XABCD from the point where Ichi coulds reverse. The price should go to our suggested buying zone where a support will be formed due to creation of double bottom and the growth to our targets will start.

AUDNZD - Possible Cypher and GartleyI will follow this possible situation on AUDNZD very closely on the next days.
Long Traders - You have an Head and Shoulders pattern
Short Traders - Possible bearish Cypher and Gartley Pattern


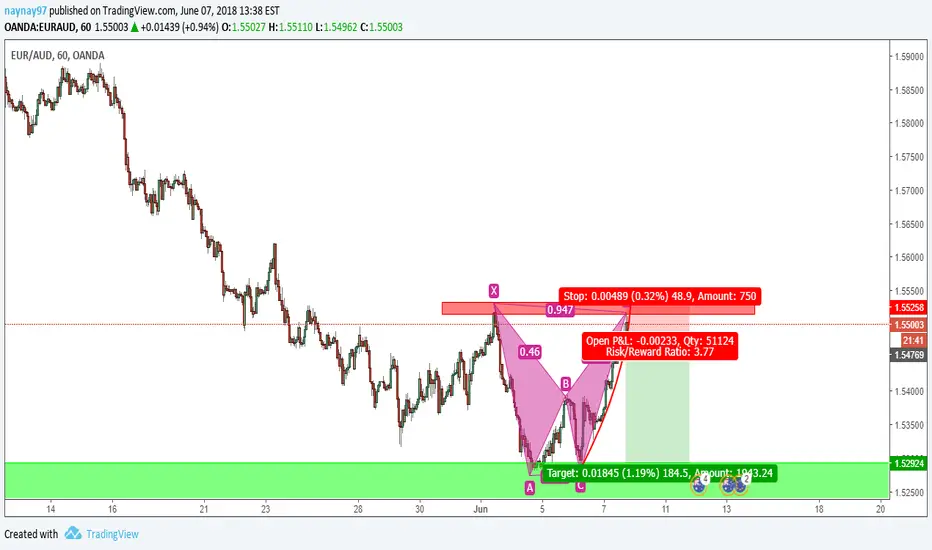
euraud xabcd pattern + minor resistance zone.the market has hit a minor resistance zone which can been seen clearer on the daily chart and it has created a xabcd pattern as well which indicates that the market will go short.
XABCD, Maybe Bat Pattern Waiting for price to touch 0.7500 area, D completion at 88.6. Looking for longs around this area.

Cypher on AUD/NZDAUD/NZD
RSI OVERBOUGHT
RSI Divergence
Between 50% and 61,8% Fib Resistance
Cypher Pattern

Butterfly on AUD/CADAUD/CAD
Bearish Butterfly on AUD/CAD
Everything indicates that the price will fall soon.
RSI OVERBOUGHT
RSI Divergence
50% Fib Resistance
Touching on the upper trend line
Butterfly Pattern


XABCDWaiting for price to go higher into 0.8776 area. Waiting for D completion and short.
Stop above 0.8790
TP 1 at 0.8760 area.
TP 2 at 0.8748 area.

XABCD Waiting for price to go back into 1.7332 or deeper. Looking for longs and D completion in this area.
Stop below 1.7300
TP 1 at 1.7370
TP 2 at 1.7390

Found a bullish "bat" pattern in bitcoinOn a quick mission to find another bullish indicator for the crypto market, I went looking for more patterns that I haven't learned yet, and almost immediately found that we may have just completed a near-perfect bat pattern, which also might conveniently qualify as a triple bottom. At the very least, it falls on a significant trend line as well(bright green) and of course very close to the psychological $7k level. Let's hope this is finally it...

Bearish Cypher and Gartley on NZD/USDOANDA:NZDUSD
Bearish Cypher and Gartley on NZD/USD 0.23% . Price testing 61,8 fib.
Cypher on Blue and Gartley on Green
