SILVER Free Signal From ATH! Sell!
Hello,Traders!
SILVER hovers just below its all-time high at 50$, showing clear signs of exhaustion as Smart Money distributes near premium pricing. A short-term correction is likely as liquidity above is swept and price seeks rebalancing. Time Frame 3H.
-------------------
Stop Loss: 50.06$
Take Profit: 47.74$
Entry: 48.87$
Time Frame: 3H
-------------------
Sell!
Comment and subscribe to help us grow!
Check out other forecasts below too!
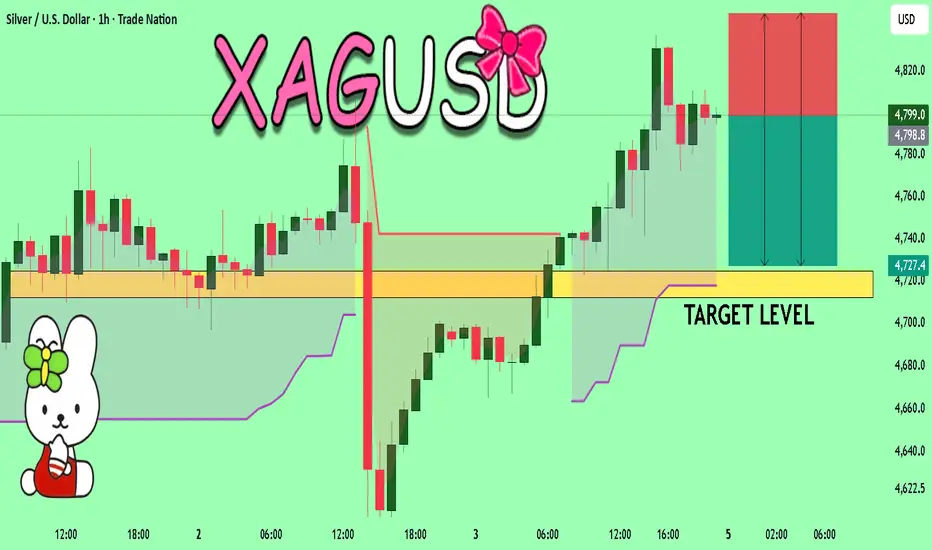
Disclosure: I am part of Trade Nation's Influencer program and receive a monthly fee for using their TradingView charts in my analysis.
XAG USD (Silver / US Dollar)

SILVER (XAGUSD) – 15M | Strong Support Holding, Bullish ContinuTVC:SILVER
Market Overview
Silver took a quick rejection from the 48.70 resistance zone and corrected downward into the major support.
Price is now consolidating around 47.50, a key level that previously sparked bullish impulses.
If this level holds, momentum may shift again toward the upper range — signaling a potential bullish continuation phase.
Key Scenarios
✅ Bullish Case 🚀 →
🎯 Target 1: 47.80
🎯 Target 2: 48.23
🎯 Target 3: 48.70 (resistance retest)
❌ Bearish Case 📉 →
Invalidation if price closes below 47.30 (support breakdown).
Current Levels to Watch
Resistance 🔴: 48.23 / 48.70
Support 🟢: 47.40 / 47.50
⚠️ Disclaimer: This analysis is for educational purposes only. Not financial advice.

Gold ATH – Uncle Jimmy, Silver Momentum & The Market Signal🏆📈 Gold ATH – Uncle Jimmy, Silver Momentum & The Market Signal 🧠🪙
Welcome to Episode 2 of “When Gold Believers Flip.”
Gold has officially broken to all-time highs , and Uncle Jimmy’s quiet rotation into silver suddenly looks like genius…
🟡 GOLD (XAUUSD)
Gold just printed a fresh all-time high at $4,068 🔥
Technically, I still hold a long-term target at $4,489, but the market is overextended.
📉 Game plan:
I’ll only consider shorting below $3,983.
🎯 Short setup:
• Entry: Below $3,983
• Stop-loss: $4,015
Until that trigger hits, bulls remain in control — but risk is rising.
⚪ SILVER (XAGUSD)
Now here’s where it gets juicy.
Remember Uncle Jimmy — the 30-year gold maxi?
This summer, he shocked everyone:
“I’m selling gold to buy silver.” 💬🪙
Guess what? He might’ve nailed it.
Silver is now trading at $48.97, just shy of historical resistance:
🏆 $49.83 (Jan 18, 1980)
✴️ $49.51 (Apr 25, 2011)
🎯 Target: $50.03
But this move is more than a breakout — it’s a sentiment shift.
🧠 The Macro Signal
Yesterday:
🟡 Gold ↑, Silver ↓ = Defensive positioning → not great for markets.
Today:
⚪ Silver ↑, Gold ↓ = Risk appetite returning → bullish tone across assets.
That’s a tailwind for:
• Nasdaq
• Bitcoin
• Broad markets
Silver is part money, part industrial metal — when it leads, optimism rises.
🔁 The Rotation Is Real
📉 Gold looks tired (recent action says not; but my analysis says it is)
🪙 Silver is shining
₿ Bitcoin is waiting
📊 Nasdaq is leading
When hard-money believers like Uncle Jimmy flip...
Pay attention.
Watch the metals.
Watch the sentiment.
This is how macro mood shifts begin.
Mindset Check 🧘
When veterans change conviction, it’s rarely random. Markets evolve — the smartest adapt. Don’t cling to narratives; flow with signals.
One Love,
The FXPROFESSOR 💙
Disclaimer: These charts and analyses reflect my personal opinion only. I am not a financial advisor. Nothing here is financial advice. Trading involves risk, and you are fully responsible for your own decisions. Trade wisely.

Stop!Loss|Market View: SILVER🙌 Stop!Loss team welcomes you❗️
In this post, we're going to talk about the near-term outlook for SILVER ☝️
Potential trade setup:
🔔Entry level: 52.13310
💰TP: 47.21585
⛔️SL: 54.64486
"Market View" - a brief analysis of trading instruments, covering the most important aspects of the FOREX market.
👇 In the comments 👇 you can type the trading instrument you'd like to analyze, and we'll talk about it in our next posts.
💬 Description: Metals are likely to form new highs in the short term. Silver is expected to approach 50-51, with a reversal expected near this historical resistance level, but most likely not immediately. Manipulation toward 52-53 is not ruled out. The mid- and long-term priorities are currently in favor of selling. For this, a potential aggressive sell scenario is anticipated to occur near the 52-level. However, it is best to wait for a potential entry point near this price point.
Thanks for your support 🚀
Profits for all ✅
❗️ Updates on this idea can be found below 👇

Stop!Loss|Market View: GOLD🙌 Stop!Loss team welcomes you❗️
In this post, we're going to talk about the near-term outlook for GOLD ☝️
Potential trade setup:
🔔Entry level: 3955.780
💰TP: 3868.617
⛔️SL: 4015.272
"Market View" - a brief analysis of trading instruments, covering the most important aspects of the FOREX market.
👇In the comments👇 you can type the trading instrument you'd like to analyze, and we'll talk about it in our next posts.
💬 Description: Gold manipulation continues and will likely continue until the end of the US shutdown, or a potential peace settlement in the Middle East could reverse the current manipulative behavior in the metal too. Today, it is exceedingly challenging to identify potential entry points. However, in the near future, the 3955 area is interesting for potential sell trades, as it is the location of buyers' stop levels. If this occurs, it will result in a decline toward 3867. This situation would indicate a highly likely reversal of the local uptrend, which would stimulate selling in the mid-term.
Thanks for your support 🚀
Profits for all ✅
❗️ Updates on this idea can be found below 👇

Stop!Loss|Market View: NZDUSD🙌 Stop!Loss team welcomes you❗️
In this post, we're going to talk about the near-term outlook for the NZDUSD currency pair☝️
Potential trade setup:
🔔Entry level: 0.58228
💰TP: 0.57555
⛔️SL: 0.58856
"Market View" - a brief analysis of trading instruments, covering the most important aspects of the FOREX market.
👇 In the comments 👇 you can type the trading instrument you'd like to analyze, and we'll talk about it in our next posts.
💬 Description: In the medium term, the Australian and New Zealand currencies are viewed as especially pessimistic. Historically, these two major currencies have demonstrated a more effective decline, meaning a more effective strengthening of the USD. Short-term sell opportunities are near the 0.58485 area, but sell from current prices toward the local minimum of 0.57550 is also possible.
Thanks for your support 🚀
Profits for all ✅
❗️ Updates on this idea can be found below 👇

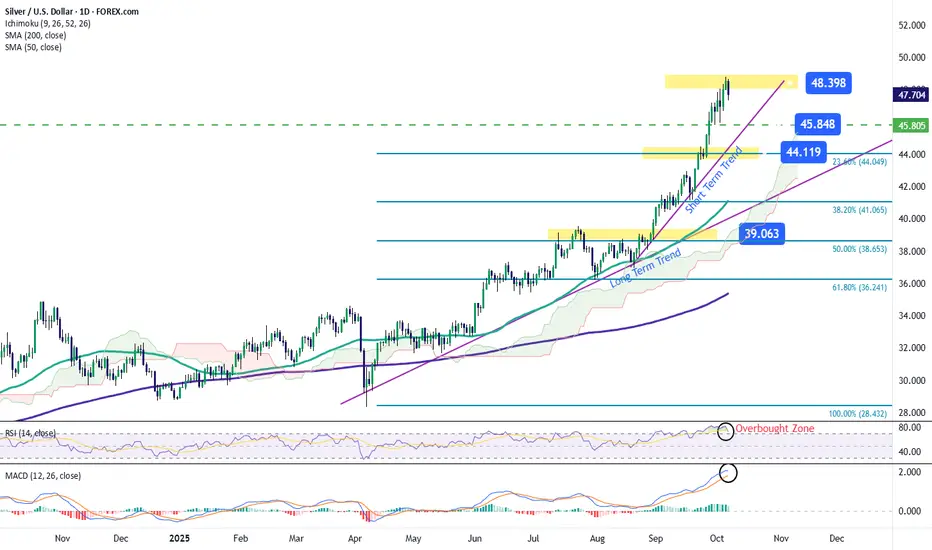
Silver Pulls Back from Recent HighsDuring the current session, silver has started to retreat from its recent highs, posting a decline of more than 2.4% in the short term. This movement has led to a renewed bearish bias in price action, driven mainly by the strengthening of the U.S. dollar. The DXY Index, which measures the dollar’s performance against other major currencies, remains above the 98-point level, reflecting a renewed firmness of the greenback. This strength has reduced investor appetite for precious metals, limiting silver’s upward momentum. If the dollar continues to strengthen, selling pressure on silver could intensify in the coming sessions.
Short-Term Uptrend Remains Intact
Since late August, silver has maintained a pronounced upward trend that remains dominant in the short term. Although some bearish corrections have been observed, they have not yet signaled a structural change in the trend. Therefore, as long as no clear selling signals emerge, the bullish structure continues to be the key pattern to watch at this stage.
RSI
The RSI line continues to hover near the overbought level (70), reflecting an imbalance caused by the recent surge in buying momentum. This could lead to price exhaustion and short-term downward corrections if the overbought condition persists.
MACD
The MACD histogram remains above the zero line, confirming a dominant bullish momentum in recent sessions. However, the MACD and signal lines are beginning to converge, which could foreshadow a bearish crossover and indicate exhaustion in the upward impulse. If this crossover occurs, the market could enter a period of indecision, leaving room for more pronounced pullbacks in the short term.
Key Levels to Watch:
$48 per ounce – Resistance: Corresponds to the recent peak reached by silver. A sustained move above this level could trigger a stronger bullish trend and reinforce a dominant buying bias.
$45 per ounce – Intermediate Resistance: Represents a technical barrier that could limit upside momentum and serve as a potential pivot zone for short-term corrections.
$44 per ounce – Key Support: Aligns with the 23.6% Fibonacci retracement level, acting as the most relevant short-term support. A break below this level could threaten the current bullish trend and shift the outlook toward a more pronounced bearish bias.
Written by Julian Pineda, CFA – Market Analyst
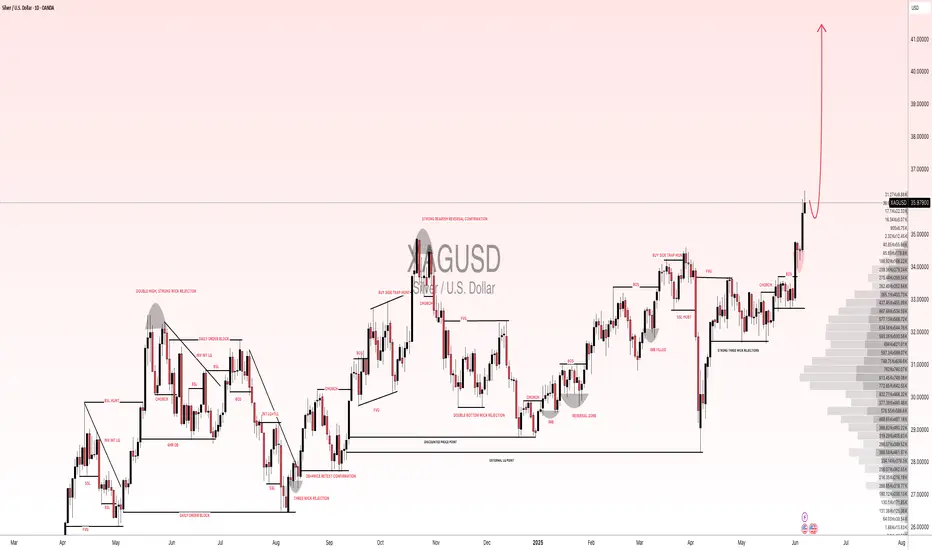
XAGUSD(SILVER):To $60 the silver is new gold, most undervaluedSilver has shown remarkable bullish behaviour and momentum, in contrast to gold’s recent decline. Despite recent news, silver remains bullish and unaffected by these developments. We anticipate that silver will reach a record high by the end of the year, potentially reaching $60.
There are compelling reasons why we believe silver will be more valuable in the coming years, if not months. Firstly, the current price of silver at 36.04 makes it the most cost-effective investment option compared to gold. This presents an attractive opportunity for retail traders, as gold may not be suitable for everyone due to its nature and price.
Silver’s price has increased from 28.47 to 36.25, indicating its potential to reach $60 in the near future. We strongly recommend conducting your own analysis before making any trading or investment decisions. Please note that this analysis is solely our opinion and does not guarantee the price or future prospects of silver.
We appreciate your positive feedback and comments, which encourage us to provide further analysis. Your continuous support over the years means a lot to us.
We wish you a pleasant weekend.
Best regards,
Team Setupsfx
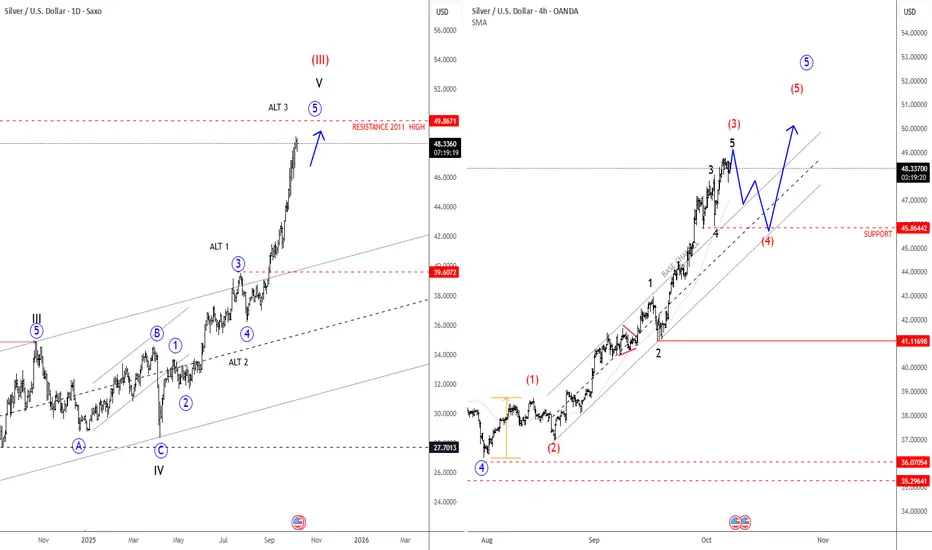
Silver Is Extending Impulsively Higher; All-Time Highs SoonSilver Is Extending Impulsively Higher, which can push the price into all-time highs from a technical point of view and by Elliott wave model.
Silver is on the rise and has been outperforming gold quite a lot over the last week, and it looks like an extended leg up is still in progress; seems like wave three of an extended impulse, therefore more gains are possible after next three-leg retracement. Based on the 4-hour chart, there is a chance that price goes towards 50usd, but there can be some new pullback first. Ideally red wave (4) could stabilize near 45.86. Only a sharp impulse down closer to 43 level will be an indication that higher degree wave four has started.
Higher Time frame charts show an ongoing bull cycle that is now targeting the high from April 2011, which could be the next major level and a potential area for a new retracement, maybe sometime in 2026.
Altcoins are heading toward a parabolic phase.Same setup, same chart, different story, different market
Silver laid the foundation for a parabolic run after breaking through a 3.8-year major resistance level.
The altcoin market cap TOTAL3 similarly broke through a 3.8-year major resistance level.
NASDAQ:ALTS \ TVC:SILVER
Altseason 🔃💹

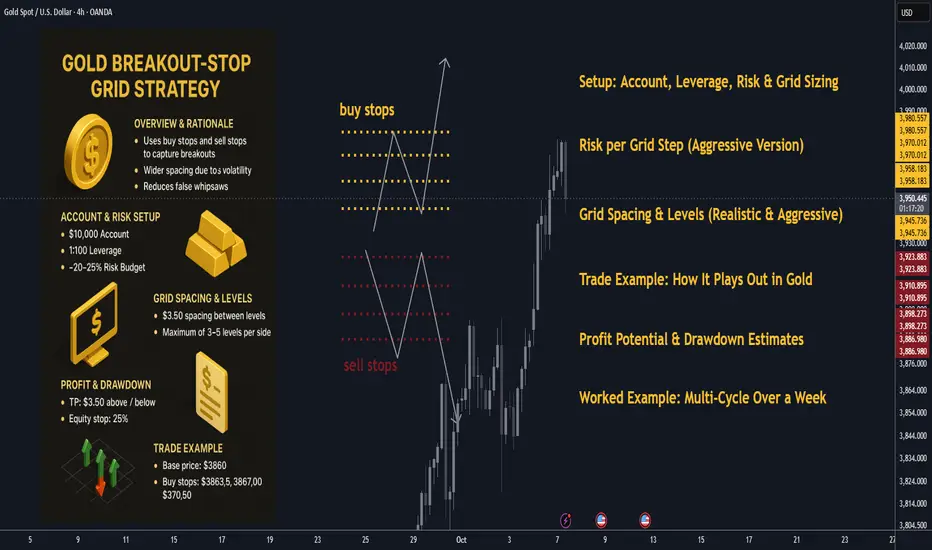
Gold Grid Trading Overview: Effective Strategy for 20% gains🪙 Gold Breakout-Stop Grid Strategy: Overview & Rationale
Grid trading is often built using limit orders above and below a base price, expecting the market to oscillate and capture many small profits. But in a strongly trending or volatile asset like gold, there is often breakout momentum that drives price through grid zones rather than bouncing.
By instead using buy stops above and sell stops below (i.e. breakout triggers), you capture directional thrusts, while still retaining a grid structure (i.e. multiple layers). Think of it as a hybrid between a breakout strategy and a grid.
Key advantages in gold:
• ✨ Gold often exhibits strong trending phases, with momentum after breakouts of supply/demand zones.
• 📊 Volatility is higher than many forex pairs, so you can space your grid more widely, reducing overcrowding.
• 🎯 With breakout stops, you reduce “false bounce” whipsaws inside the range; only when momentum validates do you trigger entries.
Risks / caveats:
• ⚠️ If price doesn’t break strongly and whipsaws, you could trigger and then reverse, creating drawdown.
• 📉 In a sideways gold market, fewer breakouts may be triggered, lowering trade frequency.
• 🛡 You must carefully size exposure and use drawdown controls, especially with leverage.
I’ll now walk through how to set this up, with gold-tailored specifics and sample trades (with increased aggressiveness), using realistic current spot prices (≈ $3,862) Investing.com.
________________________________________
🧮 Setup: Account, Leverage, Risk & Grid Sizing
📋 Account & Leverage
• Account size: $10,000
• Leverage: 1:100
• This means your maximum notional exposure is huge but margin and maintenance rules will limit you.
• We’ll now risk ~20–25%+ of equity in an aggressive version of this system (in order to aim for 20-30% weekly), i.e. $2,000–$2,500 at most drawdown limit for a grid run.
Note: This is very aggressive and only for demonstration. Many traders would never risk this much per grid.
💰 Risk per Grid Step (Aggressive Version)
• Let’s target $50 risk per triggered order (instead of $10) so that each step is meaningful.
• That means if a triggered order goes adverse by its maximum “stop zone,” your loss is $50.
• If you trigger, say, 5 steps, that’s $250 worst case on that direction (if all hit adverse).
• You must still cap total drawdown (e.g. 25% or $2,500) and limit exposures.
📈 Gold Contract & Price Movements
• Spot gold (XAU/USD) currently trades about $3,862.74 Investing.com.
• Let’s assume a contract specification such that 1 standard lot gives $100 per $1 move (so $1.00 move = $100) — a common ballpark in retail gold CFDs.
• Then:
• A move of $0.01 = $1 (for 1 lot).
• Therefore, if you trade 0.50 lots, a $1 move = $50.
So with this, to get ~$50 risk per $1 adverse move, 0.50 lots is a candidate (because $1 adverse × 0.50 lots × $100/lot = $50).
You can scale lot sizes accordingly.
📏 Grid Spacing & Levels (Realistic & Aggressive)
Given gold’s volatility, use wider spacing. Let’s choose:
• Grid spacing = $3.50 between successive triggers (a robust distance).
• We’ll place buy stops and sell stops relative to a base zone around current spot.
Let’s pick base ~ $3,860 as our pivot.
So:
• Buy stops: $3,863.50, $3,867.00, $3,870.50, $3,874.00, $3,877.50
• Sell stops: $3,856.50, $3,853.00, $3,849.50, $3,846.00, $3,842.50
(Max 5 levels each side, but you may cap to 3–5.)
Take Profit / Exit Logic:
• Target profit per trade = $3.50 (same as spacing).
• Thus one successful step = $3.50 × lot_size × $100.
• If lot_size = 0.50 lots, $3.50 × 0.50 × $100 = $175 profit per triggered trade.
• If you get 3 successful triggers in a run: 3 × $175 = $525 gross.
• That’s 5.25% on $10,000 in one clean directional run (before commissions/slippage).
You see the scaling is now aggressive — you risk more per step, but also gain more per successful trade. Limit how many triggers you allow (e.g. max 3–4 per side) to cap exposure.
Define a hard equity stop: e.g. if floating drawdown > 25% ($2,500), close all and reset.
________________________________________
🧭 Trade Example: How It Plays Out in Gold (Realistic Prices & Aggression)
We’ll do two detailed scenarios. This time we target higher returns, with real price zones.
________________________________________
🎯 Scenario A: Bullish Breakout
Base price: ~$3,860 (spot)
Buy stops: $3,863.50, $3,867.00, $3,870.50
Sell stops: $3,856.50, $3,853.00, $3,849.50
Lot sizing: 0.50 lots per order (so $3.50 adverse = $175 risk).
TP per trade: +$3.50
Sequence:
1. Gold climbs and breaks $3,863.50 → triggers Buy #1 at 3,863.50
o TP at 3,867.00 → profit if reached = ($3.50 × 0.50 × $100) = $175
2. Momentum continues, price breaks 3,867.00 → triggers Buy #2 there
o TP at 3,870.50 → another $175
3. Price surges, breaks 3,870.50 → triggers Buy #3 → TP = 3,874.00 → +$175
If all three succeed: Gross = $525 (5.25% gain) in one directional move.
If you allow up to 4 or 5 levels, total can scale to ~$700–900 (7–9%) in a strong move — if all hits. If reversal? If price reverses after buy #2, or before buy #3, you can:
• Close open longs immediately when opposite side’s sell stop triggers.
• Or cancel further buy stops once a reversal signal appears.
• Or net positions (if your broker supports hedging) — but that adds complexity.
Better to disable opposite side (sell stops) after the first buy triggers, to avoid collision exposures.
________________________________________
🔻 Scenario B: Bearish Breakout
Same base zone. Now price breaks downward.
• Sell stops at: 3,856.50, 3,853.00, 3,849.50
• TP each = –$3.50 from entry.
Sequence:
1. Gold breaks 3,856.50 → Sell #1 → target 3,853.00 → profit $175
2. Continues down, breaks 3,853.00 → Sell #2 → target 3,849.50 → +$175
3. Breaks 3,849.50 → Sell #3 → target 3,846.00 → +$175
If all three succeed: $525 profit.
If you allowed 4 levels: e.g. break 3,846.00 next → target 3,842.50 → +$175 more → total $700. Again, reversal risk must be managed.
________________________________________
📊 Mixed / Whipsaw Scenario
Suppose price crosses above $3,863.50 → triggers Buy #1, moves a bit, then reverses and crosses down through 3,856.50, triggering Sell #1.
You now hold:
• Long from $3,863.50 (losing)
• Short from $3,856.50 (potential profit)
This is a collision. To avoid chaotic risk:
• Cancel all opposite-side stops when first side triggers.
• Or immediately close all on first collision signal.
• Or lock in partial profit/loss and pause grid until trend clarity returns.
That’s why many breakout-grid strategies disable the opposite direction after first breakout.
________________________________________
📈 Profit Potential & Drawdown Estimates (Aggressive Model)
Let’s simulate one clean grid run (bullish) where 3 steps succeed fully:
• Gross profit = $525
• If you risked 3 steps * $175 = $525, worst-case these same 3 steps lose you $525 (if all adverse)
• Net = +5.25% in one run
• If you manage 2–3 such runs per week (if market allows), theoretically 10–15%+ weekly is possible — but that is optimistic.
However, in real life, not all runs will hit all targets — sometimes partial, sometimes losses. A drawdown of 25% ($2,500) is your cap boundary.
With that, if you undergo 5 bad runs in a row, you’d hit your equity stop.
If average win per run is $400 and average loss per bad run is $500, you need a favorable win-loss ratio to hit ~20–30% weekly. This is extremely aggressive.
________________________________________
🔁 Adaptive Mechanics & Enhancements (for robustness)
To improve consistency and manage risk, add:
• 📐 ATR-based spacing: Use a 14-period ATR on H4 or D1 to set grid spacing. If ATR = $4, spacing = $4 or $5.
• 📈 Trend filter: Only open buy-side grids when price > 200-period MA (H4 or D1), or only open sell-side when price < MA. Prevent fighting trend.
• 🚫 Volatility filter / news blocks: Do not place or trigger near major gold-related news (Fed, CPI, central bank announcements).
• 🔄 Grid rebase / reset: After a winning cycle, re-center grid around new price and restart stop orders.
• 📈 Scaling rules:
– Aggressive scaling: after n consecutive wins, increase lot size (within risk caps).
– Defensive scaling: after a loss, reduce lot size or skip grid.
• 🛑 Equity-stop / margin cap: If floating drawdown > 25% or margin usage > 80%, close all and reset.
• 🧊 Cooldown periods: After a loss or big run, pause grid orders for some hours/days to let market settle.
________________________________________
🧮 Worked Example: Multi-Cycle Over a Week (Aggressive)
Say you run 3 grid cycles in a week under trending conditions:
Cycle Direction Steps hit Gross profit Net (after one partial loss)
1 Up 3 out of 4 levels hit fully +$525 +$490 (small drawdown on partial)
2 Down 2 of 3 hit, 1 reversed +$350 +$320
3 Up 4 levels hit fully +$700 +$700
Total gross = $525 + $350 + $700 = $1,575
Net after adjustments/slippage ~ $1,450–$1,500
That’s ~ 14.5% gain in one week.
If the market is more favorable, you may hit ~20–30%, but the risk is commensurate.
Over multiple weeks the compounding is powerful — but a few big losses can wipe gains.
________________________________________
✅ Summary & Implementation Tips
• Use breakout stops (buy stops above, sell stops below) instead of limits to catch directional thrusts in gold.
• Wider grid spacing (e.g. $3–$5) is essential to survive volatility.
• Lot sizing must match your desired risk per step (here $50).
• Limit max triggers per direction and enforce a hard equity stop (e.g. 25%) to avoid blow-ups.
• Employ trend / volatility filters to filter low-probability entries.
• After a net winning run, rebase grid to current price.
• Use scaling and cooldown mechanics to moderate aggression.
• On collision signals, cancel opp side stops or close everything to avoid contradictory exposures.
SILVER Bullish Continuation! Buy!
Hello,Traders!
SILVER holds above the horizontal demand level, showing bullish intent as Smart Money defends premium reaccumulation zones. Expect a move toward 4,885$ to rebalance inefficiency and collect buy-side liquidity. Time Frame 1H.
Buy!
Comment and subscribe to help us grow!
Check out other forecasts below too!
Disclosure: I am part of Trade Nation's Influencer program and receive a monthly fee for using their TradingView charts in my analysis.

Altcoins VS. SilverSimilar technical structure in two different markets
Price and RSI are breaking above the major resistance level together.
Altcoin market cap (Total2) and silver chart, with the same supply zone and RSI breakout pattern, show a structural bullish signal.

Silver heading to 5000?The Silver remains in a bullish trend, with recent price action showing signs of a continuation breakout within the broader uptrend.
Support Zone: 4766 – a key level from previous consolidation. Price is currently testing or approaching this level.
A bullish rebound from 4766 would confirm ongoing upside momentum, with potential targets at:
4897 – initial resistance
4850 – psychological and structural level
5000 – extended resistance on the longer-term chart
Bearish Scenario:
A confirmed break and daily close below 4766 would weaken the bullish outlook and suggest deeper downside risk toward:
4716 – minor support
4665 – stronger support and potential demand zone
Outlook:
Bullish bias remains intact while the silver holds above 4766. A sustained break below this level could shift momentum to the downside in the short term.
This communication is for informational purposes only and should not be viewed as any form of recommendation as to a particular course of action or as investment advice. It is not intended as an offer or solicitation for the purchase or sale of any financial instrument or as an official confirmation of any transaction. Opinions, estimates and assumptions expressed herein are made as of the date of this communication and are subject to change without notice. This communication has been prepared based upon information, including market prices, data and other information, believed to be reliable; however, Trade Nation does not warrant its completeness or accuracy. All market prices and market data contained in or attached to this communication are indicative and subject to change without notice.

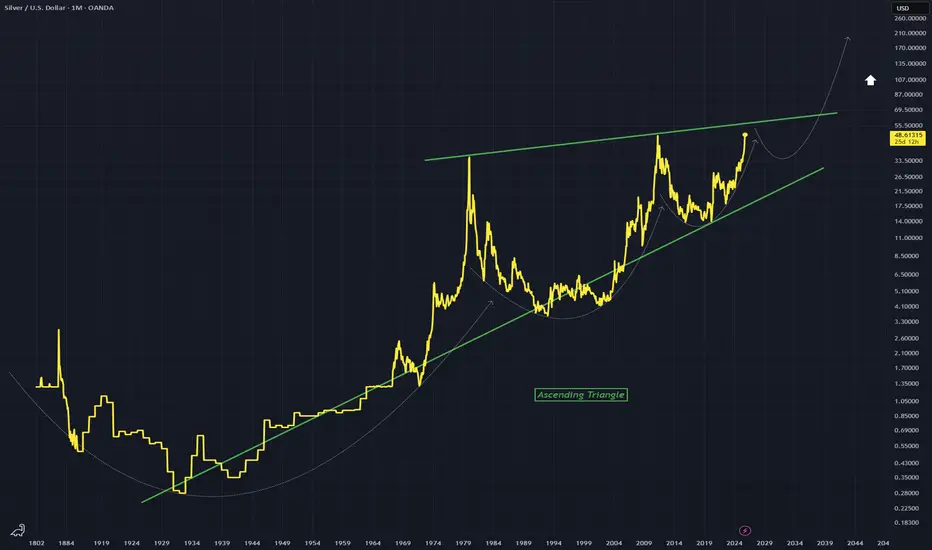
SILVER - Recurring Cup PatternInteresting chart showing repeating cups, each one progressively becoming tighter and tighter within this large ascending triangle on this Monthly chart.
Will another cup form and break out of this triangle? It is possible and would be a massive Breakout.
Again, Monthly chart.
XAGUSD GOOD SELL OPTIONWe have seen metals roaring upwards. However after recent Diplomatic and Geopolitical situations we can see slight pull back

XAGUSD H1 | Potential Bullish Continuation AheadXAG/USD is falling towards the buy entry which is a pullback support that aligns withthe 38.2% Fibonacci retracement and could bounce from this level to the upside.
Buy entry is at 47.61, which is a pullback support that aligns with the 38.2% Fibonacci retracement.
Stop loss is at 46.74, which is a pullback support that is slightly above the 78.6% Fibonacci retracement.
Take profit is at 49.46, which is aligns with the 161.8% Fibonacci extension.
High Risk Investment Warning
Trading Forex/CFDs on margin carries a high level of risk and may not be suitable for all investors. Leverage can work against you.
Stratos Markets Limited (tradu.com/uk ):
CFDs are complex instruments and come with a high risk of losing money rapidly due to leverage. 65% of retail investor accounts lose money when trading CFDs with this provider. You should consider whether you understand how CFDs work and whether you can afford to take the high risk of losing your money.
Stratos Europe Ltd (tradu.com/eu ):
CFDs are complex instruments and come with a high risk of losing money rapidly due to leverage. 66% of retail investor accounts lose money when trading CFDs with this provider. You should consider whether you understand how CFDs work and whether you can afford to take the high risk of losing your money.
Stratos Global LLC (tradu.com/en ):
Losses can exceed deposits.
Please be advised that the information presented on TradingView is provided to Tradu (‘Company’, ‘we’) by a third-party provider (‘TFA Global Pte Ltd’). Please be reminded that you are solely responsible for the trading decisions on your account. There is a very high degree of risk involved in trading. Any information and/or content is intended entirely for research, educational and informational purposes only and does not constitute investment or consultation advice or investment strategy. The information is not tailored to the investment needs of any specific person and therefore does not involve a consideration of any of the investment objectives, financial situation or needs of any viewer that may receive it. Kindly also note that past performance is not a reliable indicator of future results. Actual results may differ materially from those anticipated in forward-looking or past performance statements. We assume no liability as to the accuracy or completeness of any of the information and/or content provided herein and the Company cannot be held responsible for any omission, mistake nor for any loss or damage including without limitation to any loss of profit which may arise from reliance on any information supplied by TFA Global Pte Ltd.
The speaker(s) is neither an employee, agent nor representative of Tradu and is therefore acting independently. The opinions given are their own, constitute general market commentary, and do not constitute the opinion or advice of Tradu or any form of personal or investment advice. Tradu neither endorses nor guarantees offerings of third-party speakers, nor is Tradu responsible for the content, veracity or opinions of third-party speakers, presenters or participants.

$50 Silver"Decade of zero returns" for the stock market = Shortening Bear Market for Commodities
Price target = $50
Fractal backbone + Room in technicals for such move.
Price target was established in June 2021.
Time frame pushed up in anticipation of 2023 bear.

Gold | Oil | Dollar | Silver | Natural Gas Price ForecastGold | Oil | Dollar | Silver | Natural Gas Price Forecast
COMEX:GC1! COMEX:SI1! AMEX:BOIL AMEX:KOLD

SILVER The Target Is DOWN! SELL!
My dear friends,
My technical analysis for SILVER is below:
The market is trading on 47.990 pivot level.
Bias - Bearish
Technical Indicators: Both Super Trend & Pivot HL indicate a highly probable Bearish continuation.
Target -47.247
Recommended Stop Loss -4848.0
About Used Indicators:
A pivot point is a technical analysis indicator, or calculations, used to determine the overall trend of the market over different time frames.
Disclosure: I am part of Trade Nation's Influencer program and receive a monthly fee for using their TradingView charts in my analysis.
———————————
WISH YOU ALL LUCK
Gold next week: Key S/R Levels and Outlook for Traders🏆 Friday’s Close & Recent ATH:
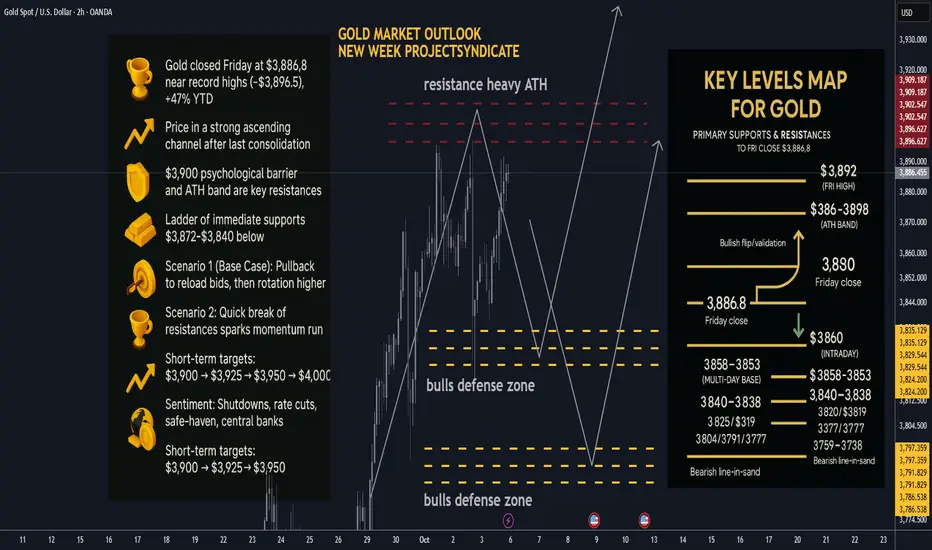
Gold (XAUUSD) closed Friday at $3,886.8, after printing a session high near $3,891.9. The latest all-time high is ~$3,896.5 (Thu), putting $3,900 squarely in play as the next psychological milestone. YTD performance remains extraordinary (≈+47% in 2025).
📈 Trend Structure:
Price continues to track a well-defined ascending channel on 1H/4H with a clean impulsive leg out of the last consolidation. Market character = higher highs / higher lows, persistent dip-buying, and strong trend adherence into quarter-turn levels (25/50 handles).
🔑 Key Resistance Levels:
The most critical resistance now sits at $3,900 (psychological + round-number supply). Beyond that, watch the ATH band $3,896–$3,898 and Friday’s spike high $3,892. Break/acceptance above opens $3,925–$3,950 as measured-move extensions, with $4,000 as a probable magnet on momentum follow-through.
🛡️ Support Zones:
Immediate supports step down as follows: $3,872–$3,860 (intraday pivot), $3,858–$3,853 (multi-day base), $3,840–$3,838 (Fri low). Deeper structural shelves: $3,825–$3,820, $3,804, $3,791, $3,777. A sustained break below $3,838–$3,825 would signal a more meaningful corrective phase.
⚖️ Likely Scenarios:
• Scenario 1 (Base Case) – Pullback then push: Controlled dip into $3,858–$3,838 to reload bids, then rotation higher toward $3,900+.
• Scenario 2 – Straight break: Quick clearance of $3,892/ATH $3,896–$3,898 → $3,900, unleashing a momentum run into $3,925–$3,950.
(Overbought signals persist, but structural demand keeps dips shallow.)
📊 Short-Term Targets:
On continuation: $3,892 → $3,900 → $3,925 → $3,950, with $4,000 as stretch if acceptance holds above $3,900. On retrace: $3,858 → $3,840 → $3,825.
💡 Market Sentiment Drivers:
• Shutdown-driven data delays & uncertainty are boosting safe-haven bids; Friday’s NFP was delayed, reinforcing cut expectations.
• Rate-cut odds remain elevated into October, keeping the opportunity cost of holding gold low (FedWatch/BofA commentary).
• Official-sector demand stays constructive (central banks resumed net +15t buying in August per WGC), underpinning dips.
• Macro/geopolitical risk + tariff chatter continue to provide a tailwind; 2025’s ~47% surge underscores the regime shift.
🔄 Retracement Outlook:
A tag of $3,858–$3,853 (multi-day pivot) or a stop-run to $3,840–$3,838 is a typical “healthy” pullback zone inside trend. Swift reclaim of $3,858/53 after a liquidity flush often precedes fresh ATHs.
🧭 Risk Levels to Watch:
Holding above $3,858–$3,838 keeps the bullish structure intact. Failure/acceptance below $3,825 shifts risk toward $3,804 → $3,791 → $3,777 and opens the door to $3,759–$3,738.
🚀 Overall Weekly Outlook:
Gold remains in a power-trend with $3,892/ATH $3,896–$3,898 → $3,900 as the immediate battleground. Expect orderly, buyable dips while those supports hold; topside roadmap favors $3,925–$3,950 with $4,000 viable on a decisive breakout/acceptance.
________________________________________
🗺️ Key Gold Levels Map — Primary Supports & Resistances (Updated to Fri Close $3,886.8):
Primary Resistances: 3892 (Fri high) → 3896–3898 (ATH band) → 3900 → 3925 → 3950 → 4000.
Primary Supports: 3872–3860 (intraday) → 3858–3853 (multi-day base) → 3840–3838 (Fri low) → 3825 / 3819 → 3804 / 3791 / 3777 → 3759–3738 (deeper control).
Bullish flip/validation: Sustained acceptance ≥3900 turns dips into buys toward 3925–3950.
Bearish line-in-sand: Daily close <3825 weakens the trend; <3791 confirms a broader corrective swing.
#SILVER XAG/USDChart Setup
Asset: Silver (Silver / US Dollar - XAG/USD)
Timeframe:12 Month (very long-term view from 1954 onwards)
Scale: Logarithmic chart, which effectively shows long-term percentage growth.
Major Breakout: The chart shows silver breaking out of a multi-year consolidation pattern that formed after the 2011 peak. This pattern resembles a bull flag or a large pennant.
Resistance Becomes Support: Once Silver has decisively broken above the critical horizontal resistance level around $50, which was the peak in 1980 and 2011. This is a very strong bullish signal.
Ascending Channel: The price is trading within a well-defined, multi-decade ascending parallel channel. Currently, it has broken above the channel's midpoint, suggesting a move towards the upper boundary is possible.
Projected Path: I expect the price to confirm the breakout by potentially retesting the ~$50 level as support before continuing its upward trajectory.
Fibonacci Targets: A Trend-based Fibonacci extension tool is used to project future price targets.
Next Target Zone: The primary target is set around $130.
Long-Term Potential Targets: Much higher, longer-term targets are identified at approximately $783 and $4,752.

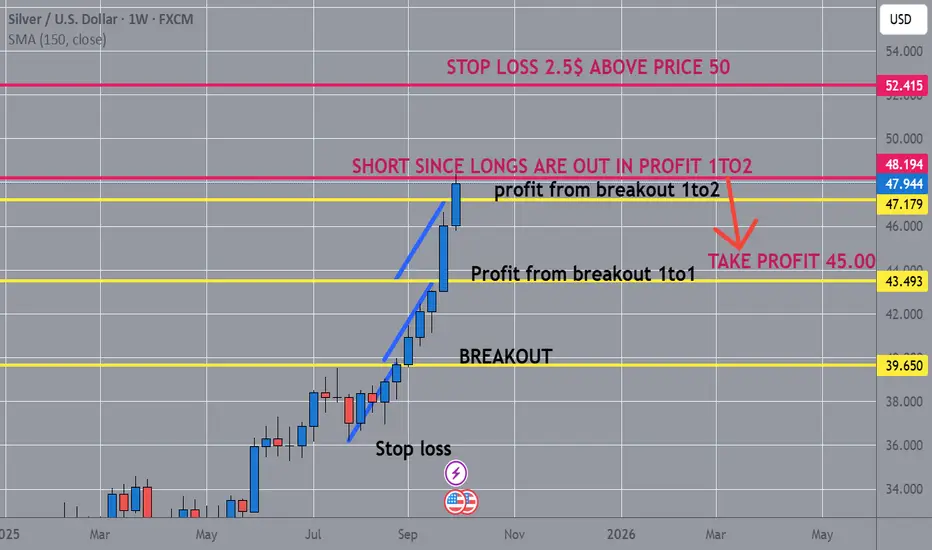
Silver Weekly Chart Short Position after longs are out in profitSilver Weekly Chart Short Position after longs are out in profit
Since the breakout, silver has already moved 200% of the breakout range, meaning that anyone who bought the breakout has effectively doubled their money, assuming they placed their stop loss below the previous low.
When such a move occurs, we typically see massive profit-taking from large buyers, which almost always leads to a strong correction before the market attempts another leg higher.
In fact, this could mark the end of the upward move, with the price likely to fall back toward the 42.00 area before any renewed rally attempt.