Silver Prices Stabilise Near Record HighsSilver Prices Stabilise Near Record Highs
As the XAG/USD chart shows, the price of silver per ounce is consolidating near its all-time high, which lies above $85.
Bullish sentiment dominates the market, as concerns over the independence of the US Federal Reserve, heightened geopolitical tensions, and other factors have fuelled demand for safe-haven metals. According to media reports:
→ Official authorities are exerting pressure on the Fed to cut interest rates, having opened a criminal case against its Chair. Powell, in turn, described these actions as a “pretext” for influencing the decisions of an independent financial institution.
→ Traders are also closely monitoring the escalation of protests in Iran, which could lead to US military involvement, alongside President Trump’s statements about the annexation of Greenland. In the aftermath of the operation in Venezuela, such scenarios are increasingly being viewed as realistic.
Technical Analysis of the XAG/USD Chart
On 29 December, we updated the previously drawn ascending channel and suggested a potential decline in silver prices towards its lower boundary, with a possible bearish breakout attempt.
Indeed, prices moved down to the lower boundary. However, after the formation of an Inverted Head and Shoulders (IHS) pattern, bulls found support there and resumed the upward trend.
The current consolidation in XAG/USD confirms the role of the channel median, which appears to act as a reference level acceptable to both buyers and sellers. That said, today’s CPI release could disrupt this balance. Possible scenarios include:
→ a pullback towards the psychological support around $80, where the bullish impulse marked by the arrow began;
→ a rise towards the QH line, which divides the upper half of the channel into two quarters.
This article represents the opinion of the Companies operating under the FXOpen brand only. It is not to be construed as an offer, solicitation, or recommendation with respect to products and services provided by the Companies operating under the FXOpen brand, nor is it to be considered financial advice.
Xagusdanalysis

Parabolic Moves Don’t Always End in Collapse — Silver ExplainedI’ve seen many analyses from my colleagues where 1980 and 2011 are used not as upside projections, but as collapse templates for silver.
The argument is simple and visually convincing: silver has already gone parabolic, therefore the next chapter must be a collapse similar to those historical episodes.
I understand the logic.
I don’t predict the future, and I can’t categorically deny that such an outcome is possible.
But here’s where I draw a clear line: similar-looking charts do not guarantee similar outcomes, especially when the underlying drivers are fundamentally different.
And in silver’s case, they are different.
Let’s be precise about what 1980 really was (and why it collapsed)
The 1980 silver collapse is often treated as a “natural law of parabolic moves”.
In reality, it was not a natural market outcome.
It was the direct consequence of extreme concentration and leverage, driven by the Hunt brothers.
What made 1980 fragile by design
- The Hunts accumulated an extraordinary share of the global silver supply, both physical and paper.
- They used massive leverage in a relatively small and illiquid market.
- The price did not rise because global demand structurally changed — it rose because supply was artificially constrained.
- Once exchanges changed the rules (margin hikes, liquidation-only trading), the entire structure collapsed under its own weight.
This is critical:
The collapse of 1980 was not caused by silver being “too expensive”.
It was caused by the system forcibly unwinding a concentrated position.
So when someone says “this looks like 1980”, the real question is:
- Where is today’s equivalent of that concentration?
- Who controls 30–40% of deliverable supply?
- What single entity is forced to liquidate?
If that element is missing, then the collapse logic weakens dramatically.
2011: parabolic, yes — structurally unstable, also yes
2011 is a more honest comparison, and this is where many collapse arguments focus.
Silver:
- rallied aggressively,
- became a retail darling,
- and eventually collapsed hard.
But again, the reason it collapsed matters.
Why 2011 unraveled
- The rally was dominated by financial demand, not structural necessity.
- ETFs, leverage, and macro fear created fast money flows.
- When liquidity tightened and risk appetite faded, demand evaporated quickly.
- There was no structural constraint on supply forcing price stability.
In other words:
- 2011 collapsed because demand was reversible.
- Once sentiment flipped, there was nothing underneath to slow the fall.
Now comes the disagreement: why I don’t expect a 1980/2011-style collapse this time
Yes — I fully agree on one thing: extreme volatility is coming, or is already here (yes, more extreme than we've seen!)
Silver doesn’t trend quietly. It never has.
But volatility and collapse are not the same thing.
The key difference today: the type of demand
Today’s silver market is not driven solely by:
- fear,
- speculation,
- or monetary narratives.
A large and growing portion of demand is industrial and strategic:
- electrification,
- energy transition,
- technology infrastructure.
That demand:
- doesn’t disappear overnight,
- doesn’t panic-sell because RSI is overbought,
- and doesn’t care about chart symmetry.
This changes the downside dynamics.
Supply cannot respond the way people assume
Another overlooked point:
- most silver production is a by-product of other metals.
- higher prices do not instantly bring new supply online.
In 1980 and 2011, supply dynamics were not a binding constraint.
Today, they are.
That doesn’t mean price can’t drop — it means drops are more likely to be violent corrections, not structural collapses.
About the “parabolic = must collapse” logic
This is where I respectfully disagree with many analysts.
A parabolic move tells you:
- volatility is increasing,
- positioning is crowded,
- risk management becomes essential.
It does not automatically tell you:
- the entire move must fully retrace,
- or that price discovery was fake.
Markets can:
- correct through time instead of price,
- form wide ranges,
- or retrace partially and rebase.
History offers multiple outcomes, not a single script.
My base case (clear and unemotional)
- Yes, I expect extreme swings.
- Yes, I expect sharp pullbacks that will scare most participants.
- No, I do not see a clear mechanism today for a 1980-style forced collapse.
- And unlike 2011, I don’t believe demand disappears just because momentum cools.
This is not optimism.
It’s structure-based reasoning.
Trading perspective (grounded)
Because I expect volatility:
- I don’t chase vertical candles.
- I respect levels, not narratives.
- I scale, I take partial profits, and I allow room for noise.
- I treat silver as a dangerous instrument, not a lottery ticket.
Being right about direction is useless if volatility kicks you out first.
Final thought
My colleagues may be right — markets can always surprise.
But assuming collapse just because the chart looks familiar is lazy analysis.
1980 collapsed because of forced concentration unwind.
2011 collapsed because of reversible financial demand.
Today, silver is volatile — not hollow.
And that distinction matters more than any historical overlay.
The market will decide.
My job is to respect risk, not marry analogies 🚀
Best of luck!
Mihai Iacob

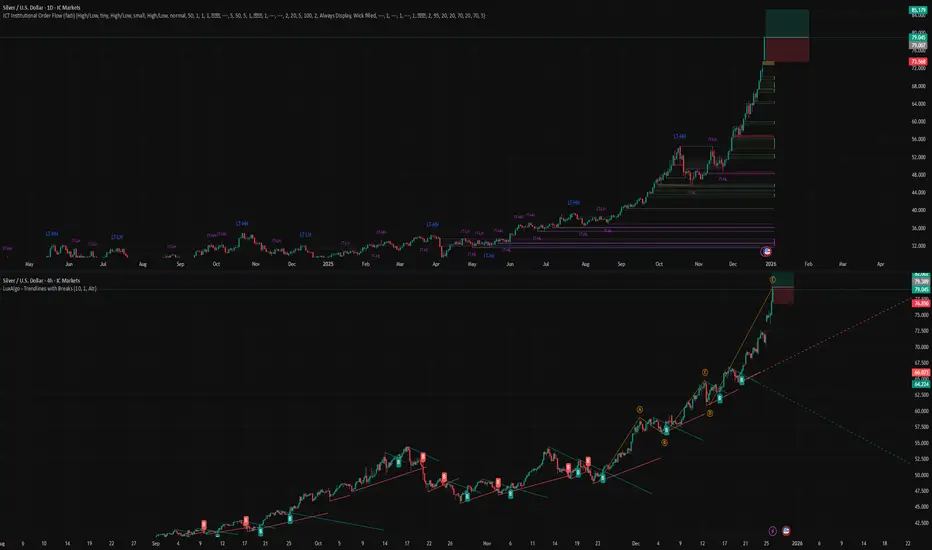
Silver is flashing a warning it hasn’t shown in decadesToday the price crossed $90 per ounce while the monthly RSI the 92 level. Higher than 2011, when silver topped out near RSI 82 and then fell by ~80%
The only other time we’ve seen this level was 1980… followed by a ~90% crash
History doesn’t repeat perfectly, but it does rhyme
So the real question is: what makes this time different?

Silver - This metal is blowing up now!💣Silver ( OANDA:XAGUSD ) is rallying even higher:
🔎Analysis summary:
Just a couple of months ago, we witnessed another bullish break and retest on Silver. It was quite obvious that Silver will rally accordingly and just recently, we experienced another +150% rally. However, looking at the higher timeframe, Silver is still not done.
📝Levels to watch:
$100
SwingTraderPhil
SwingTrading.Simplified. | Investing.Simplified. | #LONGTERMVISION

Silver Buy Trading Opportunity SpottedH1 - Strong bullish move
No opposite signs
Until the two support zones hold I expect bullish continuation
👉 If you enjoy this analysis, please Like, Follow, and Support the profile! Your engagement motivates us to share more quality setups.


XAGUSD (SILVER) PlanPrice is forming a bullish 1W OB. I expect continuation of the bullish 1D OF toward the 1W FP (ATH) target.

SILVER - Ascending Channel Breakout! | Liquidity Sweep Complete
Hey TradingView community! 👋
Silver is EXPLODING right now! Let me break down what I'm seeing on the 45-minute chart.
The Setup
XAGUSD is trading at $81.72 (+2.28%) inside a beautiful ascending channel, and it just swept liquidity from the 4HR FVG zone before launching higher. This is textbook bullish price action - sweep the lows, grab liquidity, then rip to the upside.
We're now pushing toward the 52-week high at $83.75. The momentum is STRONG.
Why I'm Bullish
Ascending channel intact - higher highs, higher lows
Liquidity sweep complete - 4HR FVG zone filled and bounced
Up 11.80% this week alone - second highest close in HISTORY
Up 171% in the past year - absolute monster performance
HSBC targeting $100/oz silver - analysts extremely bullish
Soft US payrolls data = Fed rate cuts = bullish for metals
The News is INSANE
Silver is on a historic run:
Up 11.80% this week - ended at $78.88 (second highest close EVER)
Up 8 of the past 10 weeks - relentless buying
171.36% gain over the past year - outperforming almost everything
HSBC sees gold at $5,000 and silver at $100 in H1 2026
Soft US jobs data (50K vs 60K expected) = more Fed cuts coming
Geopolitical tensions (Venezuela, Ukraine, Greenland) = safe-haven demand
Index rebalancing pressure is OVER - bulls back in control
Key Levels I'm Watching
Resistance:
$82.80 - Immediate resistance
$83.75 - 52-WEEK HIGH / All-time high area
$85.00+ - Breakout target
$100.00 - HSBC analyst target
Support:
$79.85 - Immediate support (previous resistance)
$76.50-78.00 - 4HR FVG zone (already swept)
$73.50-74.00 - 2HR FVG zone (deeper support)
$70.00 - Major support / channel bottom
My Game Plan
Bullish scenario (PRIMARY): Silver just swept the 4HR FVG and is now pushing toward the 52-week high at $83.75. If we break above that level with volume, next stop is $85+, then potentially $100 as HSBC predicts. The ascending channel is intact, momentum is strong, and fundamentals are bullish (Fed cuts, geopolitics, safe-haven demand).
Bearish scenario: If we get rejected at $83.75 and lose $79.85 support, we could retrace to the 4HR FVG zone at $76.50-78.00. But given the strength of this move, I'd view any pullback as a buying opportunity.
The Bottom Line
I'm BULLISH. This is one of the cleanest setups I've seen. Ascending channel, liquidity sweep complete, FVG filled, and now exploding higher. Silver is up 171% in a year and analysts are calling for $100.
The trend is your friend here. Buy dips, target new highs.
Let's see if we can break that $83.75 ATH! 🎯
What do you think? New all-time highs incoming? Let me know in the comments! 👇

Silver: Stronger Story, Higher VolatilitySilver, both safe-haven demand and industrial demand are working together.
From a technical perspective, 78.70 – 79.00 is the short-term balance area. To the upside, the 81.00 – 84.00 zone stands out as the main resistance that needs to be cleared. On pullbacks, 77.00 (0.5) and 75.40 (0.382) should be closely monitored.
👉 Comment: Silver is more volatile than gold, but its underlying narrative is stronger.

SilverXAGUSD
- Completed " 12345 " Impulsive Waves and " ABC " corrective waves
- Break of Structure
- Consolidation Phase
- Bearish Channel as an corrective pattern in Short Time Frame
- Fair Value Gap

Silver Analysis
4h analysis shows the reaction on resistance area and price could hold itself above it. which is %70 of the bearish move. So bullish signal (blue box)
Daily candle closed above all other days. another bullish signal. (yellow line)
According to ichimoku and fibo this area is important so signal of bullish.
we are close to the top of first channel, will publish update later.
Stay tuned for our next updates.

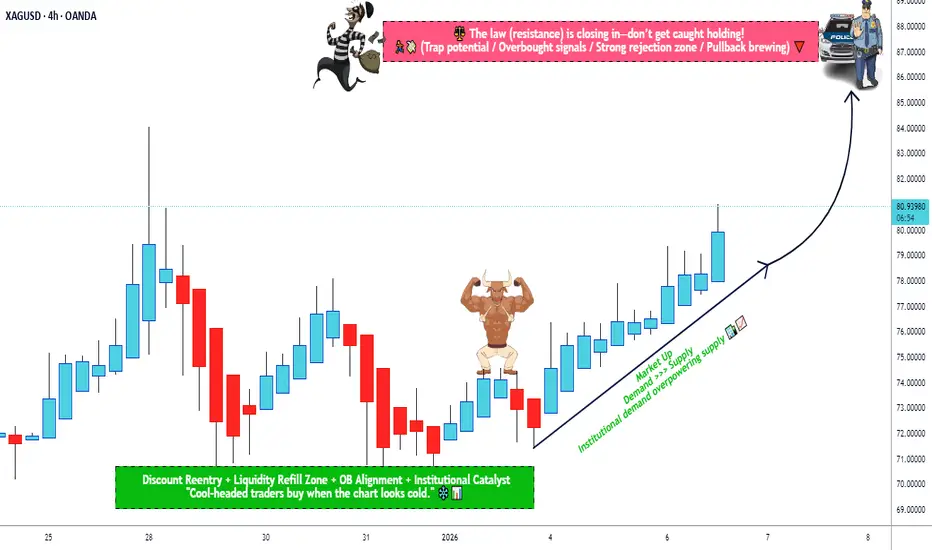
XAG/USD › Bullish Price Structure & Trade Planning📈 TITLE — SILVER SWING BREAKOUT 📊 XAG/USD “SILVER vs USD” 🥈
Market Blueprint | Bullish Thief Strategy | Layered Entries + Macro Signals
📝 DESCRIPTION
🔔 Asset: XAG/USD – Silver vs U.S. Dollar (Metals)
💡 Trade Bias: Bullish (Day / Swing)
🚀 Plan Summary:
Silver remains in a structural uptrend and is trading at elevated levels with strong industrial and safe-haven demand. Macro drivers include dovish Fed expectations, persistent supply deficits, and robust demand from solar, EV & tech sectors — all bullish fundamentals supporting higher prices.
📌 Entry Strategy (Thief Layering)
Thief layering strategy — place multiple buy limits to scale into strength with risk control:
🎯 Layer Buy Zones (example):
• 🟩 76.000
• 🟩 78.000
• 🟩 80.000
(You can increase/add layers based on volatility & personal risk tolerance.)
📌 Why layering?
This technique helps build position as price retests structural supports while capturing volatility swings.
🔥 Stop-Loss (Risk Control)
🛑 Thief Stop-Loss @ 74.000
👉 Adjust SL based on your risk profile — trade safe, manage risk first.
🎯 Target / Profit Zones
🏁 Target Area: ~87.000
Key resistance zone near overbought levels & potential reversal/top trap region — take partial profits. Let price action confirm continuation.
Targets are guidelines — manage according to your risk/reward.
📊 Correlated Pairs to Watch
Watch correlations with:
• XAU/USD (Gold) — safe-haven behavior often aligns with silver trends.
• USD Index (DXY) — stronger USD can cap metals; weaker USD fuels bullion upside.
• Copper / Base Metals — industrial demand context.
Correlation signals give context on trend strength vs macro flows.
📈 Macro & Fundamental Drivers (Latest)
Bullish Fundamentals:
🔹 Silver has seen a historic rally and recently touched near record highs, driven by supply constraints + industrial demand.
🔹 Structural supply deficits and growing tech/green energy demand support higher price floors.
🔹 Market pricing still reflects expectations of Fed rate cuts in 2026, pushing yield-less assets higher.
Risk / Volatility Factors:
⚠ Index rebalancing and technical selling could add short-term pressure.
⚠ Silver historically more volatile than gold → wider swings possible.
📅 Economic & News Catalysts
Keep an eye on these reports with London time relevance:
📌 US Federal Reserve rate decisions & press releases
📌 US CPI & employment (NFP) data
📌 ISM Manufacturing + global PMIs
📌 China industrial output & export policies
These data points shape USD direction, interest-rate expectations, and commodity flows.
💬 Risk Reminder (Thief OGs)
Dear traders, sizing SL/TP is YOUR decision — trade your plan. Profits are earned when disciplined. Live setups change — adapt.
📌 This is a guideline plan based on current structure, not financial advice.
Silver Analysis
Daily candle closed above tha last 3 days, bulish signal. (purple line)
4h analysis shows the reaction on resistance area (blue) that sellers were not strong enough to bring the price to lower low, additionally this area is valid if we use Ichimoko indicator too, so if candle close above this area we can join buyers.
Stay tuned for our next updates.

Silver — Strong Bull Trend, but Is the Correction Really Over?After the explosive rally to a new all-time high near the 84 zone, OANDA:XAGUSD experienced a sharp correction, dropping nearly 15,000 pips — a natural reaction after such an extended move.
Buyers eventually regained control just above the 70 zone, where the market established a solid floor.
However, the first rebound produced a lower high, and the following high was also lower — which currently shapes what appears to be a potential descending triangle structure (still unconfirmed at this stage).
❓ Key Question: Is the Correction Finished?
From a long-term perspective, there is no doubt about the dominant trend — Silver remains strongly bullish over the macro horizon.
But the short-term issue remains:
👉 Has the correction already ended, or is there more downside risk ahead?
Right now, the answer depends on two critical levels.
⚖️ Decision Levels to Watch
1️⃣ 74 Resistance Zone
A clean breakout above 74 would
✔️ invalidate the current corrective structure
✔️ confirm bullish continuation
✔️ open the door toward further upside extensions
2️⃣ 70 Support Zone
A breakdown below 70 would
⚠️ strengthen the descending-triangle scenario
⚠️ expose Silver to a deeper correction
➡️ potentially toward the 63 zone
📌 Trading Stance for Now
Given today’s low-liquidity environment, the prudent approach is:
👉 wait for confirmation rather than forcing a position
Price action around 70 and 74 will likely provide the next major directional clue. Until then — patience remains the best strategy. 🚀

SilverXAGUSD
- Demand Zone
- Completed " 12345 " Impulsive Waves
- Break of Structure
- Descending Triangle as an corrective pattern in Short Time Frame
- Fair Value Gap

Why Silver XAGUSD should be considered as portfolio good part?
📌 Why Silver Is Getting So Much Attention Right Now?
Silver is not just for jewelry anymore. It is becoming super important for technology and clean energy.
🌍 1. China and Silver Supply
China 🇨🇳 is the 2nd biggest silver miner in the world.
It is also the largest silver refiner globally.
About 60% of the world’s refined silver exports come from China.
Starting Jan 1, 2026, China will limit silver exports, so almost 60% of Chinese silver will stay inside China.
This means less silver will be available in the world market.
💡 2. Silver Is Already in Short Supply
For the past 5 years, silver demand has been higher than supply.
In 2025:
• Demand: 1.2 billion ounces
• Supply: 1.05 billion ounces
This means the market is already short, and the China export rules will tighten supply even more.
⚡ 3. Silver Use in New Technology
Tesla car batteries need silver, and Elon Musk even mentioned he is worried about silver prices (27 Dec 2025 tweet).
Samsung + BMW are making a battery using 1 kg of silver, which can charge 1000 km in 9 minutes and last 20 years.
Silver is also used in solar panels, AI data centers, EVs, and computer chips.
• Solar power is growing fast all over the world.
• EV sales and charging needs are expanding.
• AI and digital infrastructure need more silver every year.
📈 4. Silver Outperforming Gold
In 2025, silver prices rose 160%, while gold only rose 75%.
This shows silver’s strong demand and real-world value are driving prices higher.
📊 5. Demand Is Bigger Than Supply
For many years, the world has been using more silver than is being mined. This creates a shortage situation.
✅ In Short:
Global silver supply is tight.
China export limits make supply even smaller.
Industrial and tech demand is growing fast.
Silver prices are rising faster than gold.

XAG/USD Bullish Structure Signals Upside Continuation!🔥 XAG/USD — SILVER vs U.S. DOLLAR
📊 Metals Market Opportunity Blueprint (Day / Swing Trade)
🧭 Market Bias
🟢 BULLISH PLAN CONFIRMED
Silver continues to show strength with bullish momentum supported by macro and metals-sector flows. Volatility expansion favors trend continuation traders.
🟢 Trade Execution Plan
📌 Entry:
✅ Buy at any price level
➡️ Suitable for scaling, cost-averaging, or momentum entries based on individual strategy.
🛑 Risk Management
🔻 Stop Loss: 73.000
⚠️ Dear Ladies & Gentlemen (Thief OG’s),
This SL is not mandatory. Adjust according to your own risk management & position sizing.
Trading involves risk — manage capital wisely.
🎯 Profit Objective
🎯 Target: 80.000
📍 Strong resistance zone detected
📍 Overbought conditions possible near highs
📍 Potential correction & liquidity trap expected
🚨 Kindly secure profits near resistance levels.
⚠️ TP level is guidance only — adapt exits based on market behavior and your strategy.
🔗 Related Markets to Watch (Correlation Focus)
💵 U.S. Dollar Index (DXY)
📉 Weakening USD = Bullish for Silver
📈 Strong USD = Headwind for XAG/USD
🟡 XAU/USD (Gold vs USD)
Silver often follows Gold’s directional bias
Gold strength usually confirms Silver upside momentum
📈 US10Y Treasury Yields
Falling yields → Supports precious metals
Rising yields → Pressure on non-yielding assets like Silver
🛢️ WTI Crude Oil (USOIL)
Inflation expectations linked to energy prices
Rising oil can indirectly support Silver as an inflation hedge
🌍 Fundamental & Economic Factors to Watch
🏦 Federal Reserve Policy
Rate cut expectations → Positive for Silver
Dovish tone weakens USD, boosting metals
📊 U.S. Inflation Data (CPI / PCE)
Higher inflation → Silver demand as a hedge
Cooling inflation may slow momentum temporarily
🏭 Industrial Demand Outlook
Silver has strong use in solar panels, EVs, electronics
Global manufacturing recovery supports long-term demand
🌐 Geopolitical & Risk Sentiment
Market uncertainty → Safe-haven inflows into metals
Risk-off environments favor Silver accumulation
🧠 Trader’s Note
📌 This is a market opportunity blueprint, not financial advice.
📌 Trade responsibly, manage risk, and adapt to live market conditions.

#SILVER(XAGUSD): Another Big Buy In Making, 2026 We Are Ready! **SMC|ICT Based Analysis On Silver (XAGUSD)**
Dear Traders,
We extend our best wishes for the upcoming New Year.
🔺Today, we will analyse Silver (XAGUSD). The month of December typically presents reduced market liquidity and volume due to numerous holidays. The market initiated with a positive liquidity gap at $83.50, subsequently experiencing a significant decline. The price descended to $70.44 and is currently trading at $71.51. This substantial sell-off indicates a high probability of further price depreciation. We anticipate the price to fall within the range of $68 to $66.
🔺Entering a position within our identified key levels may prove profitable, with take-profit targets established at the following key levels: the first at $75, the second at $78, and the swing key level at $85. These levels should be utilized as take-profit objectives. For stop-loss placement, we suggest setting it at $66, or at your discretion.
🔺We wish you a prosperous New Year and hope this year fulfils your aspirations. We sincerely appreciate your continued support throughout the years.
Team SetupsFX_

Silver’s 2025 Explosion — How High Can It Go?In 2025, Silver ( OANDA:XAGUSD ) has experienced a remarkable surge, making it one of the most notable assets of the year. As we approach the end of 2025, I’ve decided to analyze silver to see how far its bullish trend might continue. So, stay with me as we delve into the reasons behind silver’s rise and explore how far this upward momentum could go.
Let’s begin by looking at the fundamental factors driving silver’s increase in 2025. After that, we’ll move on to the technical analysis.
Fundamental Drivers Behind Silver’s Massive 2025 Rally:
Structural Supply Deficit — Multi‑year deficits draining inventories, tight physical market.
Strong Industrial Demand — Solar, EVs, semiconductors & data centers consuming silver at record levels.
Rate Cut Expectations — Anticipated Fed easing lifts non‑yielding assets like silver.
Safe‑Haven Flows — Geopolitical risk, inflation, and a softer dollar boosting precious metals demand.
Liquidity & Momentum — Smaller market vs gold( OANDA:XAUUSD ) amplifies swings, attracting speculators.
Silver has surged ~ 150–165% YTD , setting fresh all‑time highs as both an industrial metal and investment hedge.
-----------------------
Technical Analysis:
Now, considering the technical side, with less than five days remaining before the six-month and one-year candles close, I’ll focus on a higher time frame for silver’s analysis. Recently, silver achieved a new all-time high, capturing widespread attention, and many prominent figures are now discussing silver’s potential.
From a classic technical analysis perspective on the six-month time frame, it appears that silver has formed a bullish continuation pattern, specifically a cup and handle pattern, and the recent six-month candle has broken the neckline/resistance zone($50-$34) with strong volume. This suggests that the bullish trend for silver is likely to continue.
From an Elliott Wave perspective, it seems that silver is completing wave 3, potentially within an ascending channel and a Potential Reversal Zone(PRZ) .
I expect that silver, upon entering this Potential Reversal Zone(PRZ) , will undergo a correction. If you’re considering adding silver to your portfolio, it’s wise to wait for that correction, as buying at all-time highs can be riskier due to the strong upward momentum.
What do you think? How far can silver’s bullish trend extend, and what levels might we see in 2026?
💡 Please respect each other's opinions and express agreement or disagreement politely.
📌 Silver/ U.S. Dollar Analyze (XAGUSD), 6-month time frame.
🛑 Always set a Stop Loss(SL) for every position you open.
✅ This is just my idea; I’d love to see your thoughts too!
🔥 If you find it helpful, please BOOST this post and share it with your friends.

Silver Price Surpasses $80 for the First Time.Silver Price Surpasses $80 for the First Time. Why Could This Be a Bearish Sign?
As the XAG/USD chart shows, earlier this morning the price of one ounce of silver reached above $83 for the first time. However, this move was followed by an abnormally sharp reversal to the downside.
Why Did the Silver Price Fall?
On 24 December, we not only outlined the fundamental backdrop but also highlighted that the market was vulnerable to sharp price movements due to reduced liquidity during the holiday period.
Now, as the ATR indicator has surged sharply higher—confirming our assumption—it is worth examining the key chart details that point to emerging bearish signals.
Technical Analysis of the XAG/USD Chart
The previously constructed ascending channel (highlighted in orange) has retained its slope, while the following developments occurred:
→ The silver price surge on 26 December (marked by the arrow), with a bullish gap, doubled the ascending channel.
→ At the open of today’s trading session, the price broke above the upper boundary with another bullish gap (marked by the second arrow).
It is important to note that:
→ The sharp surge in silver prices towards a historic high may have been driven by a shortage of seller liquidity at the opening of financial markets during the final week of the year.
→ The aggressive nature of the subsequent decline towards $75 appears to be a clear sign of a shift in market sentiment.
→ Wide candlesticks indicate heightened activity from so-called “smart money”.
Taking the above into account, we can assume that large long-position holders are actively locking in profits after silver prices have risen by approximately 160% since the beginning of 2025. If this hypothesis proves correct, a break below the lower boundary of the orange ascending channel may follow, potentially leading to further downside movement as early as the first days of 2026.
This article represents the opinion of the Companies operating under the FXOpen brand only. It is not to be construed as an offer, solicitation, or recommendation with respect to products and services provided by the Companies operating under the FXOpen brand, nor is it to be considered financial advice.

Weekly Analysis: XAGUSD 29/12/25The Silver prices finds support at $75.20sh zone and from here if prices are bouncing it will be giving us new highs till $86
But this rally wouldn't be smooth one, will find resistance at 78, 81 also.
On breach of support, prices will slip till $72 to $69

XAGUSD: Silver Awaits a New WaveXAGUSD: Silver Awaits a New Wave
XAGUSD Wave Overview (D1 and H4)
As a trader who has been practicing wave analysis for over ten years, I note that silver is currently forming an interesting structure, where the global picture and local movements are beginning to coalesce into a single scenario.
Chart D1: The global dynamics show the completion of an extended corrective formation. Silver is gradually breaking out of its sideways range, forming the basis for the next impulse. The wave structure indicates that the market is preparing for a phase change and may transition to a more directional movement.
Chart H4: The local pattern confirms the formation of key entry points. Here, the first signs of an impulse are visible, which could be the beginning of a larger wave. The internal structure appears to be the end of a correction and preparation for a move in the direction of the trend.
Main Scenario
After the completion of the corrective phase, a downward impulse sequence is expected to develop. This movement may be accompanied by increased seller activity and a gradual shift in priority to the downside.
Alternative Scenario
If the price holds above local peaks and forms a stable upward impulse structure, the priority will shift to continued growth. In this case, the correction will be considered incomplete, and silver could stage an additional rebound.
Trading Idea
Conservative approach: wait for confirmation of a breakout of key levels and enter with the trend.
Aggressive approach: use local impulses on H4 for earlier entries, but with tight stops.
In both cases, it is important to maintain strict risk management and adjust the plan as new impulses emerge.
Conclusion
Silver is at the transition point between a correction and a new impulse. The wave structure on D1 and H4 provides clear guidelines for action: watch for confirmation of the scenario and act with discipline.
XAGUSD (Silver) – Bullish Continuation Setup | 4HSilver remains in a strong uptrend, printing higher highs and higher lows on the 4H timeframe. Price is holding above key moving averages, showing sustained bullish momentum.
After the recent breakout, I’m looking for continuation toward the next resistance zone.
🟢 Trade Plan:
Buy: 76.425
🔴 Stop Loss: 68.134
🎯 Take Profit: 84.730
📊 Technical Outlook:
Trend structure: Bullish (HH/HL)
Price above dynamic MA support
RSI remains strong, supporting upside momentum
Any pullback toward the MA zone could offer continuation entries
As long as price holds above the trend support, bulls remain in control. A clean break and hold above recent highs should open the path toward the 84.7 target.
⚠️ Not financial advice. Manage risk and wait for confirmation.
