Silver is preparing for a new impulseThere were five strong waves to the upside — a clear impulsive structure. Then the market produced an ABC correction and dropped by nearly 50%.
Yes, the bubble burst.
Yes, buyers at 120 were wiped out 😮
But what comes next?
The market has stabilized.
A first–second wave structure has formed.
Which means one thing — THE TREND MAY CONTINUE.
We are seeing a rebound from the 50% Fibonacci level — a classic signal of correction completion.
The market does not offer such moments often.
A potential third wave is now forming — the strongest, most impulsive, and most profitable phase 🔥
Most importantly — there are entry points with tight stops.
Risk is minimal. Potential is maximal.
❤️ Don’t miss the next wave.
💎 Follow the daily market analysis.
Xagusdtrade

Silver - Here comes the bullrun top!☠️Silver ( OANDA:XAGUSD ) creates its final top now:
🔎Analysis summary:
Silver still remains totally bullish. But Silver also remains totally overextended and the metal is also approaching the final resistance trendline. With all of this short term weakness, this might be the final top on Silver. Just please wait for bearish confirmation.
📝Levels to watch:
$100
SwingTraderPhil
SwingTrading.Simplified. | Investing.Simplified. | #LONGTERMVISION

sliver on pullback#Sliver price await break below 78.1 which will drop the price till 76.6 and 75.21.
Sell stop below 78.1, target 76.6 and 75.2, SL 78.75.
Valid breakout above 80.03 will retest back 81.3.

Silver — False Breakdown Signals Potential Bottom.In my previous Silver analysis, I mentioned that although price had found support around the 73 zone, it was clearly pressing into that level and a breakdown was possible.
That breakdown did happen.
Price pushed below support and dropped toward 64, but what followed is very interesting — and potentially informative for what comes next.
🔎 What the Market Told Us
After the dip to 64:
- price reversed quickly
- reclaimed the 73 support
- and confirmed the move as a false break
False breaks matter because they often trap sellers and shift momentum.
To add to this, the new week opened in the Asian session with a break above the falling trendline, further suggesting that bearish pressure may be fading.
📈 What This Could Mean
These developments increase the probability that a local bottom may be in place, opening the door for a potential leg higher toward:
🎯 90 zone
That becomes the logical upside objective if momentum builds.
📌 Key Zone for Bulls
The area bulls should monitor closely is:
👉 72.50–75.00
This is where buying interest may offer the best structure.
⚠️ VERY IMPORTANT NOTES
Silver is not a forgiving market right now.
1️⃣ Volatility Reality
If Gold is volatile these days, Silver’s volatility is extreme.
Daily swings are enormous...
2️⃣ Stop-Loss Logic
- A technically correct stop sits below 70.
- So a buy around 75 implies roughly a 7% risk.
- That makes this type of trade viable only with:
👉 very low leverage (max. 1:2)
Anything larger becomes gambling.
3️⃣ Risk-Reward Matters
From a pure risk-to-reward perspective, this trade only makes sense if you are targeting:
🎯 90 USD
Without that upside objective, the math simply doesn’t justify the exposure.
✅ Conclusion
Silver may be forming a bottom, but this is still a high-volatility environment.
Good opportunity? Possibly.
Easy trade? Definitely not.
Size small.
Respect volatility.

SILVER (XAGUSD) 4H — Smart Money Continuation Read Description.SILVER (XAGUSD) 4H
— Smart Money Continuation | BOS, Mitigation & Liquidity Roadmap
This Silver (XAGUSD) analysis is the result of deep structure reading, liquidity mapping and smart money execution logic — not random lines or assumptions.
From the left side of the chart, price respected multiple BOS (Break of Structure), confirming a strong bullish market condition. Each BOS was followed by continuation, showing that buyers were in full control and weak sellers were consistently removed from the market.
After forming a clear Higher Low (HL), price expanded aggressively and created a Higher High (HH).
This expansion left behind clean inefficiencies (BISI) and order blocks (OB) — areas where institutions executed large positions and price moved with intention.
Price then returned into the mitigation block, where previous imbalance and liquidity aligned perfectly.
This is not a coincidence — smart money often revisits these zones to rebalance inefficiency before continuing the primary trend.
The repeated SSS (Sell-Side Liquidity) markings show how liquidity was engineered and collected step by step.
Once sell-side liquidity was absorbed, price had no reason to stay low — resulting in strong continuation to the upside.
The roadmap on the chart highlights the logic clearly: • Liquidity is taken first
• Imbalance is revisited and mitigated
• Order blocks act as re-accumulation zones
• After rebalancing, price seeks higher external liquidity
This is not a signal and not financial advice.
It is a story of how price is delivered by smart money, written directly on the chart for those who know how to read it.
Markets don’t move randomly —
they move to fill orders, rebalance inefficiencies, and hunt liquidity.
🧠 Final Thought
If you stop chasing candles and start understanding why price pulls back,
you stop trading emotionally and start trading logically.
👉 Do you agree with this bullish continuation narrative on Silver, or do you see a different liquidity draw?
Drop your perspective in the comments and share this idea if it added value — let’s grow by learning together.

SilverXAGUSD
- Change of Characteristics
- Fair Value Gap
- Demand Zone
- Completed " 12345 " Impulsive Waves and " ABC " Corrective Waves
- Fibonacci Level - 78.60%

XAGUSD ANALYSISThis is one of the strongest moves for the entire history on XAGUSD. Actually, we could see that the growth of the last few weeks has happened because of high short squeeze, people kept shorting this asset, and additionallu most retail felt FOMO.
The reason why XAGUSD was so strong compared to other instruments and kept growing without any corrections is the DXY index which is in a bearish trend and updates new low levels. Everyone understands that Trump is adherent of cheap dollar, right? He is going to place a new chairman at the FED system. It's obvious that a new guy will cut interest rates as quick as possible. In other words, Trump wants to have cheap dollar to borrow more money to cover the USA national debt. This was one of his big promises in the election campaign. So investors started reallocating their capital into more defensive assets like XAUUSD and XAGUSD. The recent correction is a normal situation because there were too many overleveraged traders and the market wanted to punish them for high risks... :)))
I'd already started buying XAGUSD in the spot portfolio, if you have a brokerage account, allocating 10-15% of your deposit in this instrument would be a good investment. The support zone at $70 looks pretty strong, as the price has reacted to this level multiple times since December. So I don’t think it’s likely to break below this zone. It’s essential to keep an eye on price action to see whether bulls will defend this support.. The goal is $130 and higher... That's my own opinion, and if you have any arguments, I'd love to hear them below...

Silver Prices Collapse as the Market Shifts PhaseSilver Prices Collapse as the Market Shifts Phase
According to media reports, the silver market has experienced its largest price drop since 1980.
Notably, it is difficult to identify a single powerful fundamental catalyst that could clearly explain the move from the 29 January high near $120 to today’s low around $72 (approximately −40%). The geopolitical backdrop remains tense, with risks related to Iran, Greenland, Ukraine and other regions still very much in play.
The media point to a cascade of long-position liquidations, a view that aligns with the analytical conclusions of our article “For the First Time In History, the Price of Silver Has Exceeded $115”, published five days ago.
At that time, we:
→ reaffirmed the primary ascending channel and highlighted a surge in volatility during the A→B move from the upper boundary of the channel;
→ suggested that “smart money” was using broad market participation to lock in profits on long positions after an extraordinary rally (more than +200% over the past six months). In Wyckoff terms, this corresponded to a distribution phase.
These assumptions were subsequently confirmed by:
→ a brief push above the A high (the UTAD pattern — Upthrust After Distribution);
→ a sharp increase in bearish pressure. As a result, around the turn of the week, XAG/USD decisively broke not only the channel median but also its lower boundary.
Within the framework of Wyckoff methodology, this price action in silver can be interpreted as follows:
→ “smart money” has completed the distribution of long positions and shifted to selling into the market;
→ retail traders’ positions are being liquidated en masse, accelerating the decline.
In other words, following the Distribution phase, the market has entered the Mark-Down phase. The speed and violence of recent price moves — making timely decision-making particularly difficult — further support this interpretation.
Therefore, even if silver attempts a rebound under the current conditions of extreme oversoldness, any recovery is likely to face a strong resistance zone in the $87.5–95 area. This is where bears previously held a clear advantage while breaking the long-term ascending channel.
This article represents the opinion of the Companies operating under the FXOpen brand only. It is not to be construed as an offer, solicitation, or recommendation with respect to products and services provided by the Companies operating under the FXOpen brand, nor is it to be considered financial advice.

Is silver catching its breath—sideways before another leg up?Silver’s had a strong run since Nov ’25 and now looks ready to cool off. Sideways action seems likely. As long as range 75 holds, the bigger bullish picture stays intact. Bulls would need to clear range 114 to push higher—probably not right away. Let it settle, then watch for the next move.

XAG/USD - A QUICK UPDATE - 30-01-2026XAGUSD - G-Money's short version analysis based purely on technical analysis only, no nonsense or "BS". I do totally ignore any fundamental analysis, technical analysis only
XAGUSD - PATIENCE TIME...
1H DID HIT TP TARGET AND 15m was "excluded" and nicely "manipulated"
Who did enter this trade earlier congratulations! Who missed it... See you next time! ;)
Chart is itself explaining. Kept a "KISS" approach all the way ( "Keep It Simple, Stupid") & beginners friendly... ;)
I do hope that nobody ignoring SL ( Stop Loss) ! Without it, It is a fastest way to loose hard earned money...
;)
Trade safe & don't do "gambling". In the end it never pays, not worth it to risk loose all your $...
PS: above technical analysis is done for the community & educational purpose only! It is not a financial advice. Just share my very own insight to it.

Silver vs. U.S. Dollar: Comprehensive Bullish Retest Evaluation🔥 XAG/USD (Silver vs U.S. Dollar)
⚡ Metals Market Opportunity Blueprint | Day & Swing Trade
📌 Asset Overview
Instrument: XAG/USD — Silver vs U.S. Dollar
Market: Precious Metals
Trading Style: Day Trade / Swing Trade
Bias: Bullish Continuation 🟢
🧭 Trade Plan – Bullish Framework
✔ Multiple pullback retests = acceptance
✔ No aggressive breakout chasing — patience wins
Confirmation Logic:
Shallow pullbacks + higher lows
Momentum cooling without breakdown = continuation setup
🎯 Entry Strategy – Thief Layer Method 🧠
Execution Style: Any Price Entry via Layered Limits
This setup uses a Thief Layering Strategy — deploying multiple buy-limit orders instead of a single entry to manage volatility and reduce emotional execution.
Buy Limit Layers (Example):
90.000
92.000
94.000
👉 You may expand or compress layers based on your own risk profile and execution style.
🚨 Target Zone – High Voltage Area ⚠️
Target: 101.000
This zone acts like a High-Voltage Shock Fence Gate
✔ Historical selling pressure
✔ Overbought risk zone
✔ Liquidity trap potential
💡 Escape with profits before greed kicks in.
🛑 Stop Loss – Thief Risk Control
Protective SL: 89.000
⚠️ Capital protection always comes before profit hunting.
⚖️ Risk Disclaimer (OG Rule)
Dear Ladies & Gentlemen (Thief OGs),
This plan does not force you to use only my TP or SL.
Trade management is your responsibility — secure profits when the market pays you.
🌍 Live Fundamental & Economic Drivers (Monitor Actively)
Silver is highly sensitive to macro-economic shifts, especially USD-driven flows and global risk sentiment:
🔹 U.S. Dollar Strength / Weakness
Softer USD → Silver gains tailwind
Strong USD → Short-term pullbacks, not trend reversal
🔹 U.S. Interest Rate Expectations
Falling or stable rate outlook supports non-yielding assets like Silver
Hawkish tone increases volatility, not immediate bearishness
🔹 Inflation Expectations
Rising inflation keeps Silver attractive as a value hedge
Sticky inflation = structural demand support
🔹 Global Manufacturing & Industrial Demand
Silver demand remains tied to electronics, solar, and industrial usage
Expansion signals strengthen medium-term bullish bias
🔹 Upcoming High-Impact Events to Track
U.S. inflation data
Central bank policy signals
Employment & growth indicators
(Volatility expected — execution discipline required)
🔗 Related Pairs to Watch (Correlation Watchlist)
💵 TVC:DXY (U.S. Dollar Index)
Inverse relationship
Dollar weakness = Silver strength confirmation
OANDA:XAUUSD (Gold vs U.S. Dollar)
Silver often follows Gold’s directional bias
Gold strength adds confidence to Silver longs
📈 US Real Yields
Falling real yields support precious metals
Rising yields may cause pullbacks, not immediate reversals
📊 S&P 500 / Risk Sentiment
Risk-off flows often benefit precious metals
Sudden equity stress can accelerate Silver upside
🧠 Final Thought
This is not a breakout chase — it’s a controlled accumulation play using structure, patience, and layered execution.
📌 Trade smart. Scale wisely. Protect capital first.
🔥 If you see the structure, you’re already ahead of the crowd.

#SILVER(XAGUSD): Another Big Buy In Making, 2026 We Are Ready! **SMC|ICT Based Analysis On Silver (XAGUSD)**
Dear Traders,
We extend our best wishes for the upcoming New Year.
🔺Today, we will analyse Silver (XAGUSD). The month of December typically presents reduced market liquidity and volume due to numerous holidays. The market initiated with a positive liquidity gap at $83.50, subsequently experiencing a significant decline. The price descended to $70.44 and is currently trading at $71.51. This substantial sell-off indicates a high probability of further price depreciation. We anticipate the price to fall within the range of $68 to $66.
🔺Entering a position within our identified key levels may prove profitable, with take-profit targets established at the following key levels: the first at $75, the second at $78, and the swing key level at $85. These levels should be utilized as take-profit objectives. For stop-loss placement, we suggest setting it at $66, or at your discretion.
🔺We wish you a prosperous New Year and hope this year fulfils your aspirations. We sincerely appreciate your continued support throughout the years.
Team SetupsFX_

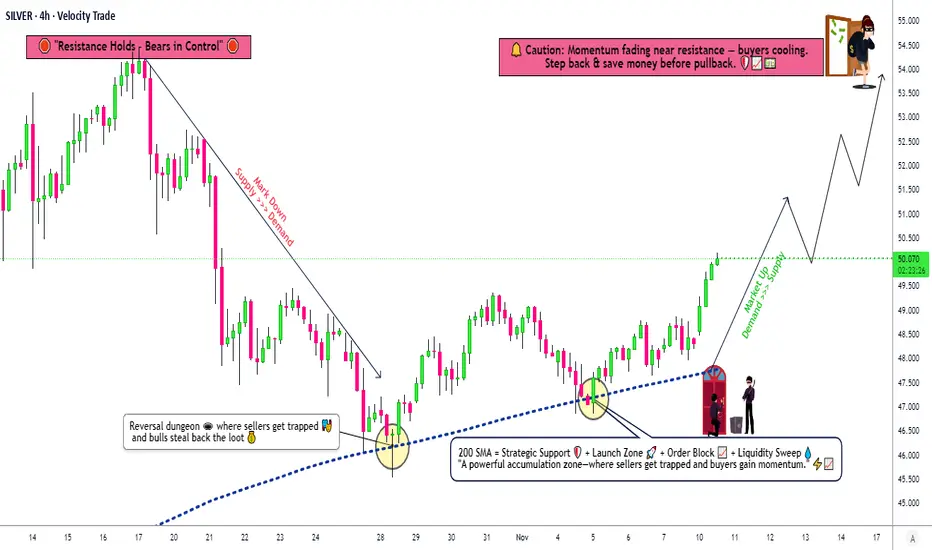
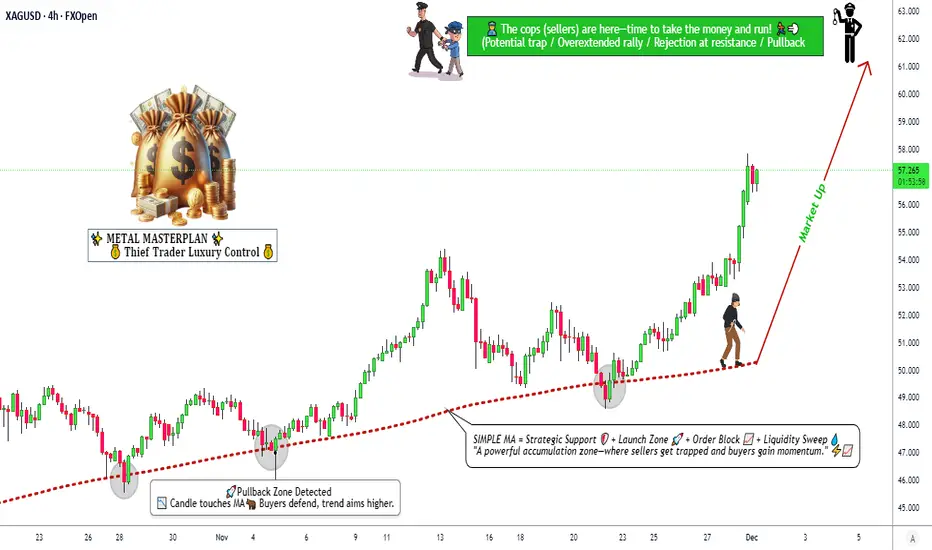
XAG/USD Key Zone Reaction – Are Bulls Ready to Take Control?🥈 XAGUSD: SILVER VS US DOLLAR 💰
Metals Market Opportunity Blueprint | Swing Trade Analysis
📊 MARKET STRUCTURE & SETUP
✅ Current Price Action: $48.34 | 52-Week Range: $28.16 - $54.50
✅ Technical Trend: Bullish Bias Confirmed
✅ Setup Type: Double Pullback Retest of 200 SMA
🎯 THE THIEF STRATEGY: LAYERED ENTRY APPROACH
This is NOT a single entry point strategy. We employ the THIEF LAYERING METHODOLOGY — multiple limit orders positioned at strategic support zones to maximize entry efficiency and reduce average entry price.
📍 ENTRY LAYERS (Buy Limit Orders):
Layer 1: $48.000 ⭐ (Immediate Support)
Layer 2: $48.500 ⭐ (Pullback Zone)
Layer 3: $49.000 ⭐ (Resistance Break)
Layer 4: $49.500 ⭐ (Extended Support)
💡 Pro Tip: You can increase/decrease layers based on your risk tolerance and position size. Accumulate, don't dump!
🛑 STOP LOSS MANAGEMENT
📌 Thief Original SL: $47.000
⚠️ This is MY suggested level based on technical structure
🔴 IMPORTANT: Dear Ladies & Gentlemen (Thief OG's) — Set YOUR OWN stop loss based on YOUR risk profile
💪 This is YOUR money, YOUR risk, YOUR decision
Adjust SL based on your strategy, account size, and risk/reward ratio
🚀 PROFIT TARGET STRATEGY
🎪 Target Zone: $54.000
📈 Technical Basis: 200 SMA acts as strong dynamic resistance
⚡ Market Structure: Overbought territory warning
🔔 Trap Alert: Potential sell-side liquidity trap at resistance
⚠️ Target Notes:
🔴 IMPORTANT: Dear Ladies & Gentlemen (Thief OG's) — Set YOUR OWN take profit target
📊 Don't just copy my TP blindly — analyze price action yourself
💼 You earn the profits, you manage the exit — YOUR choice, YOUR reward
Consider trailing stops or partial profit-taking strategy
🔗 CORRELATED PAIRS TO MONITOR (Key Dollar Pairs)
1️⃣ TVC:DXY (US Dollar Index)
Correlation: INVERSE ↔️ As DXY strengthens, XAG/USD weakens
Why Monitor: Strong dollar headwind for silver prices
Watch Level: DXY above 105.00 = bearish for silver
Strategy: If DXY rallies, reduce silver long positions
2️⃣ $XAU/USD (Gold vs Dollar)
Correlation: POSITIVE ✅ Silver follows gold's lead
Why Monitor: Gold is the "big brother" in precious metals
Watch Level: If gold breaks $2,100, silver likely follows
Strategy: Gold weakness = caution on silver longs
3️⃣ FX:EURUSD (Euro vs Dollar)
Correlation: INVERSE ↔️ Weak dollar = strong euro
Why Monitor: Dollar weakness supports precious metals
Watch Level: EURUSD above 1.1200 = bullish for silver
Strategy: Strong euro environment = tailwind for XAG
4️⃣ FX:USDJPY (Dollar vs Japanese Yen)
Correlation: INVERSE ↔️ Dollar weakness supports risk-on sentiment
Why Monitor: Risk appetite indicator (yen often "fear" currency)
Watch Level: USDJPY below 145.00 = risk-on (silver bullish)
Strategy: Lower USDJPY = better environment for commodities
5️⃣ SP:SPX / S&P 500 Index
Correlation: POSITIVE ✅ Risk-on markets support commodities
Why Monitor: Stock market rallies often lift precious metals
Watch Level: SPX new highs = bullish momentum for silver
Strategy: Market strength = broader bullish sentiment
📋 TRADE CHECKLIST BEFORE ENTRY
✅ Price action confirms double pullback on 200 SMA
✅ DXY showing weakness or neutral bias
✅ XAU/USD supporting bullish thesis
✅ No major macro events in next 4-6 hours
✅ Volume confirmation on breakout
✅ Risk/Reward ratio minimum 1:2
✅ Position size = % of account (YOUR decision)
⚡ KEY TRADING RULES
Layering ≠ Averaging Down Losers
Build positions at PRE-PLANNED levels only
Don't add to losing positions outside your strategy
Stop Loss is Sacred
NO moving stops to breakeven without reason
Protect capital first, chase profits second
Take Profits Strategically
Partial exits: Scale out at resistance zones
Don't go all-in, don't take all-out at once
Dollar Monitoring is Mandatory
Strong DXY = reconsider position
Weak DXY = stay long with conviction
Risk Management Over Everything
Your SL & TP = your rules
No trade is worth emotional decision-making
Strong Bullish Structure Developing in Silver🚀 XAG/USD (SILVER) Swing Blueprint | Bullish Structure Intact | Key Levels Mapped! ⚔️
🎯 Metals Market Opportunity: Silver (XAG/USD) Swing Trade Setup
📈 Direction: Bullish | Swing Trade
🏷 Asset: XAG/USD - Silver vs. U.S. Dollar
⚖️ Core Thesis: Silver is building a potential swing bullish structure, aiming for a significant resistance zone. This plan outlines the key framework.
📊 Trade Plan (Blueprint)
✅ Entry Zone: Consider entries on pullbacks or strength confirmation. (Any price level entry - discipline is key).
🛑 Stop Loss (Risk Management):
"This is thief SL @ 54" 💎
Dear Traders (The OG Crew), 👊
This is my protective level. YOU MUST adjust your SL based on YOUR OWN risk tolerance & strategy. I do not recommend using only my level. Manage your capital wisely.
🎯 Target Zone: @ 62 Area.
This aligns with a strong historical resistance + potential overbought/trap zone. 🪤 The strategy is to "escape with profits" as price approaches.
Note: This is my target. Take profits based on your own analysis and risk-reward goals.
🔍 Related Pairs & Market Correlations (Must-Watch) 🔗
Monitoring these pairs provides context for Silver's move:
🦅 TVC:DXY (U.S. Dollar Index):
Key Point: INVERSE correlation. A weaker TVC:DXY typically boosts commodities priced in USD, like Silver. Watch for DXY breakdowns for added Silver bullish confirmation.
🟡 XAU/USD (Gold):
Key Point: STRONG positive correlation. Gold is the leader. A strong, bullish Gold market often drags Silver higher (and vice-versa). Silver's moves can be more volatile ("Gold on steroids").
📈 US 10-Year Treasury Yields / TVC:TNX :
Key Point: General inverse relationship. Rising real yields can pressure non-yielding metals. Watch for yield pullbacks that may relieve pressure on Silver.
⛽️ Crude Oil ( BLACKBULL:WTI / ICMARKETS:XBRUSD ):
Key Point: Inflation/Commodity Sentiment Gauge. Rising oil can signal broader commodity strength and inflation fears, which can benefit Silver as a real asset.
📊 Copper ( CAPITALCOM:COPPER ) & AMEX:GDX (Gold Miners ETF):
Key Point: Industrial / Risk Sentiment. Copper confirms industrial demand outlook. AMEX:GDX strength confirms bullish precious metals sector momentum.
💎 Final Notes
This is a blueprint, not financial advice.
You are the captain of your own capital. 🧭
Always use proper position sizing.
Markets are dynamic—always monitor for structure breaks.
Let's get this bread... responsibly! 🥖
✅ Like & Follow if you find this detailed blueprint valuable! It helps the idea reach more traders. 💡
#SILVER #XAGUSD #TradingSetup #SwingTrading #Commodities #PreciousMetals #Forex #TradingView #DXY #GOLD #XAUUSD #Analysis
SilverXAGUSD
- Completed " 12345 " Impulsive Waves
- Change of Characteristics
- Fibonacci Level - 38.20% / 50.00%
- Break of Structure
- RSI - Divergence

Silver Buy Trading Opportunity SpottedH1 - Strong bullish move
No opposite signs
Until the two support zones hold I expect bullish continuation
👉 If you enjoy this analysis, please Like, Follow, and Support the profile! Your engagement motivates us to share more quality setups.


Silver - This metal is blowing up now!💣Silver ( OANDA:XAGUSD ) is rallying even higher:
🔎Analysis summary:
Just a couple of months ago, we witnessed another bullish break and retest on Silver. It was quite obvious that Silver will rally accordingly and just recently, we experienced another +150% rally. However, looking at the higher timeframe, Silver is still not done.
📝Levels to watch:
$100
SwingTraderPhil
SwingTrading.Simplified. | Investing.Simplified. | #LONGTERMVISION

SilverXAGUSD
- Completed " 12345 " Impulsive Waves and " ABC " corrective waves
- Break of Structure
- Consolidation Phase
- Bearish Channel as an corrective pattern in Short Time Frame
- Fair Value Gap

Silver — Strong Bull Trend, but Is the Correction Really Over?After the explosive rally to a new all-time high near the 84 zone, OANDA:XAGUSD experienced a sharp correction, dropping nearly 15,000 pips — a natural reaction after such an extended move.
Buyers eventually regained control just above the 70 zone, where the market established a solid floor.
However, the first rebound produced a lower high, and the following high was also lower — which currently shapes what appears to be a potential descending triangle structure (still unconfirmed at this stage).
❓ Key Question: Is the Correction Finished?
From a long-term perspective, there is no doubt about the dominant trend — Silver remains strongly bullish over the macro horizon.
But the short-term issue remains:
👉 Has the correction already ended, or is there more downside risk ahead?
Right now, the answer depends on two critical levels.
⚖️ Decision Levels to Watch
1️⃣ 74 Resistance Zone
A clean breakout above 74 would
✔️ invalidate the current corrective structure
✔️ confirm bullish continuation
✔️ open the door toward further upside extensions
2️⃣ 70 Support Zone
A breakdown below 70 would
⚠️ strengthen the descending-triangle scenario
⚠️ expose Silver to a deeper correction
➡️ potentially toward the 63 zone
📌 Trading Stance for Now
Given today’s low-liquidity environment, the prudent approach is:
👉 wait for confirmation rather than forcing a position
Price action around 70 and 74 will likely provide the next major directional clue. Until then — patience remains the best strategy. 🚀

SilverXAGUSD
- Demand Zone
- Completed " 12345 " Impulsive Waves
- Break of Structure
- Descending Triangle as an corrective pattern in Short Time Frame
- Fair Value Gap

XAG/USD Bullish Structure Signals Upside Continuation!🔥 XAG/USD — SILVER vs U.S. DOLLAR
📊 Metals Market Opportunity Blueprint (Day / Swing Trade)
🧭 Market Bias
🟢 BULLISH PLAN CONFIRMED
Silver continues to show strength with bullish momentum supported by macro and metals-sector flows. Volatility expansion favors trend continuation traders.
🟢 Trade Execution Plan
📌 Entry:
✅ Buy at any price level
➡️ Suitable for scaling, cost-averaging, or momentum entries based on individual strategy.
🛑 Risk Management
🔻 Stop Loss: 73.000
⚠️ Dear Ladies & Gentlemen (Thief OG’s),
This SL is not mandatory. Adjust according to your own risk management & position sizing.
Trading involves risk — manage capital wisely.
🎯 Profit Objective
🎯 Target: 80.000
📍 Strong resistance zone detected
📍 Overbought conditions possible near highs
📍 Potential correction & liquidity trap expected
🚨 Kindly secure profits near resistance levels.
⚠️ TP level is guidance only — adapt exits based on market behavior and your strategy.
🔗 Related Markets to Watch (Correlation Focus)
💵 U.S. Dollar Index (DXY)
📉 Weakening USD = Bullish for Silver
📈 Strong USD = Headwind for XAG/USD
🟡 XAU/USD (Gold vs USD)
Silver often follows Gold’s directional bias
Gold strength usually confirms Silver upside momentum
📈 US10Y Treasury Yields
Falling yields → Supports precious metals
Rising yields → Pressure on non-yielding assets like Silver
🛢️ WTI Crude Oil (USOIL)
Inflation expectations linked to energy prices
Rising oil can indirectly support Silver as an inflation hedge
🌍 Fundamental & Economic Factors to Watch
🏦 Federal Reserve Policy
Rate cut expectations → Positive for Silver
Dovish tone weakens USD, boosting metals
📊 U.S. Inflation Data (CPI / PCE)
Higher inflation → Silver demand as a hedge
Cooling inflation may slow momentum temporarily
🏭 Industrial Demand Outlook
Silver has strong use in solar panels, EVs, electronics
Global manufacturing recovery supports long-term demand
🌐 Geopolitical & Risk Sentiment
Market uncertainty → Safe-haven inflows into metals
Risk-off environments favor Silver accumulation
🧠 Trader’s Note
📌 This is a market opportunity blueprint, not financial advice.
📌 Trade responsibly, manage risk, and adapt to live market conditions.

Silver’s 2025 Explosion — How High Can It Go?In 2025, Silver ( OANDA:XAGUSD ) has experienced a remarkable surge, making it one of the most notable assets of the year. As we approach the end of 2025, I’ve decided to analyze silver to see how far its bullish trend might continue. So, stay with me as we delve into the reasons behind silver’s rise and explore how far this upward momentum could go.
Let’s begin by looking at the fundamental factors driving silver’s increase in 2025. After that, we’ll move on to the technical analysis.
Fundamental Drivers Behind Silver’s Massive 2025 Rally:
Structural Supply Deficit — Multi‑year deficits draining inventories, tight physical market.
Strong Industrial Demand — Solar, EVs, semiconductors & data centers consuming silver at record levels.
Rate Cut Expectations — Anticipated Fed easing lifts non‑yielding assets like silver.
Safe‑Haven Flows — Geopolitical risk, inflation, and a softer dollar boosting precious metals demand.
Liquidity & Momentum — Smaller market vs gold( OANDA:XAUUSD ) amplifies swings, attracting speculators.
Silver has surged ~ 150–165% YTD , setting fresh all‑time highs as both an industrial metal and investment hedge.
-----------------------
Technical Analysis:
Now, considering the technical side, with less than five days remaining before the six-month and one-year candles close, I’ll focus on a higher time frame for silver’s analysis. Recently, silver achieved a new all-time high, capturing widespread attention, and many prominent figures are now discussing silver’s potential.
From a classic technical analysis perspective on the six-month time frame, it appears that silver has formed a bullish continuation pattern, specifically a cup and handle pattern, and the recent six-month candle has broken the neckline/resistance zone($50-$34) with strong volume. This suggests that the bullish trend for silver is likely to continue.
From an Elliott Wave perspective, it seems that silver is completing wave 3, potentially within an ascending channel and a Potential Reversal Zone(PRZ) .
I expect that silver, upon entering this Potential Reversal Zone(PRZ) , will undergo a correction. If you’re considering adding silver to your portfolio, it’s wise to wait for that correction, as buying at all-time highs can be riskier due to the strong upward momentum.
What do you think? How far can silver’s bullish trend extend, and what levels might we see in 2026?
💡 Please respect each other's opinions and express agreement or disagreement politely.
📌 Silver/ U.S. Dollar Analyze (XAGUSD), 6-month time frame.
🛑 Always set a Stop Loss(SL) for every position you open.
✅ This is just my idea; I’d love to see your thoughts too!
🔥 If you find it helpful, please BOOST this post and share it with your friends.
