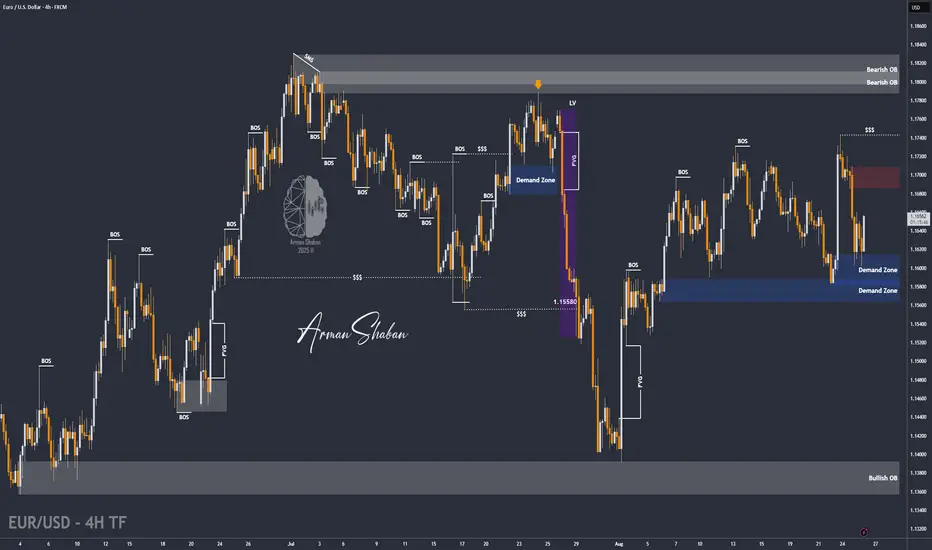
EUR/USD | EUR/USD Holding 1.16 – Eyes on 1.17 Next! (READ)By analyzing the EUR/USD chart on the 4-hour timeframe, we can see that the price is currently trading around 1.165 and has so far managed to hold above the 1.16 support zone. Based on the current trend and momentum, I expect a potential bullish move toward higher levels, with targets above 1.17.
All the key supply and demand zones are marked on the chart, so keep a close eye on the price reaction around these critical levels!
Please support me with your likes and comments to motivate me to share more analysis with you and share your opinion about the possible trend of this chart with me !
Best Regards , Arman Shaban
Xauusd(w)
Gold XAUUSD Intraday Analysis 28.08.2025Gold volume has been shrinking over time, signaling reduced momentum. The price is approaching the 3403–3405 resistance zone, which aligns with a well-respected trendline. This area can serve as a potential reversal point for a short setup.
If price rejects this zone, downside movement toward 3384 becomes likely. A stop loss above 3414 protects against invalidation of the idea.
Trading Plan (Educational Idea)
Entry Zone (Sell): 3403 – 3405
Stop Loss: 3414
Take Profit: 3384
Notes.
Confirmation is required at the resistance (such as wick rejection, bearish close, or momentum shift).
Invalidation occurs on a sustained break above 3414.
This is a trendline-based counter-trade setup with defined risk.

The gold rally is not over yet, stabilizing at 3400 is the keyThis week, Trump once again severely undermined the independence of the Federal Reserve. He has been attacking Chairman Powell for months and now threatens to fire Fed Governor Tim Cook. His actions are all part of his quest to pressure the Fed into cutting interest rates, ultimately forcing his will and ultimately achieving a rate cut, perhaps even a larger one.
Influenced by the Fed's independence and the expectation of rate cuts, gold prices have continued to rise this week, approaching the high of 3,400 points.
I personally believe that as long as gold doesn't fall below 3,350, it's only a matter of time before it breaks above 3,400.
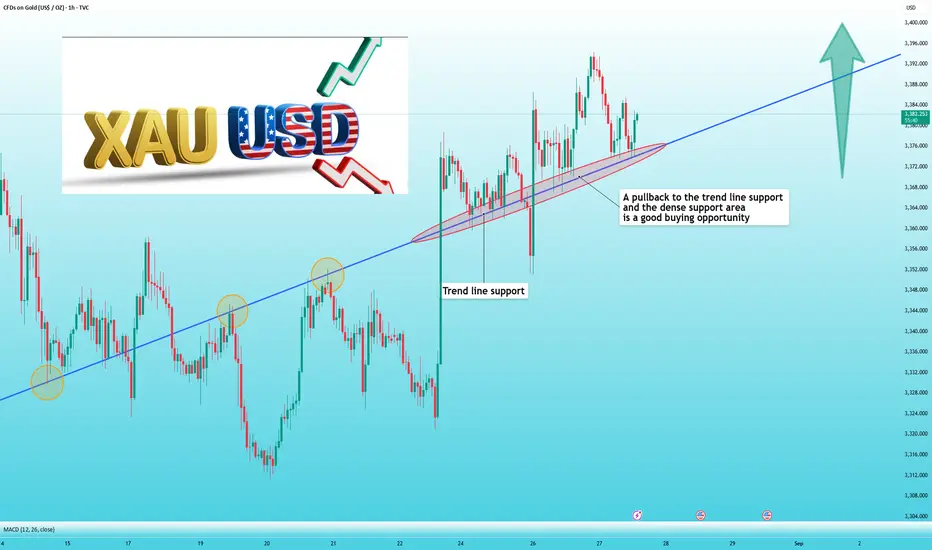
From the 1-hour chart, we can clearly see that gold is steadily rising, supported by the trend line. Buying on a pullback to the trend line is a good opportunity, with a take-profit and stop-loss in place, presents a significant profit opportunity.
Currently, the optimal buying range for gold is between 3,365 and 3,375 OANDA:XAUUSD , with a target price of $10-20 and a stop-loss of $10.
📣If you have different opinions, please leave a message below to discuss
XAU/USD chart Pattern Bullish ....XAUUSD (Gold) Bullish Setup 🌟
Gold has regained strength and is holding firm above the key support area, signaling fresh buying momentum. Price action confirms a bullish structure with strong demand from lower levels.
✅ Entry Point: 3407 (Buy Zone)
🛑 Stop Loss: 3399 (Tight risk control below recent structure)
🎯 Target Point: 3440 (Upside objective)
🔺 Main Resistance: 3440 → Critical level where buyers must break through for further continuation.
📈 Bullish Bias:
As long as price sustains above 3399, the bullish momentum remains valid. A clean break and close above 3440 resistance will unlock the next wave of upward potential, attracting more buyers into the market.
---
✨ Smart risk-reward with a tight stop and defined resistance target makes this a high-probability bullish setup.

Gold Breakout at $3,405, Next Stop $3,440📊 Technical Analysis of XAUUSD (1H)
Gold has been in a gradual uptrend over the last few sessions, with higher lows consistently forming. The structure suggests bullish momentum is building, especially after reclaiming the $3,378–$3,389 zone, which previously acted as resistance and has now turned into support.
At present, price is trading around $3,404–$3,405, attempting to break higher. The green box on the chart indicates a long trade setup with a favorable risk-to-reward ratio.
Key Observations:
• Support Levels:
Immediate support lies around $3,389–$3,378, followed by deeper supports at $3,352 and $3,329. These are key zones where buyers may step in if retracements occur.
• Resistance Levels:
The next major resistance is projected at $3,440, which is also the target zone highlighted on the chart. If bulls push past this level, momentum could extend further, though $3,440 remains the near-term cap.
• Candle Structure:
Price has broken above the minor consolidation range between $3,389–$3,405. If this breakout sustains, the bullish case strengthens toward $3,440.
• Volume & Momentum:
Recent price action shows strong breakout candles supported by follow-through. This indicates buyers are currently in control, and sellers are being absorbed at resistance levels.
________________________________________
🟢 Bullish Trade Setup (XAUUSD 1H)
• Entry Zone: Around $3,404–$3,405 (current breakout area)
• Stop Loss: Below $3,389 (recent structural support)
• Target 1: $3,440 (major resistance level)
• Risk/Reward: Approx. 1:2
________________________________________
📌 Trade Management
• Partial Profit Booking: At $3,440, it’s wise to secure at least 50% profits, as this is a strong resistance where sellers may re-enter.
• Trailing Stop: Once price moves decisively above $3,420, adjust stop-loss to breakeven at $3,404. If the rally extends beyond $3,440, trail stops under each higher low to capture extended gains.
________________________________________
✅ Summary
XAUUSD on 1H is showing strong bullish momentum after reclaiming critical support zones. The breakout above $3,405 sets up a clean run toward $3,440. Trade management should focus on partial profit booking at resistance and using trailing stops to ride any extended move while locking in gains.

XAUUSD Q4 is Coming; September Reset for Gold Traders
Summer is leaving its mark already. For some, it’s the heat of missed trades. For others, it’s the frustration of chop: false breaks, liquidity traps, the kind of price action that tests your patience more than your strategy. Another batch of traders comes back refreshed from their holidays...
But every year, like clockwork, September arrives.
And this month is different.
It’s the reset button. Liquidity returns as big players come back from summer. Volumes rise. Market makers shift gears. What looked like a bit of chaotic moves in July and August begin to make sense in September, because the context changes.
1️⃣ Why September Matters
Think of it as the gateway to Q4.
It’s not just “another month”, but the bridge between the summer ranges and the final push of the year.
• Institutions reposition.
• Central banks set the tone for year-end.
• Physical demand from India and China accelerates into festivals and holidays.
This is when the market stops drifting and starts building direction.
2️⃣ Q4: The Final Act
October to December is rarely quiet. It’s when portfolios get rebalanced, reports closed, and big narratives find their conclusion.
For Gold, Q4 often means:
• Volatility with a purpose. Not just random spikes, but moves that make a mark.
• Trends that can define the whole year. One or two big swings can make all the difference.
• Liquidity sweeps early, momentum later. September often tests both sides before revealing the path.
3️⃣ The Psychology of the Season
This is where traders win or lose more in their minds than on their charts.
• Patience over FOMO. September rewards those who wait for clarity.
• Confidence over ego. Don’t chase every move to “make up” for the passed summer.
• Preparation over reaction. Mark your levels, define your risk, and let the market come to you and your reaction zones.
It’s not about catching the first candle of the move. It’s about being ready for the real trend when it reveals itself.
4️⃣ How to Prepare
• Treat September as a filtering month. Don’t overtrade; study how XAUUSD reacts around key liquidity pools.
• When October–November come, be ready to scale into clean moves.
• In December, remember that thinner liquidity can still hide powerful setups — but choose them carefully.
✨ A Note for Serious Traders
The edge isn’t in chasing signals, it’s in building structure and a sure plan with a few great trades/week. Every trader stepping into Q4 should have:
• A clear bias based on higher timeframes, then move to the lower ones.
• Defined key levels & reaction zones marked in advance. Do your homework on the charts.
• Discipline to avoid impulsive trades and wait for price to come to the plan.
That’s how you survive September and thrive in Q4. Outlooks and daily bias updates — when done properly — bring in good/great results and fewer SL.
Let's get ready for XAUUSD fall trading!
If this article helped you today and brought you more clarity:
Drop a 🚀 and follow us✅ for more trading ideas and trading psychology.

28/08/25 Gold Swing LevelsSet your alerts. Watch the 5 mins (1 min if price spiking)
28/08/25 levels are marked
Always, price action determines trade.
Trade parameters
Entry on 5 min chart
Sl: 20-40pips
TP: 2-4x SL

XAUUSD Holds Above Pivot — Bulls Target $3,401 NextGold – Live Update
Bullish Trend Holds Above Pivot
Gold reached our projected target around 3,392 as mentioned in the previous idea.
Currently, the price is trading above the 3,374 pivot line, maintaining bullish momentum.
🔹 Technical Outlook
✅ As long as price holds above 3,374, the bullish trend should continue toward 3,384 → 3,401 → 3,412.
⚠️ A move below 3,374 would trigger a correction to 3,363, with deeper downside toward 3,350.
🔹 Key Levels
Pivot: 3,374
Resistance: 3,384 – 3,401 – 3,412
Support: 3,363 – 3,350
✅ Summary:
Gold continues to respect bullish momentum above the pivot. Watch 3,374 as the decision zone — holding above favors continuation higher, while a break below shifts focus to 3,363 and 3,350.
previous idea:

GOLD Still Very Bullish , 2 Chances To Buy And Get 200 Pips !Here is My 15 Mins Gold Chart , and here is my opinion , we finally above 3377.00 and we Still Not have a 4H Candle closure above it but we have a Perfect Breakout and this give us a very good confirmation , so we have a good confirmation now to can buy from 2 places , first one and best one for me will be 3377.00 , we need the price to go back and retest it and give us a good bullish price action and then we can enter , or if you a aggressive trader you can enter from 3381.00 cuz we have a small double bottom reversal pattern so we can enter from neckline also . we can targeting 100 to 200 pips . if we have a daily closure below this area this mean this idea will not be valid anymore .
Reasons To Enter :
1- Perfect Touch For The Area .
2- Clear Bullish Price Action .
3- Bigger T.F Giving Good Bullish P.A .
4- The Price Take The Last High .
5- Perfect 15 Mins Closure .
6- Small Reversal Pattern .

We are ready for XAUUSD sellXAUUSD holding the Rangebound of 3380-3400.Gold is fundamentally critically bullish and delivered our 3400 mark!!
What possible scenario we have?
• I'm expecting market has to fall to the Base of rising channel atleast 3365-3360 area.
My sell area will be 3405-3408 previous High watch H4 for confirmation.
3380 then 3360 are my Targets.
• if H4-H1 candle closes above 3410 then I will be sidelines till 3420 and our selling will be invaild
All the entires should be taken once all the rules are applied

XAUUSD: Short-Term Decline Awaiting a Correction?XAUUSD is currently in a short-term downtrend, and the chart suggests that the price could continue to decrease if resistance levels are not broken. The short-term target is 3,362.30.
Technical Analysis: XAUUSD is trading below the resistance level at 3,403.70. If it remains below this level, the next targets will be 3,362.30.
Fundamental Analysis: Strong economic data from the U.S., particularly the preliminary quarterly GDP, lower-than-expected jobless claims, and a higher-than-expected core PCE index, all support the U.S. dollar. As the USD strengthens, the demand for gold decreases, pushing the price of gold lower.
Trading Strategy: Open a sell order when the price remains below 3,403.70, with targets at 3,362.30. Place a stop-loss above the 3,403.70 resistance level to protect the trade.
With both technical and fundamental factors supporting the bearish trend, XAUUSD may continue its short-term decline.

Trading Strategy: Sell or Buy?Hello, it’s great to see you again! Let’s take a look at OANDA:XAUUSD today.
By the end of the previous session, gold continued to gain strong upward momentum, with the precious metal climbing as high as $3,399. At the time of writing, the bullish drive remains intact, with price trading around $3,385.
The gold market is witnessing safe-haven demand amid rising concerns over the independence of the U.S. Federal Reserve, following recent harsh criticism of Fed Chair Jerome Powell by President Trump.
Currently, traders and investors are eagerly awaiting the PCE Price Index, set to be released on Friday. Personally, I expect this will be positive news for gold.
Technical outlook : The bullish momentum is strong and well-supported. However, price is approaching a critical resistance level at $3,400 while forming a wedge pattern. As the wedge narrows, a breakout becomes more likely. I expect a short-term pullback before the uptrend resumes.
What do you think about XAUUSD? Share your thoughts in the comments!

XAUUSD: 500 Pips Gold Trading Strategy!Hi everyone, what’s your view on OANDA:XAUUSD ?
Gold staged a sharp reversal after its earlier decline and climbed to fresh weekly highs above $3,370 on Friday. The move was fueled by a steep drop in US 10-year Treasury yields following Fed Chair Jerome Powell’s dovish remarks at the Jackson Hole Symposium, which boosted XAU/USD higher. At the moment, price is consolidating around $3,365.
From a technical perspective, indicators along with the 34 and 89 EMA continue to point to an uptrend. Buying opportunities could arise if price retests support levels or breaks above $3,380. Should Fibonacci levels at 0.5 and 0.618 hold, the upside target could extend toward $3,413. As long as gold stays above its key supports, the medium-term bullish momentum remains intact.
What about you — do you agree with my outlook? Feel free to share your thoughts so we can discuss further.
Good luck!

XAUUSD Short: Reversal Expected from the Supply ZoneHello, traders! The price auction for XAUUSD has been consolidating for an extended period within a large symmetrical triangle. This pattern was defined by key pivot points, establishing the upper supply line and the lower demand line. This phase of balance saw volatility contract significantly as the market approached the apex of the formation, building energy for a decisive move.
Currently, this state of equilibrium has been resolved with a bullish breakout. XAUUSD has pushed above the descending supply line and has completed a retest, confirming the line as new support. This bullish price action is now driving the auction upwards, directly towards the major horizontal supply zone, which begins at the 3400 level.
The primary scenario anticipates that this breakout is a final exhaustive move into a major resistance area. The rally is expected to fail upon entering the 3400 - 3410 supply zone. A confirmed rejection here would suggest a 'bull trap' has occurred, likely initiating a sharp reversal. The take-profit for this scenario is therefore set at 3340 points, targeting the recent breakout area. Manage your risk!

XAU/USD Intraday Plan | Support & Resistance to WatchGold is trading around $3,400, pushing higher after reclaiming the $3,386 level, with the next target at $3,406. A clean break and sustained hold above $3,406 would open the path toward $3,422.
On the downside, failure to clear resistance could trigger a pullback into the $3,386 support, with deeper weakness exposing $3,363 and the $3,347–$3,328 support zone.
📌Key Levels to Watch
Resistance:
$3,406
$3,422
Support:
$3,386
$3,363
$3,347
$3,328
🔎 Fundamental Focus – Thursday, Aug 28
Today’s focus is on U.S. Prelim GDP and Unemployment Claims, both high-impact releases likely to move gold. Pending Home Sales also on the calendar.
⚠️ Volatility expected — watch for sharp moves and possible fakeouts around release times.

Gold fluctuates upward "as steady as a ladder"!Gold has been fluctuating upward overall this week. While the daily trend appears stagnant, it maintains good continuity, with gradually higher lows and continuously refreshing highs, forming a typical step-up structure. Based on the current trend, Mr. Weng recommends a low-to-long strategy as the primary strategy for the day. Referring to the market performance of the previous three days, daily morning trading typically sees brief, rapid fluctuations followed by a period of repeated price adjustments. Fluctuations during the Asian and European trading sessions are relatively limited, remaining range-bound around $10. The true main upward trend often erupts in the evening hours. Therefore, intraday trading should focus on the extent of the morning market adjustments and the extent of the retracement. It is safer to place long positions around the US market open. Entering the market too early during the daytime market will result in a prolonged holding period. For specific short-term trading, it is important to monitor the extent of retracements during the Asian session. Historical data shows that the Asian session's retracement lows often constitute the daily lows. We recommend capitalizing on these retracement lows to seize long opportunities around the US market open. Currently, we should prioritize the support level of the 3380-3365 area. If the actual retracement during the Asian session is smaller than expected, we should adjust our entry point accordingly.

Gold Setup: Bearish Rising Wedge Signals Imminent ReversalHello everyone, I'm back with the latest update on OANDA:XAUUSD !
On the H1 chart, we can see a "Bearish Rising Wedge" pattern forming, signaling a potential downtrend. After a strong rally, gold has continued to create higher highs, but buying momentum is weakening, indicating a divergence between price and volume in the market.
This rising wedge pattern often leads to a reversal, and if gold fails to break through the important resistance at 3,400 USD, the chances of a sharp decline are high. The next support levels around 3,372 and 3,368 USD will be key areas to watch. If these levels are broken, the downtrend will be further confirmed.
Looking at the technical factors, as selling pressure increases, the price could decline even further. This presents an opportunity for traders to consider short positions as the market is likely heading into a significant correction.
What do you think about XAUUSD? Share your thoughts in the comments!

3400, the upper edge of the triangle, is gold long or short?#XAUUSD OANDA:XAUUSD
I reminded you yesterday not to chase the rising prices easily. 💻Gold retreated today as expected, hitting a low near 3385.
Gold is currently in a consolidation phase and has not given a clear trading direction, or it is waiting for the release of initial jobless claims data.📊
As the price of gold rises, the short-term support also moves up. 🌈The focus below is on the 3390-3380 support line. 🥅If it falls back but does not break, you can consider going long.📈 Pay attention to the short-term resistance range of 3402-3412 on the upside. Once it breaks through, it is expected to set a new high. Otherwise, it will maintain a high-level fluctuation pattern during the day.📉

Gold Plan (28/08) – Captain VincentXAU/USD – Gold at Storm Breaker 3400: Consolidation before breaking ATH?
1. Market Waves 🌍
Throughout last week, gold consistently formed BOS (Break of Structure) , confirming that buyers remain dominant.
Currently, price is moving around 3,394 – 3,400, right at Storm Breaker 🌊 – the critical barrier before aiming at the previous ATH 3,424.
The big question: Will gold consolidate and then smash through ATH, or does it need a pullback towards key support before surging stronger in September?
2. Technical Outlook ⚙️
Storm Breaker 🌊 (Major Resistance): 3400 – 3424 (previous ATH). This is the gateway gold must conquer to unlock a new bullish trend.
Golden Harbor 🏝️ (Key Support): 3375 – 3355 – 3330. Confluence of FVG + Fibonacci 0.5/0.618 , likely to attract liquidity if price corrects.
Short-term scenario: Price may pull back to Golden Harbor before breaking higher.
3. Captain Vincent’s Map – Trade Scenarios 🪙
🔺 Quick Boarding 🚤 (BUY Scalp – pullback priority)
Entry: 3353 – 3355
SL: 3349
TP: 3356 → 3359 → 3361 → 33xx
🔻 Storm Breaker 🌊 (SELL reaction – previous ATH)
Entry: 3422 – 3424 (if tested)
SL: 3430
TP: 3419 → 3415 → 3410 → 3405 → 33xx
4. Captain’s Note ⚓
“The gold ship is now approaching Storm Breaker 🌊 3400 – 3424 .
If it breaks through, a vast ocean opens with a new bullish trend.
But if rough waves push it back, patience at Golden Harbor 🏝️ will secure the anchor and prepare for September’s big wave.”

Defend 3380, break through 3400 and there will be new highsLast night I reminded everyone not to chase high prices, as gold may experience a pullback in the short term. As expected, gold hit 3390-3400 and then encountered resistance and pressure, and then fell back to around 3385. This is in line with our judgment of the short-term trend of gold.
Currently, gold has returned to consolidate around 3395. As the price of gold continues to rise, the pressure and support levels of gold will also move up in the short term. In the short term, pay attention to the upper pressure range of 3402-3412. If the European session encounters resistance and pressure here, there is still a possibility of a pullback. Pay attention to 3390-3380 below. If it falls back but does not break through, you can consider going long. Once it stabilizes above 3400 in the NY period, it is expected to hit a new high. Focus on the initial jobless claims data to be released later.

SILVER (XAGUSD): Classic Trend-Following Setup
I see a very classic bullish model on Silver:
after a strong bullish wave, the market started to correct
within a bullish flag pattern.
Its resistance breakout always provides a reliable confirmation to buy.
I expect a rise to 39,16 now.
❤️Please, support my work with like, thank you!❤️
I am part of Trade Nation's Influencer program and receive a monthly fee for using their TradingView charts in my analysis.

Technical Outlook – XAUUSD
Current Price: 3,394 USD
Bias: Short-term bullish, but testing a critical resistance zone.
Key Technical Levels
Resistance Zone: 3,400 – 3,410
A strong supply area. If price fails to break above, a pullback is likely.
Support 1: 3,375 – 3,380 (EMA cluster + FVG near point D)
First dynamic support. Holding this level could trigger a bullish rebound.
Support 2: 3,354 – 3,360 (EMA200 + Fibonacci retracement)
A deeper support, safer entry for buyers if price retests.
Technical Context
EMA Ribbon: Price is trading above short-term EMAs → bullish momentum remains intact.
RSI (not displayed but implied by wave structure): near overbought territory, so short-term correction risk exists.
Fibonacci Harmonic Structure: AB=CD pattern completed, with the 3,400 area acting as a decisive pivot.
Trading Scenarios
Bullish Breakout:
If price closes above 3,410 (H1/H4) → look for long entries.
Upside targets: 3,425 – 3,440.
Stop loss below 3,390.
Bearish Rejection (Short-term pullback):
If price rejects 3,400 – 3,410, short positions can be considered.
Downside targets: 3,375 first, then 3,360.
Stop loss above 3,415.
Buy-the-Dip Strategy:
Best RR setup if bullish bias holds.
Look for longs at Support 1 (3,375 – 3,380) or Support 2 (3,354 – 3,360) with confirmation.
Conclusion
Gold is consolidating just below a major resistance zone.
A clear breakout above 3,410 could extend bullish momentum.
A failure at resistance may trigger a correction toward 3,375 – 3,360.
Stay patient and watch price action around 3,410 for confirmation before committing to a direction.
- Follow for more intraday gold strategies and save this analysis if you find it useful.

XAU/USD – Rise to 3,400 Followed by a PullbackHello everyone, on the H1 chart, gold has resumed its upward movement after bouncing from the 3,375–3,380 USD support zone. However, the 3,400 USD area is acting as a strong resistance level and is unlikely to be broken immediately. It is highly probable that the price will test 3,400 before facing selling pressure, leading to a correction back towards the 3,375 USD zone to retest demand strength.
