Elliott Wave Analysis XAUUSD – September 24, 2025📊
________________________________________
🔹 Momentum
D1
• Daily momentum is currently rising.
• So far, we have counted 4 bullish candles, which is the minimum requirement to complete a momentum cycle.
• There may be 1–2 more daily candles before momentum enters the overbought zone and reverses.
H4
• H4 momentum is in the oversold zone and about to reverse.
• The upcoming H4 bullish swing is critical:
o If it breaks the previous high → the uptrend continues, and we can expect another 1–2 daily bullish candles before reversal.
o If it fails to break the high → we must prepare for a reversal scenario.
H1
• H1 momentum is also heading into the oversold zone.
• This creates a confluence between H4 and H1, signaling a possible bullish move ahead.
________________________________________
🔹 Wave Structure
D1
• The yellow wave ⑤ has reached its first target at 3789.
• This is a strong resistance zone because:
o It aligns with the 0.382 Fibo retracement of waves ①–③ yellow.
o Wave ⑤ equals the length of wave ① yellow.
• If D1 momentum enters the overbought zone and price fails to break 3789, this may mark the top of wave ⑤ yellow, potentially triggering a sharp and prolonged decline.
H4
• Price has already seen a 5-candle decline on H4, with momentum in the oversold zone → this correction is near completion.
• Two possibilities:
1. It is wave ④ of wave ⑤ yellow.
2. It is the start of wave ① of a new bearish structure.
• If the next bullish move fails to break the previous high, the bearish wave ① scenario is confirmed, leading to a wave ③ decline with strong and steep characteristics.
H1
• A deeper and longer correction than previous ones has appeared, which is unusual, especially since price already reached the first target of wave ⑤ yellow.
• However, we should not rush to catch the top, as this unusual behavior is only visible on H1, while H4 and D1 still look normal.
• If this is wave ④, or wave ① of a bearish structure, or even just wave A → the next move should still bring a bullish swing confluence, providing an opportunity to look for Buy entries.
________________________________________
🔹 Key Support Zones
• 3747 – 3737
• 3729
________________________________________
🔹 Trading Plan
Scenario 1:
• Buy Zone: 3747 – 3744
• SL: 3735
• TP: 3774
Scenario 2:
• Buy Zone: 3730 – 3727
• SL: 3720
• TP: 3767
Xauusd(w)

XAUUSD – Gold Trading Plan (H2): Eyeing Key Reaction Zones📊 Market Context
Gold continues to hold firm after its recent push above 3,720 USD/oz, maintaining strong bullish momentum. The Fed’s dovish tone, which suggests further rate cuts later this year, and ongoing geopolitical tensions are keeping safe-haven demand intact. Price action indicates buyers are still in control, but key resistance levels could trigger profit-taking or pullbacks before any new highs are tested.
🔢 Technical Levels (H2)
🔴 Resistance / SELL Zones
3,818.758 – Major reaction zone; sellers likely to defend this level strongly.
3,757.270 – Secondary resistance, potential pivot for a short-term pullback.
🟡 Intermediate Supports
3,710.947 – First level to watch for a bounce if price retraces.
3,689.759 – Key support for reloading longs on deeper dips.
🟢 Major BUY Zone
3,661.715 – Strong structural support and potential low-risk entry for trend continuation.
📈 Trade Scenarios
1️⃣ Bullish Continuation (Primary Bias)
BUY: Look for price confirmation at 3,710 or 3,689–3,661 zones.
Targets: 3,757 → 3,818, keep a runner open if momentum breaks above 3,818.
Stop Loss: Below 3,655 to manage downside risk.
2️⃣ Countertrend SELL Opportunity
SELL: Enter shorts at 3,757–3,818 only if clear rejection signals or bearish candlestick patterns appear.
Targets: 3,710 → 3,689, trail stops to lock profits as price moves in your favor.
3️⃣ Deep Correction Play
BUY: Scale in around 3,661 if the market flushes lower.
Targets: 3,710 → 3,757, aligning with the overall bullish structure.
⚠ Key Notes for Traders
Volatility may remain elevated due to global headlines—adjust position sizes and manage risk carefully.
Avoid entering trades mid-range between 3,710–3,757 without clear confirmation.
Watch for strong candlestick or volume signals to validate entries at reaction zones.
💬 Community Discussion
📊 Will gold push through 3,818 for another leg higher, or retrace toward the buy zones first? Share your outlook and chart setups below so we can compare strategies!

GOLD has all-round support, Fed, geopoliticsOn September 23, the OANDA:XAUUSD market experienced a “roller coaster”: initially soaring to a record $3,791/ounce in the European session, then cooling significantly when the US Federal Reserve Chairman Jerome Powell spoke. However, gold still closed higher than at the beginning of the day, showing that the big uptrend has not been shaken.
As of the time of writing, gold has adjusted down slightly to $3,754/oz, equivalent to a decrease of 0.25% and about $10 on the day.
What keeps gold “shining”?
• Fed monetary policy: Powell stressed that the Fed must balance high inflation with a weakening job market. The Fed cut interest rates last week and the FedWatch tool shows a nearly 90% chance of further cuts in October. Lower interest rates make gold more attractive than bonds or savings.
• Fed view: While Powell has been cautious, other officials such as Bowman have warned that the Fed may be “slowing down” and need to cut interest rates faster if the economy worsens. This further reinforces expectations that gold will benefit.
• Hot geopolitics: NATO accused Russia of repeatedly violating the airspace of member countries, while Russia-Ukraine tensions were further complicated by the latest statement from former President Donald Trump. After meeting with President Zelensky, Trump unexpectedly strongly supported the possibility of Ukraine regaining all of its territory. This escalation of tensions has caused a sharp increase in safe-haven demand for gold.
• Market demand: Commerzbank pointed out that in addition to interest rates, factors such as ETF capital flows, doubts about the independence of the Fed and global political risks are simultaneously pushing up gold prices.
Fundamental Outlook:
Investors are focusing on the Personal Consumption Expenditures (PCE) index, the Fed’s preferred inflation measure, due later this week. If inflation continues to run hot, the Fed may be more cautious, but the pressure of US public debt and international instability remains a “golden support” for the price of this precious metal.
Since the beginning of the year, gold prices have increased by nearly 40%, the strongest pace since the late 1970s. With low interest rates, political risks and increased demand for shelter, the general trend still favors gold to maintain its “halo”.
Technical outlook analysis of OANDA:XAUUSD
• Main trend:
Gold price is still in the uptrend channel, each correction to the lower edge bounces up → buyers are in control.
• MA line:
Price is firmly above the EMA21 line, and the EMA21 is still pointing up → confirming the uptrend. The EMA plays a quite effective dynamic support role.
• Important support:
o Nearby: 3,720 – 3,738 USD (Fibo 0.236 zone + lower channel edge).
o Stronger support: around 3,628 USD (Fibo 0 bottom).
• Resistance – target above:
o Nearby: 3,779 – 3,791 USD (Fibo 0.382 + previous candle high).
o Next target: 3,825 USD (Fibo 0.5) → 3,872 USD (Fibo 0.618). If the breakout is successful, the possibility of advancing to the 3,939 USD zone is still open.
• RSI & momentum:
RSI is high, but has not yet fallen into extreme overbought. Momentum shows that there is still momentum, but there may be a pause (small pullback) before continuing to increase.
• Candlestick structure:
Recent candles have small bodies, narrow fluctuations → signs of market accumulation around the top. If the breakout is accompanied by liquidity, the possibility of further increase is very high.
The current gold trend is still inclined to increase. As long as the price stays above the support zone of 3,720 - 3,738 USD, the prospect of conquering the 3,779 - 3,825 - 3,872 USD marks is completely feasible.
SELL XAUUSD PRICE 3826 - 3824⚡️
↠↠ Stop Loss 3830
→Take Profit 1 3818
↨
→Take Profit 2 3812
BUY XAUUSD PRICE 3728 - 3730⚡️
↠↠ Stop Loss 3724
→Take Profit 1 3736
↨
→Take Profit 2 3742

Gold Potential Reversal Ahead - Gold Sell OpportunityGold is currently trading around 3647 after making a strong bullish move. Price has reached near a weak high zone and is showing signs of exhaustion, which indicates a possible retracement. The immediate resistance at 3659 has created a weak high. If Gold fails to sustain above this level, sellers are likely to step in, pushing price down toward the levels at 3620 – 3604. A confirmed rejection candle around the sell zone will act as the sell trigger, with 3578 as a deeper bearish target if momentum increases.
🔑 Key Levels to Watch:
- Resistance: 3687 – 3712
- Support: 3,628 - 3600
📌 Sell Zone & Sell Trigger:
- Sell Zone: 3670 – 3685 area
- Sell Trigger: A rejection candle or confirmation of failure to break above 3670 – 3685 zone.
Note
Please risk management in trading is a Key so use your money accordingly. If you like the idea then please like and boost. Thank you and Good Luck!

Gold All Time High Continue – Next Target?Gold is currently trading around $3688, just above the 3675–3680 breakout zone, which has now turned into a crucial support. Price is moving within an upward channel, but the recent breakout above equal highs and the labeling of a “weak high” suggest that buyers may still push towards the 3740–3750 resistance area before facing stronger rejection. A decisive break above the $3,700–3,750 zone would open the way to targets in the $3,800+ region and eventually toward $4,000 if the Fed proves dovish and ETF/central-bank demand remains strong.
However, failure to hold above 3680 would shift momentum back towards the lower channel, where immediate supports lie at 3565, 3530, and 3498. A deeper breakdown below these levels would open the door for further downside towards the 3440–3400 zone. Any surprise hawkish Fed commentary, a meaningful USD recovery, or a quick drop in inflation expectations could trigger sharper mean-reversion.
Buy Zone & Buy Trigger:
- Buy Zone: 3670 – 3680 area
- Buy Trigger: A clean breakout and 4H close above 3700 will be a buy trigger.
Note
Please risk management in trading is a Key so use your money accordingly. If you like the idea then please like and boost. Thank you and Good Luck!

Gold Rejected at $3,700 – Correction Ahead?Gold (XAUUSD) is currently trading around $3,662 and moving within an upward channel structure, but showing signs of weakness near the resistance zone. Price recently tested the $3,698–$3,700 resistance area and failed to break higher, creating a potential short-term top (marked as a weak high). This rejection signals that sellers are gaining strength. If price fails to sustain above $3,675–$3,698, it increases the probability of a deeper correction toward the lower channel and demand
Overall, Gold remains vulnerable to correction unless bulls reclaim and sustain above $3,700, which would invalidate the bearish setup and reopen the path toward $3,725–$3,750.
🔑 Key Levels to Watch
- Resistance: 3670 – 3690
- Support: 3625 – 3600
📌 Sell Zone & Sell Trigger:
- Sell Zone: 3675 – 3680 area
- Sell Trigger: If Gold retests and rejects the $3,690–$3,700 resistance zone, it becomes a valid sell entry with confirmation of bearish rejection.
Note
Please risk management in trading is a Key so use your money accordingly. If you like the idea then please like and boost. Thank you and Good Luck!

Gold Analysis: Breakout Potential Toward $3,800Gold is trading around $3,715, showing strong bullish momentum after breaking out of the recent consolidation zone between $3,595 – $3,640. Price has respected the ascending channel and is now approaching the $3,725–$3,740 resistance zone, which is a key area to watch. A sustained break above this zone could open the way toward $3,760+ and possibly extend into the $3,800 region if bullish momentum continues.
Gold is consolidating after a strong rally. Holding above the trendline is key—breaking below may lead to a deeper pullback, while a breakout above resistance could push prices toward $3,800. Despite short-term swings, the longer-term outlook stays bullish.
On the downside, immediate support lies near $3,680–$3,660, followed by the support levels at $3,638 and $3,616. Holding above these levels will keep the bullish structure intact.
📌 Sell Zone & Sell Trigger:
- Buy Zone: $3,660 – $3,680 area
- Buy Trigger: A clean breakout above $3,725 – $3,740 resistance → Upside target $3,760 – $3,800.
Note
Please risk management in trading is a Key so use your money accordingly. If you like the idea then please like and boost. Thank you and Good Luck!

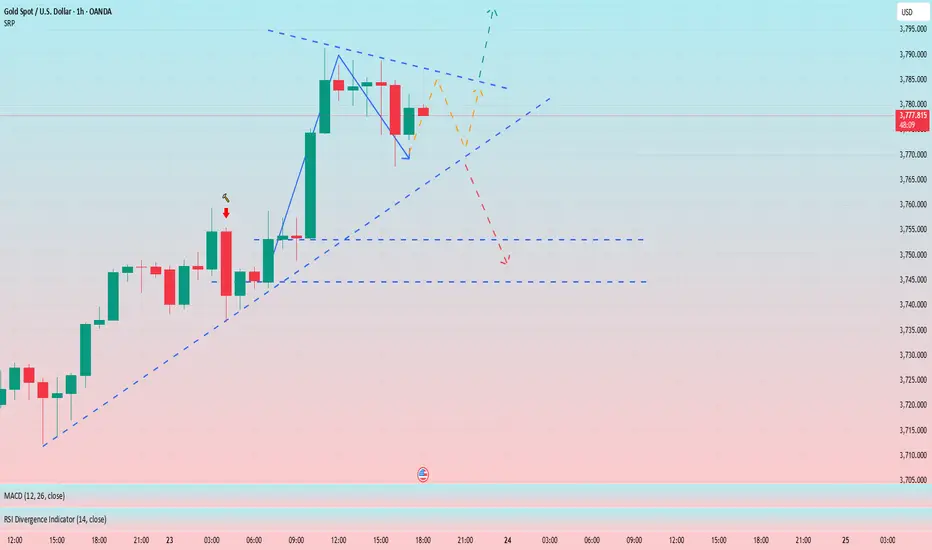
Gold (XAUUSD) – 24 Sep | Watching 3747–3743 POI for Long Setup🟡 Gold (XAUUSD) Analysis – 24 September
Hello Disciplined Traders,
Welcome to the Chart Is Mirror Community 👋
Market Context
• Our POI zone 3742–3738 HL respected beautifully yesterday, and our long setup hit full TP.
• Gold printed a new all-time high at 3791 in yesterday’s session.
• Price is now in an M15 pullback phase , likely retesting key buy zones before resuming its uptrend.
Key Observations
• Potential POI for Long Setup: 3747–3743 OB near HL area.
• If price respects this POI and gives LTF confirmation , we will look for a short-term buy trade.
• If price breaks this zone cleanly, we will reassess from lower levels.
Execution Plan
• Wait for price to retrace to 3747–3743 POI .
• Look for LTF confirmation before executing any trades.
• No setup, no trade — patience is key.
Invalidation
• A clean break and close below 3736.6 HL would signal a structure shift and may pause the bullish bias.
Stay disciplined — let price come to your zone before committing capital.
📘 Shared by @ChartIsMirror

Looks like we might finally get some pressure released on GoldIve been looking for price to break down. it has been on a bull run for well over a week now. and all this week it has pushed up with no pullbacks at all. Looks like we might have hit the high for the week and we could be getting a pullback from here. Waiting to see if we can break the previous Daily low for more bearish pressure.

Gold Soars: USD Weakness Pushes Gold Towards $3,800?Hello traders, currently gold is in an uptrend , driven by the weakening of the USD and disappointing U.S. economic data.
In the latest news, the Flash Manufacturing PMI (actual 46.2 vs. 47.0 previously) and Flash Services PMI (actual 51.9 vs. 54.2 previously) have both decreased, indicating that the U.S. economy is weakening. As the economy slows, the USD loses value, and investors begin to seek gold as a safe-haven asset. This has contributed to the increase in gold prices.
From a technical perspective, the chart shows that gold is trading in a clear upward channel. The current price is breaking through significant resistance levels , and the next target could be $3,850. If gold maintains this trend and does not break support levels, the likelihood of continued price growth is high.
Trading strategy: If gold holds the support level at $3,735 and does not fall below this level, traders could consider opening a BUY position with a target of $3,850.
In conclusion, with the weakness of the USD and technical trends supporting the move, gold has the potential to continue its strong upward momentum. Investors can look for buying opportunities as long as the price remains above the current support levels.

GOLD (XAUUSD): Bullish! Continue To Buy! In this Weekly Market Forecast, we will analyze the Gold (XAUUSD) for the week of Sept. 22 - 26th.
Gold is bullish on all HTFs. Selling is not an option. Wait for a pullback, and jump on the uptown train! Dips are your friend, so be patient and wait this market to take a breather.
Selling is only valid when there is a bearish break of structure. Until that happens, buy it, my friend.
Be wary of the pullback, as that move is likely to be corrected, but that would set up a great long opportunity!
Enjoy!
May profits be upon you.
Leave any questions or comments in the comment section.
I appreciate any feedback from my viewers!
Like and/or subscribe if you want more accurate analysis.
Thank you so much!
Disclaimer:
I do not provide personal investment advice and I am not a qualified licensed investment advisor.
All information found here, including any ideas, opinions, views, predictions, forecasts, commentaries, suggestions, expressed or implied herein, are for informational, entertainment or educational purposes only and should not be construed as personal investment advice. While the information provided is believed to be accurate, it may include errors or inaccuracies.
I will not and cannot be held liable for any actions you take as a result of anything you read here.
Conduct your own due diligence, or consult a licensed financial advisor or broker before making any and all investment decisions. Any investments, trades, speculations, or decisions made on the basis of any information found on this channel, expressed or implied herein, are committed at your own risk, financial or otherwise.

Gold Holds Trend: Retest Before Breaking Towards $3,800?Hello everyone,
On the news side, the backdrop still supports gold: the Fed’s tone has recently turned less hawkish, with expectations for a continued easing path keeping the USD and yields subdued. Meanwhile, upcoming US data releases — especially PCE along with Fed officials’ speeches — could amplify volatility around new resistance zones. In addition, defensive sentiment driven by geopolitical risks and uneven global growth continues to sustain safe-haven demand for gold.
On the H4 chart, gold remains firmly above the Ichimoku cloud, which is trending upward. Below, layered FVG zones at $3,725–3,715 and $3,705–3,700 act as dynamic support cushions. The latest breakout came with rising volume, showing that buyers remain in control.
My base case is for gold to extend towards $3,758–3,765 to clear liquidity above, then pull back to retest $3,725–3,715 (potentially dipping deeper into $3,705–3,700 if volatility spikes on data), before resuming its climb towards $3,790–3,800 provided the retest zone holds. Key support lies at $3,725–3,715 and deeper at $3,705–3,700, while the bullish setup would be invalidated if H4 closes below $3,690 (loss of the final FVG step + cloud edge).
So, what do you think — does gold have enough momentum to push towards $3,800 in this wave?

Gold at Key Resistance: Watching 3745 Support vs 3780 Breakout (Gold (XAUUSD) is pressing into resistance near 3780 while holding strong above key support at 3745. The bigger picture remains bullish, but we are at an important decision point.
Macro Drivers
📉 US10Y nominal yield easing (4.10%) → supportive for gold.
💵 DXY drifting lower (97.2) → dollar weakness tailwind.
📈 Real yields (DFII10 at 1.78%) ticking slightly higher → mild headwind.
📊 GLD ETF still making new highs → strong institutional demand.
🛡️ VIX creeping up (16.6) → safe-haven premium adding support.
🔮 T5YIE flat (2.42%) → inflation expectations stable.
⚪ Silver (XAGUSD ~44) lagging slightly → not fully confirming gold’s strength.
Levels to Watch
• 🔺 Resistance: 3780 → 3810 → 3850
• 🔻 Support: 3745 → 3726 → 3680
Trade Scenarios
1. ✅ Breakout Buy: If 4H closes above 3780 with weak DXY + easing yields, target 3810 → 3850. Stop below 3745.
2. ✅ Pullback Buy: If price dips to 3745–3750 with GLD still rising, re-entry zone. Stop 3726, targets 3780 → 3810.
3. ⚠️ Avoid Longs: If DXY >98 + US10Y >4.25 + real yields rise, gold likely retests supports.
Bias remains bullish, supported by flows and a weak dollar, but near-term price action is stretched. I’m looking to either buy dips into 3745–3750 or wait for a confirmed breakout above 3780.
🔹 Sharing my driver-based setup so others can track gold beyond price alone. Feedback welcome. Let’s trade smarter together.

Gold’s Turning Point – Bulls Reload or Bears Take Control?Gold has reached a critical stage in its journey. After breaking higher and sweeping liquidity, price tapped into a refined premium supply zone at 3780–3795. This is the kind of area where smart money tests momentum, where late buyers often get trapped, and where sellers show their first signs of strength.
But the story doesn’t end there. Just beneath, a solid demand base at 3715–3730 is waiting. If buyers regroup here, the bullish trend can reload for another assault on the highs. Between these two extremes sits the decision zone at 3750–3760, the pivot that will dictate the next chapter.
🟪 Premium Supply – 3780–3795
The upper battlefield, marked by the last order block and wick. Liquidity was swept here, and the rejection already showed sellers defending. Any revisit into this area could trigger another sharp reaction downward.
🟦 Demand Reload – 3715–3730
The lower base, built on a clean H1 OB with a fair value gap and EMA50 alignment. If gold retraces deeper, this is where bulls are likely to step in with force. A strong defense here would reload the bullish structure and open the path back to the premium highs.
🟨 Decision Zone – 3750–3760
This is the pivot point — the short-term battleground. If buyers defend this area, momentum shifts quickly back toward 3780–3795. If it cracks, sellers gain the upper hand and the market sinks toward the deeper demand.
⚔️ Battle Scenarios
Bullish Defense: Hold 3750–3760 → push into 3780–3795. If supply fails, continuation toward new highs.
Bearish Break: Lose 3750 → retrace into 3715–3730 for the real demand test.
Deep Correction: If 3715 gives way, next structural stop is 3670–3690.
🎯 Final Word
The battlefield is set: supply above, demand below, decision zone in the middle. Gold’s structure is still bullish, but momentum is fragile. The story now depends on whether 3750–3760 holds the line — defend it, and bulls reload; lose it, and sellers drag the market into discount.
🔥 What’s your take traders — do bulls reload from 3750, or do bears drag us down into deeper discount?
👇 Drop your thoughts in the comments, smash the like button, and hit follow on GoldFxMinds for more daily sniper plans. Let’s keep building this edge together 🚀✨

Gold - Just buy the all time high!🔱Gold ( TVC:GOLD ) will rally even higher:
🔎Analysis summary:
Gold remains totally bullish. And after the recent all time high breakout rally of about +15%, traders are willing to accept much higher prices. Following the significant long term rising channel formation, Gold will rally another +25% before we will see a retracement.
📝Levels to watch:
$4.000, $4.500
SwingTraderPhil
SwingTrading.Simplified. | Investing.Simplified. | #LONGTERMVISION

Gold XAUUSD Intraday Setup 23 Sept 2025Gold has shown strong bullish momentum, breaking above multiple resistance zones and forming a clean rally on the 15-minute chart. After this impulsive move, price is currently retracing, and a key support area lies around 3757–3759, which was previously resistance and may now act as support. A potential long setup forms if price taps into this level, offering a buying opportunity with a target at 3800, aligning with the next psychological resistance, while maintaining a protective stop loss around 3747. This setup reflects a classic resistance-turned-support trade with favorable risk-to-reward.

FOMC 100% Breakout (Check) - Key Resistance and 6500 Gamma PinFOMC was in fact a NOISE candle
So I measured the candle, projected a 100% breakout bullish and bearish
Bulls took the bait and ran higher, but still resistance @ 6700 seen today and hopefully
a short-term window to see a bit of a slide lower into some technical levels
EMA support levels
-watching the 21 period daily EMA
-watching the 50 period daily EMA
6550 FOMC candle lows from last week
6500 Gamma Pin with JP Morgan's quarterly collar trade
This is the first day in several weeks where I've seen some actual follow through
in negative gamma option flows
If futures grinds prices lower, the cascade may take hold and we can see a 100-200 point
selloff quickly in the S&P
I still like scooping up premium and buying the dips, but hopefully at more attractive levels
like 4-5% lower or even 8-10% lower
Let's see how it plays out. I'll be in the markets grinding per usual.
Thanks for watching!!!

Triangle pattern, Powell's speech determines the direction#XAUUSD OANDA:XAUUSD
The current market focus is on Powell’s speech. Will it give a shot in the arm to bulls or dampen their enthusiasm? We will wait and see. Since there have been no major bearish news for gold recently, its price has risen by nearly $100 after the Fed's interest rate cut. However, if Powell's remarks today trigger bearish sentiment, gold could fall rapidly.
After gold continued to rise to 3780-3790 in the European session today, it showed a more obvious stagflation state, which is also in line with the reference strategy I gave you this afternoon. We also made a good profit from shorting.
Technically, the hourly chart shows multiple doji candlesticks, indicating a tug-of-war between bulls and bears. The previous hour's bearish candlestick suggests a short-term downward correction. The focus is to pay attention to the 4H closing line. If the 4H also closes with a large negative line around 3750 3745, then this will be a significantly bearish pattern. If a small negative line is closed and the MA5 moving average is broken, then gold may first test the effectiveness of the 3750 3745 support.
At the same time, if you observe carefully, you will find that the market is trapped in a triangle consolidation range during the day. If the lower boundary falls below 3760, it will first go to 3750 and 3745 to test the effectiveness of support. At this time, you need to be more cautious when going long. If it breaks through the upper triangle boundary and touches the 3800 integer mark, do not continue to chase the rise, and beware of a pullback correction near the integer mark.
GOLD 1H CHART ROUTE MAP UPDATEHey Everyone,
Another great day in the markets with our chart idea playing out to perfection!
Yesterday, after hitting 3692 and 3717 with cross-and-lock confirmation, we got another cross and lock above 3717, leaving 3742 open. That level was hit perfectly today, followed by another cross and lock that opened 3768 also reached today, completing our 1h chart idea - Boooom 💥
Now, let’s shift to our 4H chart idea to target the remaining range. Any rejections in this zone could lead to lower Goldturns being tested for support and bounce inline with our plans to buy dips.
We will continue to buy dips using our support levels taking 20 to 40 pips. As stated before each of our level structures give 20 to 40 pip bounces, which is enough for a nice entry and exit. If you back test the levels we shared every week for the past 24 months, you can see how effectively they were used to trade with or against short/mid term swings and trends.
The swing range give bigger bounces then our weighted levels that's the difference between weighted levels and swing ranges.
BULLISH TARGET
3692 - DONE
EMA5 CROSS AND LOCK ABOVE 3692 WILL OPEN THE FOLLOWING BULLISH TARGETS
3717 - DONE
EMA5 CROSS AND LOCK ABOVE 3717 WILL OPEN THE FOLLOWING BULLISH TARGET
3742 - DONE
EMA5 CROSS AND LOCK ABOVE 3742 WILL OPEN THE FOLLOWING BULLISH TARGET
3768 - DONE
BEARISH TARGETS
3673
EMA5 CROSS AND LOCK BELOW 3673 WILL OPEN THE FOLLOWING BEARISH TARGET
3650
EMA5 CROSS AND LOCK BELOW 3650 WILL OPEN THE SWING RANGE
3622
3592
EMA5 CROSS AND LOCK BELOW 3592 WILL OPEN THESECONDARY SWING RANGE
3556
3528
As always, we will keep you all updated with regular updates throughout the week and how we manage the active ideas and setups. Thank you all for your likes, comments and follows, we really appreciate it!
Mr Gold
GoldViewFX

XAUUSD: Market Analysis and Strategy for September 23Gold Technical Analysis
Daily resistance at 3800, support at 3632
Four-hour resistance at 3800, support at 3716
One-hour resistance at 3800, support at 3748
Gold News Analysis: After hitting a record high of 3791, gold has entered a period of volatile trading, as the market remains extremely overbought and buying has become cautious. Furthermore, the overall positive sentiment in the stock market is acting as resistance for the safe-haven commodity. However, any meaningful pullback seems unlikely due to the Fed's dovish outlook, which is likely to continue supporting gold. Traders are now looking forward to Fed Chairman Jerome Powell's speech during the North American session, which could impact dollar price dynamics and provide short-term support for gold. September PMI data from European and US markets will also be released today, along with speeches by Fed Governor Bowman and Atlanta Fed President Bostic, which warrant close attention.
Gold Trading Recommendations: Based on the current 1-hour and 4-hour analysis, short-term support is currently around 3748-3716. The short-term bullish trend line has moved up to 3748. Intraday pullbacks to this level will support continued bullish momentum.
Buy: 3716near
Buy: 3748near

XAUUSD: Targeting $3600 By End Of The YearGold has successfully bridged the liquidity gap in the daily timeframe, indicating a bullish trend since then. We have an opportune moment to initiate a bullish position within our “drawn” area. However, it is imperative to verify the volume and price dynamics in a shorter timeframe. Upon witnessing robust confirmation, it would be optimal to take any position.
We extend our best wishes for successful trading. It is crucial to adhere to meticulous risk management practices during trading. It is important to note that this analysis does not guarantee price movements in accordance with the provided description.

#XAUUSD: Neutral View On Gold May Go Either Side Gold has rallied to $3700 making it all time high level. However, at this moment gold remain uncertain as it can go either way of the trend. Therefore we have two point of view on current time; firstly since heavily bought, we can see a nice correction taking price to almosr 3550 area which remain crucial. The problem with this approach is we need strong confirmation snd currently we do not have. Second view is that price may continue the bullish approach and may take price to a record high.
Team Setupsfx

ElDoradoFx PREMIUM 2.0 – GOLD ANALYSIS (23/09/2025 – Evening UpdGold is trading around 3,775–3,776, consolidating just below intraday resistance after hitting a session high of 3,791. Momentum is still bullish on higher timeframes, but intraday signals show indecision as price rotates between support and resistance zones.
⸻
🔍 Technical Outlook
Daily (D1):
• Trend remains bullish, holding well above the 21 EMA (3,722) and 50 EMA (3,652).
• Structure: Higher highs and higher lows intact.
• Resistance: 3,786–3,791 zone is key supply.
• Support: 3,752–3,745 intraday demand zone.
1H Chart:
• Price is consolidating under 3,786 resistance.
• EMA cluster at 3,768–3,760 acting as immediate support.
• MACD: Bullish histogram fading – showing slowing momentum.
• RSI hovering ~60, neutral but not overbought.
15M Chart:
• Price is ranging between 3,779–3,770.
• Support at 3,770–3,767 holding so far.
• Repeated rejection at 3,779–3,782 signals short-term supply.
• Structure: Sideways, waiting for breakout.
5M Chart:
• Price action chopping between 3,782 resistance and 3,770–3,767 support.
• MACD flatlining, RSI neutral – confirming range conditions.
⸻
🟡 Fibonacci Golden Zone
Using the latest swing low (3,741) to high (3,791):
• 38.2% Fib = 3,772
• 50% Fib = 3,766
• 61.8% Fib = 3,760
➡️ The golden zone is 3,772–3,760, a high-probability demand zone for bullish continuation if retested.
⸻
⚖ High-Probability Entries
Buy Setup (preferred while above 3,760):
• Entry: 3,772–3,760 (Fib zone)
• SL: 3,754 (≈60 pips from 3,760)
• TP: 3,782 → 3,791 → 3,800
Sell Setup (only if rejection holds at resistance):
• Entry: 3,786–3,791 rejection
• SL: 3,797 (≈60 pips from 3,791)
• TP: 3,772 → 3,766 → 3,760
⸻
⚡ Scalping Opportunities (M5 & M15 focus, ≤60 pips SL)
• Buy scalp: 3,767–3,760 → TP 3,775–3,780 (SL 3,754)
• Sell scalp: 3,786–3,791 → TP 3,775–3,770 (SL 3,797)
⸻
📅 Key Breakout Levels
• Bullish continuation: Break & hold above 3,791 → unlocks 3,800–3,808.
• Bearish retracement: Break & hold below 3,760 → exposes 3,752 → 3,741.
⸻
✅ Summary
Gold is consolidating below 3,791 resistance, with the Fib golden zone (3,772–3,760) acting as intraday demand. Bias remains bullish while above 3,760, but sellers may defend 3,786–3,791. Scalpers can trade between the Fib zone and resistance until a breakout defines the next leg.
— ElDoradoFx PREMIUM 2.0 Team
