Gold (XAUUSD) on the H1 timeframe – August 25, 2025Market Overview
Gold (XAUUSD) is currently trading around 3366, showing consolidation after a strong bullish impulse. The price is now facing a critical resistance zone and is forming a short-term flag/pennant structure, which usually signals continuation but needs confirmation.
Resistance zone: 3377 – 3380
Support zone: 3323 – 3330
EMA 9 (blue line): 3365 – acting as dynamic short-term support
Volume: A strong spike was seen in the last bullish leg, indicating institutional participation
Key Technical Levels
Immediate Resistance: 3377 – 3380
Major Resistance: 3400
Immediate Support: 3350 – 3355
Major Support: 3323 – 3330
Indicators & Price Action
EMA 9 is slightly below price, suggesting bullish momentum is still active.
Trendline & Fibonacci projections show that price may test the resistance before deciding the next direction.
Volume profile confirms strong buying activity near the 3325 zone, which reinforces it as strong support.
If RSI (not shown but implied) is near overbought, retracement from 3377 would be likely.
Trading Scenarios
Bullish Scenario (Green Path):
If price breaks above 3377 with strong volume, buyers may push towards 3400 – 3410.
Strategy: Buy breakout above 3377, SL below 3360, TP 3395 – 3405.
Bearish Scenario (Red Path):
If price rejects at 3377 and closes below 3355, selling pressure could bring it back to 3330 – 3323.
Strategy: Sell rejection at 3377 or breakdown below 3355, SL above 3385, TP 3330 – 3325.
Conclusion
Gold is at a critical resistance – 3377 will decide the next leg.
Above 3377 → bullish continuation to 3400+.
Below 3355 → correction back to 3323 support.
- Note for traders: Today’s price action is highly sensitive to resistance rejection or breakout. Manage risk with tight stop-losses.
Xauusd(w)

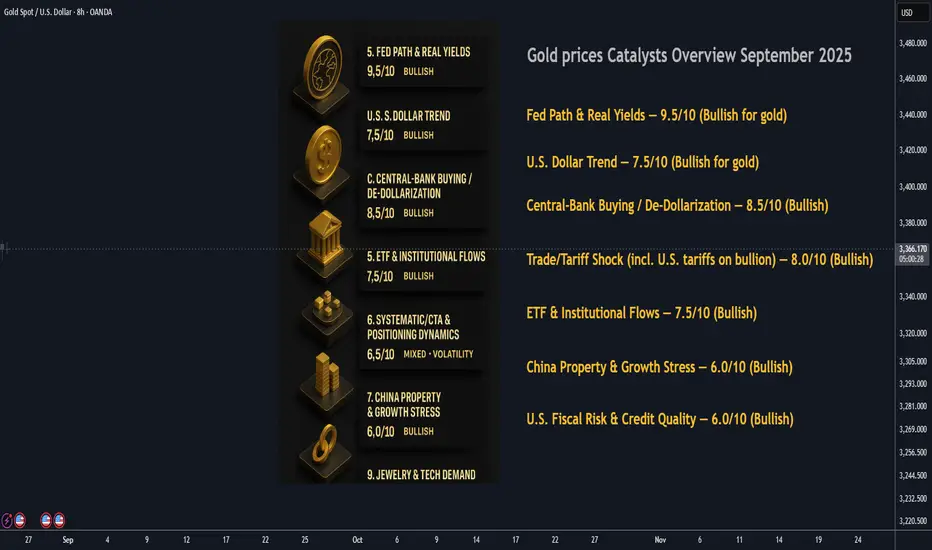
Gold Prices Overview of Primary Catalyst : September 2025⚡️ Gold: Consolidation Before the Next Move
Gold set fresh records earlier this year and now sits in a tight post–Jackson Hole range around $3,360–$3,380/oz as rate-cut odds jumped and the dollar eased back. Spot was ~$3,368 this morning, slightly off Friday’s spike after Powell opened the door to a September cut.
________________________________________
1) Fed Path & Real Yields — 9.5/10 (Bullish for gold)
Powell’s Jackson Hole remarks highlighted rising labor-market risks and explicitly “opened the door” to a September cut. Futures now price a high probability of an initial -25 bps move with more to follow into year-end. Lower policy rates/real yields remain the single strongest tailwind for non-yielding gold.
2) U.S. Dollar Trend — 7.5/10 (Bullish for gold)
The DXY slipped toward the high-97s after Powell’s dovish tilt and remains soft versus recent peaks, reducing a key headwind to non-USD buyers. If the dollar rebound stalls, gold’s upside path stays cleaner.
3) Central-Bank Buying / De-Dollarization — 8.5/10 (Bullish)
Official-sector demand stays structurally strong. Global central banks remain on track for another ~1,000t year, with China’s PBoC extending purchases for a ninth straight month. This “sticky” bid continues to underwrite dips.
4) Trade/Tariff Shock (incl. U.S. tariffs on bullion) — 8.0/10 (Bullish)
The broad U.S. tariff regime (10% baseline, higher on targeted goods) is inflationary at the margin; crucially, imports of 1kg/100oz gold bars were swept into the rules, temporarily snarling Swiss shipments and roiling COMEX/LBMA logistics until guidance is clarified. Result: fatter location/financing premia and periodic price dislocations that tend to support spot.
5) ETF & Institutional Flows — 7.5/10 (Bullish)
After years of outflows, ETF inflows in the first half of 2025 were the strongest in 5 years (~$38B; +397t), with July showing further additions. GLD holdings are back near ~957t. Continued inflows amplify macro moves.
6) Systematic/CTA & Positioning Dynamics — 6.5/10 (Mixed → Volatility)
CTAs and options flow are magnifying swings around key levels ($3,350–$3,420). Upside call demand is persistent, meaning whipsaws remain likely as trend-following systems react to dollar/yield shifts.
7) China Property & Growth Stress — 6.0/10 (Bullish)
The Evergrande delisting and deepening Country Garden losses underscore a property slump that keeps risk appetite in check and supports defensive assets. Weak housing drags on jewelry demand but typically supports investment demand for bullion.
8) U.S. Fiscal Risk & Credit Quality — 6.0/10 (Bullish)
The May downgrade of U.S. sovereign credit and ongoing wide deficits keep a slow-burn bid under gold. Any wobble in auctions or debt-ceiling theatrics would push this higher.
9) Jewelry & Tech Demand — 5.0/10 (Slightly Bearish/neutral short-term)
Record prices hit Q2 jewelry volumes (-14% y/y to 341t), though India shows early signs of seasonal revival into festivals. Tech demand dipped ~2% y/y amid electronics softness. Physical demand is a brake on parabolic rallies.
10) Geopolitics (Ukraine, Middle East, Taiwan risk, etc.) — 5.5/10 (Event-Bullish)
Headlines remain volatile—Israeli strikes on Iran-aligned Houthis and ongoing Ukraine politics keep a latent safe-haven premium. Spikes are event-driven unless escalation persists.
________________________________________
🌐 Other Catalysts to Watch
• Crypto Cross-Flows (5/10): Sharp crypto drawdowns can funnel short-term interest into gold, though correlation remains inconsistent.
• Bullion Logistics & Refining (New): U.S. tariff ambiguity on kilobars introduces intermittent premiums and arbitrage opportunities between Zurich–London–NY.
• Physical Supply Disruptions (4/10): Always idiosyncratic; currently secondary to macro.
| Rank | Catalyst | Score/10 | Current Impact | Direction | Notes |
| ---- | ------------------------------------------ | -------: | -------------- | ------------------------------ | ------------------------------------------------------------ |
| 1 | Fed path & real yields | **9.5** | Very High | **Bullish** | Dovish tilt; cuts now live for Sept. |
| 2 | Central-bank buying | **8.5** | High | **Bullish** | Ongoing official demand; PBoC keeps adding. |
| 3 | Trade/tariff shock (incl. bullion tariffs) | **8.0** | High | **Bullish** | Broad tariffs + bullion rules raise premia & inflation risk. |
| 4 | U.S. dollar trend | **7.5** | High | **Bullish** | DXY softer post-Jackson Hole; less drag on gold. |
| 5 | ETF/institutional flows | **7.5** | High | **Bullish** | Biggest inflows in 5 yrs; GLD holdings high. |
| 6 | Systematic/CTA flows | **6.5** | Moderate | **Mixed** | Options/CTA activity driving overshoots both ways. |
| 7 | China property stress | **6.0** | Moderate | **Bullish** | Structural drag supports safe-haven demand. |
| 8 | U.S. fiscal/credit risk | **6.0** | Moderate | **Bullish** | Downgrade + deficits maintain hedge demand. |
| 9 | Jewelry/tech demand | **5.0** | Low | **Neutral → Slightly Bearish** | Jewelry volumes fell 14% y/y; festivals could revive. |
| 10 | Geopolitics (broad) | **5.5** | Low–Mod | **Bullish (event-driven)** | Episodic; not the primary driver now. |
XAUUSD Gold Trading Strategy August 25, 2025XAUUSD Gold Trading Strategy August 25, 2025:
The market revolved around the FED and Trump, gold rose at the end of last week and was limited by the 0.236% Fib level.
Fundamental news: Mr. Powell's unexpectedly dovish remarks reinforced the market's hopes for a rate cut in September. As a result, the US Dollar Index fell sharply on Friday, reversing the upward trend of the first 4 trading days of the week. Moreover, the strong increase on Friday also pushed the gold price to skyrocket nearly 36 USD during the week.
Technical analysis: After a strong increase when it had compressed enough force in the bullish pattern and broke the downtrend channel on the H1 frame, the gold price at the beginning of this week's trading session is having a correction phase. The uptrend of gold is still maintained. The liquidity zones combined with FIB support and MA lines will now be our trading area. The gold price is very likely to return to the old ATH zone of 3500 this week.
Important price zones today: 3345 - 3350 and 3330 - 3335.
Today's trading trend: BUY.
Recommended orders:
Plan 1: BUY XAUUSD zone 3345 - 3347
SL 3342
TP 3350 - 3360 - 3370 - 3390.
Plan 2: BUY XAUUSD zone 3330 - 3332
SL 3327
TP 3335 - 3345 - 3355 - 3390.
Wish you a safe, successful and profitable trading week.🌟🌟🌟🌟🌟

GOLD H4 | Bullish bounceXAU/USD is falling towards the buy entry at 3,349.35, which is a pullback support that aligns with the 50% Fibonacci retracement and could bounce from this level to the upside.
Stop loss is at 3,329.36, which is a pullback support.
Take profit is at 3,400.62, which is a swing high resistance.
High Risk Investment Warning
Trading Forex/CFDs on margin carries a high level of risk and may not be suitable for all investors. Leverage can work against you.
Stratos Markets Limited (tradu.com ):
CFDs are complex instruments and come with a high risk of losing money rapidly due to leverage. 65% of retail investor accounts lose money when trading CFDs with this provider. You should consider whether you understand how CFDs work and whether you can afford to take the high risk of losing your money.
Stratos Europe Ltd (tradu.com ):
CFDs are complex instruments and come with a high risk of losing money rapidly due to leverage. 66% of retail investor accounts lose money when trading CFDs with this provider. You should consider whether you understand how CFDs work and whether you can afford to take the high risk of losing your money.
Stratos Global LLC (tradu.com ):
Losses can exceed deposits.
Please be advised that the information presented on TradingView is provided to Tradu (‘Company’, ‘we’) by a third-party provider (‘TFA Global Pte Ltd’). Please be reminded that you are solely responsible for the trading decisions on your account. There is a very high degree of risk involved in trading. Any information and/or content is intended entirely for research, educational and informational purposes only and does not constitute investment or consultation advice or investment strategy. The information is not tailored to the investment needs of any specific person and therefore does not involve a consideration of any of the investment objectives, financial situation or needs of any viewer that may receive it. Kindly also note that past performance is not a reliable indicator of future results. Actual results may differ materially from those anticipated in forward-looking or past performance statements. We assume no liability as to the accuracy or completeness of any of the information and/or content provided herein and the Company cannot be held responsible for any omission, mistake nor for any loss or damage including without limitation to any loss of profit which may arise from reliance on any information supplied by TFA Global Pte Ltd.
The speaker(s) is neither an employee, agent nor representative of Tradu and is therefore acting independently. The opinions given are their own, constitute general market commentary, and do not constitute the opinion or advice of Tradu or any form of personal or investment advice. Tradu neither endorses nor guarantees offerings of third

25/8/68 : XAUUSD ( Europe / London Session )Using it from Europe Session until 7.00PM , I'll new analysis and update at 8.00PM
Resistance
3386-3392
3376-3381
3371
Support
3360
3350-3355
3340-3345

Gold Targets Historic Resistance ZoneHello, what do you think about the trend of OANDA:XAUUSD ?
Gold has just posted a strong rally following the Jackson Hole speech, where Fed Chair Jerome Powell signaled a more dovish stance and left the door open for potential rate cuts in the near future. The U.S. dollar and bond yields eased, creating favorable conditions for gold to climb higher. At present, the precious metal is trading around 3,371 USD and continues its upward momentum.
From a technical perspective, the chart is shaping an ascending triangle pattern with a flat resistance zone in the 3,400–3,450 range and a rising trendline providing support below. This formation typically signals the continuation of an uptrend. Should the price break out and close above this resistance area, higher targets will open up — aligning with my long-term outlook.
A clear breakout above this critical resistance zone is needed to confirm the next directional move.
What about you — how do you see gold’s next move? Share your ideas and thoughts in the comments.
Good luck!

Domestic gold prices increase but international prices decreaseThirteen Wall Street analysts participated in Kitco's gold survey this week, with none calling for a decline. Of those surveyed, eight were bullish on gold for next week. The rest were neutral.
The main argument for the bullish group is the expectation of a rate cut by the Federal Reserve in September, following comments from Chairman Jerome Powell. Ole Hansen, head of commodity strategy at Saxo Bank, said that after a relatively quiet summer for the gold market, the Fed will help open the door by cutting interest rates through the end of the year.
This will weaken the US dollar, creating a positive environment for gold. In the short term, Hansen said that the precious metal could rise above $3,450 an ounce before investors can revisit April's record high above $3,500.
Resistance : 3375 , 3385
Support : 3352 , 3344

What's happening with gold? How should we view it?
At the Jackson Hole Global Central Bank Annual Meeting, Powell, in a break from his usual stance, expressed pessimism about the job market and shifted monetary policy from a "wait-and-see" approach to an "adjustable" approach. Influenced by Powell's stance, gold prices surged, soaring from around 3320 to around 3380.
From the perspective of the news, first, the Federal Reserve is highly likely to cut interest rates; a delay does not mean an end. A 4.5% interest rate is not a good thing for the current US economy. High corporate financing and personal borrowing costs are a serious drag on the US economic recovery, and gold's narrative is shifting from a safe-haven asset to a global currency anchor.
Second, gold hasn't yet entered a downward trend; it's merely a temporary pause. Holding gold offers not only a profit from price arbitrage but also, more importantly, a strategic asset allocation strategy.
Market Analysis:
Currently, focus is on the support level of 3360-3350. If it breaks below, the next support level is around 3345. This indicates that the upward momentum driven by last Friday's news has been released, and the bullish momentum is nearing completion.
Please note that the early Asian session's gains are unlikely to sustain the bullish trend. If the 3360-3350 level falls, it's time to adjust your strategy and short gold. At 3345, consider a light long position to see if there's a rebound in the European and American markets.
Wishing you all a successful trading week.
XAUUSD: Bullish Opportunity After FOMC and Economic DataHello all traders, this article will help you understand the market context and trends.
Yesterday, the FOMC meeting minutes were released, showing broad consensus on maintaining interest rates, which encourages investors to turn to gold as a safe-haven asset , increasing demand for XAUUSD. The higher-than-expected unemployment claims data (235K vs 226K forecast) indicates a weaker labor market, putting downward pressure on the USD and driving gold prices higher. However, the better-than-expected Flash PMI manufacturing index (53.3 vs 49.7 forecast) helped the USD rise slightly, but the impact was minimal.
Technical Analysis:
XAUUSD is trading in a downtrend channel, but the signals are unclear. Immediate support is at 3,312.000, an important level that has been tested and held. Currently, XAUUSD is near a small resistance zone at 3,353.000, with potential targets at TP1: 3,353.000 and TP2: 3,375.000 . Both EMA (89) and EMA (34) are sloping upward, confirming the strength of the uptrend.
Market Strategy:
Buy XAUUSD when the price pulls back to the support level at 3,312.000, with targets at 3,353.000 and 3,375.000.
Risk Management:
Monitor support at 3,312.000. If this level breaks, XAUUSD could correct to 3,270.000. Use a stop-loss below this support level.
Do you think gold can continue its upward trend, or will a correction appear?

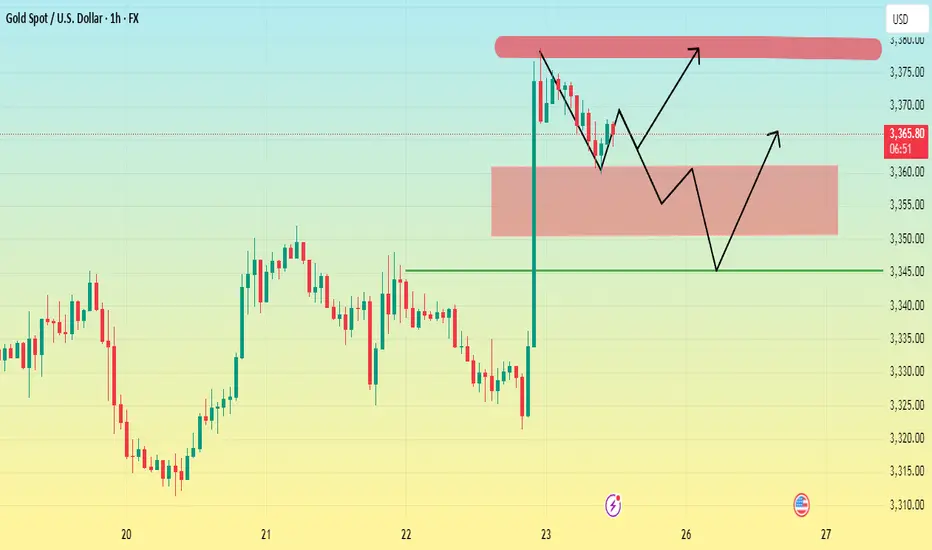
Gold (XAUUSD) Intraday Analysis – August 25, 2025Gold (XAUUSD) has just broken out of a multi-day consolidation range with strong bullish momentum. A large bullish candle accompanied by high volume signals aggressive buying pressure returning to the market. At the moment, price is retesting the breakout zone, which will be key to confirming the next move.
Technical Outlook
Price Structure: Gold broke out of a rectangular consolidation range with the upper boundary around 3,377 – 3,380 USD and the lower boundary near 3,312 USD.
EMA Trend: Price is trading above short-term EMAs, showing bullish bias. As long as price holds above the breakout zone, the uptrend remains intact.
RSI: The RSI stays above 55 and has not yet reached overbought territory, leaving room for further upside.
Fibonacci Levels: The 3,377 – 3,380 USD zone also aligns with the 0.618 Fib retracement of the prior downswing, making it a key resistance to watch.
Key Levels
Immediate Support: 3,355 – 3,360 USD (breakout retest + EMA20).
Major Support: 3,312 USD (previous range low).
Near-term Resistance: 3,380 USD.
Next Resistance: 3,395 – 3,400 USD.
Trading Strategies
Buy Setup (Preferred):
Look for long entries if price retests 3,355 – 3,360 USD, with stop loss below 3,345 USD.
Short-term target: 3,380 USD; extended target: 3,395 – 3,400 USD.
Sell Setup (Defensive):
If price fails to hold 3,355 USD, a deeper pullback toward 3,335 – 3,320 USD is possible.
Only consider short positions if bearish candlestick patterns confirm rejection.
Conclusion
Gold remains in a bullish intraday trend as long as price holds above 3,355 USD. The breakout indicates renewed buyer confidence, with 3,395 – 3,400 USD as the next upside target.
Stay alert to price behavior at the retest zone for optimal entries — and follow for more trading strategies like this.

Market revolves around FED and Trump, GOLD is limitedFederal Reserve Chairman Jerome Powell's speech at the Jackson Hole symposium on Friday was the focus of market attention this week.
Powell's unexpectedly dovish remarks reinforced market hopes for a September rate cut. As a result, the US Dollar Index fell sharply on Friday, reversing the upward trend of the first four trading days of the week. Moreover, Friday's strong gains also pushed gold prices to a nearly $36 surge for the week.
On Friday (August 22), the US Dollar fell sharply and gold prices soared due to dovish comments from Federal Reserve Chairman Powell
Federal Reserve Chairman Jerome Powell hinted at future rate cuts in his highly anticipated speech at the Jackson Hole central bank's annual symposium, saying a rate cut "may be necessary" if conditions warrant. While he did not promise a rate cut, Powell said changes in the risk landscape could require adjustments to the Fed's policy guidance.
“The stability of the unemployment rate and other labor market indicators allows us to be cautious as we consider changes to the stance of policy,” Powell said Friday. “However, changes in the baseline outlook and the balance of risks may make it appropriate to adjust the stance of policy while policy remains within its narrow range.”
The remarks attempted to strike a delicate balance, acknowledging rising risks to the job market while warning that inflation pressures remain. Powell also stressed on Friday that policymakers must guard against persistent inflation risks from President Donald Trump’s tariffs. He said the impact of tariffs on consumer prices was “now evident,” but there was reason to expect the effects would be relatively short-lived.
Following Powell’s speech, the US dollar fell sharply, gold prices jumped and the yield on the 2-year US Treasury note fell 10 basis points to 3.69%.
Powell’s comments also highlighted the importance of jobs and inflation data ahead of the Federal Reserve’s policy meeting on September 16-17.
The CME FedWatch tool shows that traders are now pricing in a 75% chance of a September rate cut.
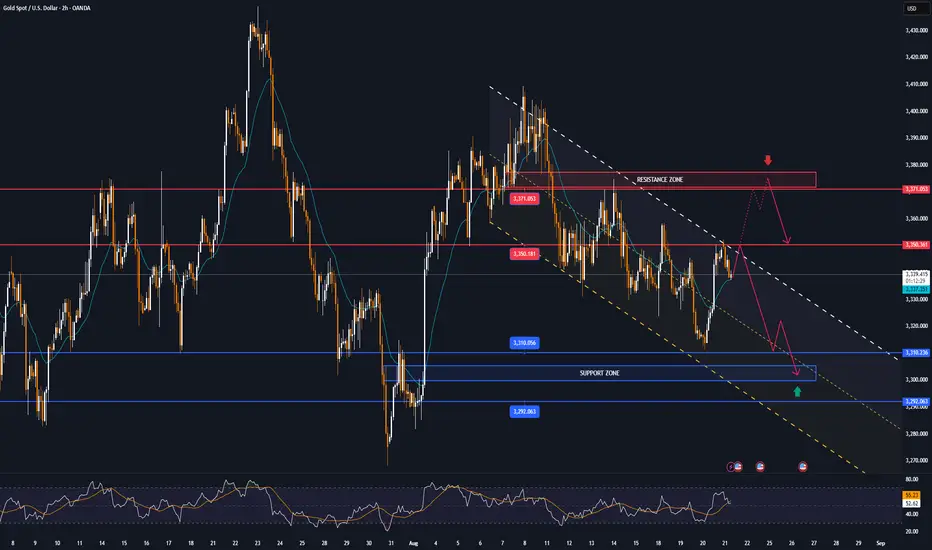
Technical Outlook Analysis OANDA:XAUUSD
On the daily chart, gold has recovered from $3,310, which is the first support point in the $3,310 – $3,292 area noted by readers in last week’s weekly edition. However, the temporary recovery is still limited by the 0.236% Fibonacci retracement level, which if gold breaks above this level with price action above $3,371, it will be eligible for further upside with the next target around $3,400 in the short term, more so than $3,430 – $3,450.
Overall, gold is still in a sideways technical state as depicted inside the green rectangle. In case of a sell-off below the 0.382% Fibonacci retracement level, the downside momentum could also be limited by the $3,246 level followed by the $3,228 level at the 0.50% Fibonacci retracement price point. The relative strength index hovering around 50 also shows the market's indecision, it does not give any reliable signal whether the trend is bullish or bearish in terms of momentum.
Looking ahead, gold is primed for a short-term rally, with a break above $3,371 a necessary condition for a new short-term rally, with the following key points to watch.
Support: $3,350 – $3,310 – $3,300
Resistance: $3,371 – $3,400 – $3,430
SELL XAUUSD PRICE 3405 - 3403⚡️
↠↠ Stop Loss 3409
→Take Profit 1 3397
↨
→Take Profit 2 3391
BUY XAUUSD PRICE 3329 - 3331⚡️
↠↠ Stop Loss 3325
→Take Profit 1 3327
↨
→Take Profit 2 3333

Gold Continues to SurpriseHello everyone, let’s take a look at OANDA:XAUUSD !
Yesterday, gold continued to surprise us, as the metal made a strong recovery on Wednesday, trading around 3,345 USD in the US session after dropping to a three-week low of 3,311 USD earlier.
This recovery occurred as the US Dollar (USD) dropped from a one-week high. Additionally, gold reversed sharply upward as tensions in Ukraine did not ease as expected. The escalating tensions are not just between the US, Russia, and Ukraine, but Europe also wants its influence on the matter. Since Europe is not willing to compromise, a peace agreement seems unlikely to be reached.
From a technical perspective, gold successfully tested the previous resistance at 3,330 USD, turning it into new support, breaking out of the downward trendline. If gold maintains strength above this level, the next key targets to watch are 3,357 and 3,370 USD.
Regarding the trend outlook: Investors are closely watching the minutes from the latest Federal Open Market Committee (FOMC) meeting to gain insights into the US monetary policy direction in the short term.
Fed Chairman Jerome Powell will speak on Friday morning and is expected to update the Fed's monetary policy framework. Powell’s speech could provide a new perspective on internal FOMC support for a potential interest rate cut in September, which could set a new trend for XAU/USD.
Stay tuned with me! Don’t forget to like the post and share your views in the comments.
Good luck!

Gold (XAU/USD) – 25-August-2025Live Price (UTC Anchor): $3364.00
Gold continues to trade within a tightly coiled range, but today’s structure across Daily → 4H → 1H timeframes highlights key execution-ready zones. Institutional footprints are clear — liquidity sweeps, unmitigated order blocks, and premium/discount imbalances are guiding the flow.
Buy-Side Liquidity Zones
🔹 Primary Buy Zone: $3348 – $3352
Fresh 4H bullish order block, unmitigated since last push.
Daily structure still showing higher-lows above $3330.
1H BOS with hidden bullish divergence (RSI).
Best confluence zone for long entries.
🎯 Targets: $3378 → $3395
🛡️ Stop: Below $3340
🔹 Secondary Buy Zone: $3328 – $3332
Daily demand base from prior accumulation.
Liquidity sweep expected below $3335.
4H fair value gap aligns with engineered liquidity.
🎯 Targets: $3350 → $3375
🛡️ Stop: Below $3320
📉 Sell-Side Liquidity Zones
🔻 Primary Sell Zone: $3388 – $3395
Daily resistance supply untouched since last rejection.
4H bearish OB marks origin of sell-off.
1H CHoCH with overhead imbalance.
ATR resistance at $3390–$3395 zone.
🎯 Targets: $3370 → $3350
🛡️ Stop: Above $3402
🔻 Secondary Sell Zone: $3410 – $3416
Daily premium zone at range extreme.
Liquidity highs resting around $3412.
1H displacement cluster with VWAP extension.
🎯 Targets: $3390 → $3365
🛡️ Stop: Above $3420
⚡ Executive Outlook – Golden Zone
The Golden Zone for today is $3348 – $3352 (Primary Buy Zone).
Supported by 5+ confluences across Daily, 4H, and 1H.
Aligns with macro bullish bias and engineered liquidity setup.
High-probability long with clear SL/TP levels, offering the cleanest risk-reward of the day.
Trading Plan:
Patience is key. Wait for price to revisit the Golden Buy Zone ($3348 – $3352). Execute with conviction only if order flow confirms (1H rejection wicks / volume spike). Upside targets remain $3378 → $3395.

Gold Trade Plan - Pivot confluences + fvg
Gold is currently reacting after a strong impulsive move. The chart highlights two potential liquidity zones for entries:
1️⃣ Upper Zone (3,350-55)
Confluence of daily + weekly pivot,
20k FVG + 1H EMA,
38–50% Fibonacci retracement.
➡️ Potential reaction zone if price retraces shallow before resuming bullish move.
2️⃣ Lower Zone (3,325–3,333)
25k FVG + monthly pivot,
78% Fibonacci retracement,
Overlap of 1H OB + 2H OB.
➡️ Stronger demand zone for a deeper pullback entry.
🎯 Bias: Bullish continuation
Looking for long setups off either zone depending on how price reacts.
Invalidation below 3,321 (last swing low).
⚠️ Note: Waiting for confirmation at the zones (candlestick structure/OB reaction) before execution.

Gold at a Critical Turning Point – CHoCH Wait Area or TrapPrice has tapped into the 4H Liquidity Area after breaking above resistance, now consolidating around the CHoCH wait zone. A decisive move from here could set the tone – either continuation towards new highs or a sharp rejection back below. Traders eyeing this setup should watch liquidity grabs and confirmation signals closely before entering.

Get ready for the week's highlights, track negotiations progressOANDA:XAUUSD prices remained generally stable, in the Asian trading session on Friday (August 22), OANDA:XAUUSD fell slightly to $3,328/oz, equivalent to a decrease of $10 on the day as of the time of writing, extending the sideways accumulation.
The focus of the week, Jackson Hole
Gold continues to consolidate, with selling pressure holding back gains around $3,350/oz. Market participants await fresh messages from policymakers at the Jackson Hole Symposium.
Today (Friday), Federal Reserve Chairman Powell will speak at the Jackson Hole Global Central Bank Annual Meeting.
If Powell says we will cut rates again in October, November or December, the dollar could weaken and gold could have a chance to rise.
Exclusive Reuters report, tracking the progress of the Russia-US-Ukraine negotiations
Reuters has published an exclusive report in which three sources close to senior Kremlin leaders told Reuters that Russian President Vladimir Putin demanded that Ukraine abandon the entire Donbas region in the east, abandon its ambitions to join NATO, remain neutral and prevent Western troops from entering Ukraine.
Last Friday, Putin met with President Trump in Alaska for the first summit between the United States and Russia in four years.
According to Reuters sources, the nearly three-hour closed-door talks between the two sides were almost entirely devoted to discussing a compromise solution to the Ukraine issue.
Standing next to Trump after the meeting, Putin said the meeting was expected to pave the way for peace in Ukraine, but neither Putin nor Trump revealed the specifics of the discussions. Reuters cited the most detailed Russian account yet of Putin’s proposal for the summit, outlining the outlines of a potential peace deal the Kremlin hopes to see.
According to Russian sources, Putin has made some concessions based on territorial demands he made in June 2024. At that time, he asked Kyiv to give up four regions that Moscow claims as part of Russia: Donetsk and Luhansk (located in eastern Ukraine, collectively known as the Donbas region), as well as Kherson and Zaporizhia in the south.
Reuters also reported that Putin maintained in his new proposal a demand for a full withdrawal of Ukrainian troops from the Donbass regions it still controls. However, they added that in return, Moscow would halt its frontline offensive in Zaporizhia and Kherson.
According to US estimates and open-source data, Russia controls about 88% of the Donbas region and 73% of the Zaporizhia and Kherson regions.
Sources said Putin also maintained his previous demands that Ukraine abandon its NATO membership bid and demanded that the US-led NATO make a legally binding commitment not to expand eastward, impose restrictions on the Ukrainian military and reach an agreement ensuring that no Western troops would be deployed as peacekeepers in Ukraine.
There remains a wide gap between the two sides’ positions. The Ukrainian Foreign Ministry has yet to respond to the proposal.
Technical analysis of OANDA:XAUUSD
Gold has been moving sideways for most of the time, so the technical structure has not changed much and the positions are also kept the same as in the previous publications sent to readers.
During the day, the technical outlook of gold price accumulation sideways will be noticed by the positions listed below.
Support: 3,310 – 3,300 – 3,292 USD
Resistance: 3,350 – 3,371 USD
SELL XAUUSD PRICE 3376 - 3374⚡️
↠↠ Stop Loss 3380
→Take Profit 1 3368
↨
→Take Profit 2 3362
BUY XAUUSD PRICE 3299 - 3301⚡️
↠↠ Stop Loss 3295
→Take Profit 1 3307
↨
→Take Profit 2 3313

GOLD eases after recovering from $3,310, data highlightsOANDA:XAUUSD edged down in Asian trade on Thursday (August 21), after a strong rally in the previous session. The current price is around $3,337/ounce, down 0.32% and around $10 on the day.
OANDA:XAUUSD edged up on Wednesday. Bloomberg News analyzed that US President Trump's call for the resignation of Federal Reserve Board member Tim Cook has raised fresh concerns about the independence of the Federal Reserve, boosting safe-haven demand and causing gold prices to rise.
On the other hand, Bloomberg also reported on Wednesday (August 20) that as gold prices have soared, the illegal gold trade has become one of the largest and fastest-growing illicit economies in the Western Hemisphere, and the U.S. government is facing pressure to step up its crackdown.
According to a report released by the Financial and Corporate Transparency Alliance (FACT) on Wednesday, the boom in illegal gold mining and trading in some South American countries has become a crisis that the United States cannot ignore.
In Colombia and Peru, two major cocaine-producing countries, illegal gold is estimated to generate more revenue for organized crime than the drug trade itself.
The Washington-based financial advocacy group has called on Congress to pass legislation to address the environmental and social impacts of illegal gold mining.
The rise of the illegal gold trade is due to a tripling of gold prices over the past decade and weak law enforcement as authorities remain focused on fighting drug trafficking.
In terms of the day’s data highlights
S&P Global will release preliminary figures for the US manufacturing and services Purchasing Managers’ Index (PMI) for August today (Thursday). This important report could have a significant impact on the direction of gold prices.
Economists expect the preliminary US S&P Global Manufacturing PMI for August to be 49.5, compared to a final reading of 49.8 in July.
In addition, the preliminary reading of the US S&P Global Services PMI for August is expected to be 54.2, compared to a final reading of 55.7 in July.
The July services PMI was 55.7, and if August data shows a sharp decline, the US Dollar could be negatively affected immediately.
On the other hand, if the manufacturing PMI recovers above 50 and the services PMI approaches July levels, the US Dollar could remain strong against other currencies, making it difficult for gold to regain its upward momentum.
Technical Outlook Analysis OANDA:XAUUSD
After receiving support from the $3,310 level, which is the support that readers have been paying attention to throughout the publications during this time, gold has recovered but the upside momentum has also been limited after testing the EMA21 line. Gold is under pressure from the EMA21, temporarily falling slightly but it may retest the $3,310 level in the short term as there is no more notable support than this level at present, followed by the full price point of $3,300.
Personally, I still maintain the view that gold will continue to move sideways and wait for a strong enough fundamental impact to change the overall technical structure.
The factors that show that gold is neutral are that it has not yet achieved the conditions for a long-term trend line, the sideways state is depicted by the green rectangle. Next is the price action clinging to the 21-day moving average, followed by the RSI moving around the 50 level, showing that the market sentiment is also hesitantly neutral without leaning to any particular side.
During the day, the technical outlook of gold price accumulation sideways will be noticed by the positions listed below.
Support: 3,310 – 3,300 – 3,292 USD
Resistance: 3,350 – 3,371 USD
SELL XAUUSD PRICE 3376 - 3374⚡️
↠↠ Stop Loss 3380
→Take Profit 1 3368
↨
→Take Profit 2 3362
BUY XAUUSD PRICE 3299 - 3301⚡️
↠↠ Stop Loss 3295
→Take Profit 1 3307
↨
→Take Profit 2 3313
Will the Fed’s dovish stance lift gold prices?
Following Fed Chair Powell’s dovish Jackson Hole remarks hinting at potential rate cuts, risk appetite in global markets revived. Powell noted that inflation has moved much closer to the target while the labor market has cooled from previously overheated levels, suggesting the Fed may need to recalibrate its policy stance. However, geopolitical risks linger as ceasefire negotiations face hurdles. Should President Trump’s proposed trilateral summit collapse, the renewed risk-on sentiment could fade quickly.
XAUUSD is consolidating within the 3300–3500 range, awaiting an additional trigger for a clear breakout. If XAUUSD holds above both EMAs, the price may gain upward momentum toward the resistance at 3500. Conversely, if XAUUSD breaks below the support at 3300, the price could retreat toward the next support at 3160.


Gold Weekly Plan: Daily FVG → H4 FVGGold closed last week with a strong impulsive move into a Daily Fair Value Gap (FVG). As we open the new week, I’ll be watching closely:
Daily FVG (3423–3451): Potential resistance and rejection zone early in the week.
H4 Bullish FVG (3390–3395): If price rejects the Daily FVG, I expect a retrace into this zone to set the weekly low between Monday and Tuesday.
From there, we could see a bullish expansion for the rest of the week.
The key question: Will Gold respect the Daily FVG as resistance before rebalancing lower, or will buyers push straight through?
What’s your bias going into the week? 🚀📉

Gold | Oil | Dollar | Silver | Natural Gas Price Forecast Support & Resistance Guide
Natural Gas NYMEX:NG1! stock Bulls AMEX:UNG
USO NYMEX:CL1! Oil Stock price Forecast
DXY US dollar Stock analysis
Gold COMEX:GC1! XAUUSD Stock price Forecast
Silver XAGUSD stock analysis

25/08/25 Gold Swing LevelsNew week, same principle.
Set your alerts. Watch the 5 mins (1 min if price spiking)
25/08/25 levels are marked
Always, price action determines trade.
Trade parameters
Entry on 5 min chart
Sl: 20-40pips
TP: 2-4x SL

The gold trend is still bullish.🔸Gold is still bullish and continued to move higher last week after hitting the marked area
🔹The marked supply areas can create resistance to the upside
🔸If the price returns to the marked lines, i.e. 3352.45 and 3336.38, low-risk buy positions can be opened
