XAUUSD GOLD OUTLOOK CHART ANALYSIS Gold (XAU/USD) Technical Outlook
Gold has been trading within an ascending channel, but recent price action suggests weakening bullish momentum near the resistance level around $3,680 – $3,700.
🔎 Key Insights:
• Price rejected resistance and is showing signs of bearish momentum.
• A breakdown below the channel could open the way to the first support near $3,600.
• If selling pressure continues, the next downside target is $3,500.
📊 Trading Plan:
• Bearish Bias below $3,680.
• Watch for confirmation on the break of $3,600.
• Short-term traders may look for selling opportunities toward $3,500.
• A sustained move above resistance would invalidate the bearish setup.
⚠️ Risk management is key – always use stop losses and adjust position sizes according to your risk tolerance
Xauusd(w)

Daily chart shows a bearish rebound; expect further declines.#XAUUSD OANDA:XAUUSD
Gold has fallen below 3735 and may continue its downward trend in the short term. Pay attention to the MA5 moving average support and the previous top and bottom conversion level of 3708. If it can hold 3712-3708, you can consider going long on gold with a light position, and the SL is given to 3700. Once it falls below 3712-3708, it may test 3685. Aggressive investors can enter in the evening, while conservative investors can wait for my specific trading strategy tomorrow.
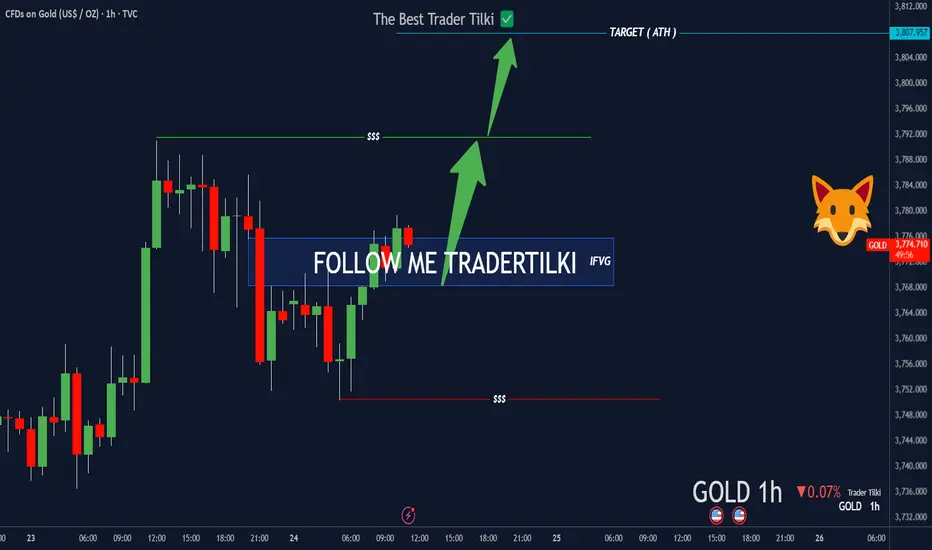
XAUUSD-Gold Game Just Changed: Post-FVG Violation SetupHey Traders,
Gold is currently sitting at 3774. From here, I’m aiming straight for 3807.
Why?
FVG got violated—we now have a clean IFVG.
That’s why my target is locked: 3807.
Set your stop-loss based on your own margin.
I believe we’ll hit that level sooner or later.
Every single like you drop keeps me motivated
to keep sharing these insights.
Big thanks to everyone supporting!
Prices fell. Has a low been reached?The daily gold chart suggests a continued bullish trend. Consecutive breakouts confirm continued upward movement. The MACD indicator remains within overbought territory, indicating a modest rise and not signaling a lack of upward momentum.
In the short term, the 4-hour chart also suggests an upward bias for gold. Technical indicators are extending gains within positive territory, with prices retreating to the middle Bollinger Band and now overlapping the 20-day moving average. The MACD indicator has formed a golden cross and is trending downward. Gold remains above the 20-day moving average. While the longer-term moving average maintains an upward trend, it remains well below the 20-day moving average. Most indicators suggest a easing of bullish momentum.
Prices are currently retreating. For stable trading, it is recommended to remain cautious and wait for a price low before entering a long position.
Of course, if aggressive trading is desired, long positions around 3725-3730 are still an option.

XAUUSD Scale In Trade Plan (ACTIVE)Had a nice retracement today following yesterday's comment from the Fed. Now just waiting for a key entry level to start scaling in longs at discount prices.

Is XAUUSD Setting for drop?there is reversal patter on GOLD with potenial previous daily support to break. Market may continue to drop to fill the dialy fair value gap followed by 4h fair value gap may lead the price to continue to drop to support level.

XAUUSD SELL 3780**XAUUSD SELL 3780 Trading View Idea** In this analysis, we’re focusing on the XAUUSD (Gold vs. US Dollar) currency pair, with a sell opportunity identified at the 3780 level. Here’s a detailed breakdown of the reasoning behind this trading idea: **Market Overview:** Gold is often seen as a safe-haven asset, particularly in times of economic uncertainty. As we analyse the current market conditions, it’s important to consider global economic indicators, inflation rates, and geopolitical factors that influence gold prices. **Technical Analysis:** 1. **Resistance Level:** The 3780 marks a significant resistance level, where previous price action has shown a tendency to reverse. Observing the price behaviour around this level can provide insight into market sentiment. 2. **Moving Averages:** The short-term and long-term moving averages can help confirm the bearish sentiment. If the short-term moving average crosses below the long-term moving average near this resistance level, it further strengthens the sell signal. 3. **RSI and MACD Indicators:** The Relative Strength Index (RSI) near the overbought territory indicates that a correction may be due. Similarly, a bearish crossover on the MACD can affirm the selling pressure building up. **Fundamental Factors:** Economic reports and news releases can have significant impacts on the gold market. Keep an eye on upcoming economic data, including: - **US Federal Reserve Announcements:** Interest rate decisions and economic outlooks can lead to volatility in gold prices. - **Inflation Data:** Higher inflation rates typically boost gold prices, while signs of economic stabilisation could lead to a pullback. - **Geopolitical Tensions:** Any escalations in geopolitical issues can drive traders towards gold as a safe-haven asset. **Trading Strategy:** - **Entry Point:** Sell at 3780 with a strict stop-loss set above the resistance level to manage risk effectively. - **Take Profit Levels:** Identify key support levels below 3780 to establish take profit points, possibly around 3700 or lower, depending on market conditions. **Risk Management:** It’s crucial to have a risk management plan in place. Evaluate your risk tolerance and adjust your position size accordingly to ensure that potential losses are manageable.

XAUUSD Analysis todayHello traders, this is a complete multiple timeframe analysis of this pair. We see could find significant trading opportunities as per analysis upon price action confirmation we may take this trade. Smash the like button if you find value in this analysis and drop a comment if you have any questions or let me know which pair to cover in my next analysis.

GOLD 4H CHART ROUTE MAP UPDATEHey Everyone,
Please see update on our 4H chart idea after completing our 1H chart idea yesterday.
This chart is also playing out analysed. We got our Bullish target hit at 3696 followed with ema5 cross and lock opening 3738. This target was also hit with a further cross and lock opening 3778. 3778 now completed with no further cross and lock confirming the rejection.
We will now use lower Goldturns for support and Bounce until we see further cross and lock above for a continuation.
We will keep the above in mind when taking buys from dips. Our updated levels and weighted levels will allow us to track the movement down and then catch bounces up.
We will continue to buy dips using our support levels taking 20 to 40 pips. As stated before each of our level structures give 20 to 40 pip bounces, which is enough for a nice entry and exit. If you back test the levels we shared every week for the past 24 months, you can see how effectively they were used to trade with or against short/mid term swings and trends.
The swing range give bigger bounces then our weighted levels that's the difference between weighted levels and swing ranges.
BULLISH TARGET
3696 - DONE
EMA5 CROSS AND LOCK ABOVE 3696 WILL OPEN THE FOLLOWING BULLISH TARGETS
3738 - DONE
EMA5 CROSS AND LOCK ABOVE 3738 WILL OPEN THE FOLLOWING BULLISH TARGET
3778 - DONE
EMA5 CROSS AND LOCK ABOVE 3778 WILL OPEN THE FOLLOWING BULLISH TARGET
3811 -
EMA5 CROSS AND LOCK ABOVE 3811 WILL OPEN THE FOLLOWING BULLISH TARGET
3845
BEARISH TARGETS
3655
EMA5 CROSS AND LOCK BELOW 3655 WILL OPEN THE FOLLOWING BEARISH TARGET
3615
EMA5 CROSS AND LOCK BELOW 3615 WILL OPEN THE FOLLOWING BEARISH TARGET
3583
EMA5 CROSS AND LOCK BELOW 3583 WILL OPEN THE SWING RANGE
3546
3509
EMA5 CROSS AND LOCK BELOW 3509 WILL OPEN THE SECONDARY SWING RANGE
3458
3409
As always, we will keep you all updated with regular updates throughout the week and how we manage the active ideas and setups. Thank you all for your likes, comments and follows, we really appreciate it!
Mr Gold
GoldViewFX

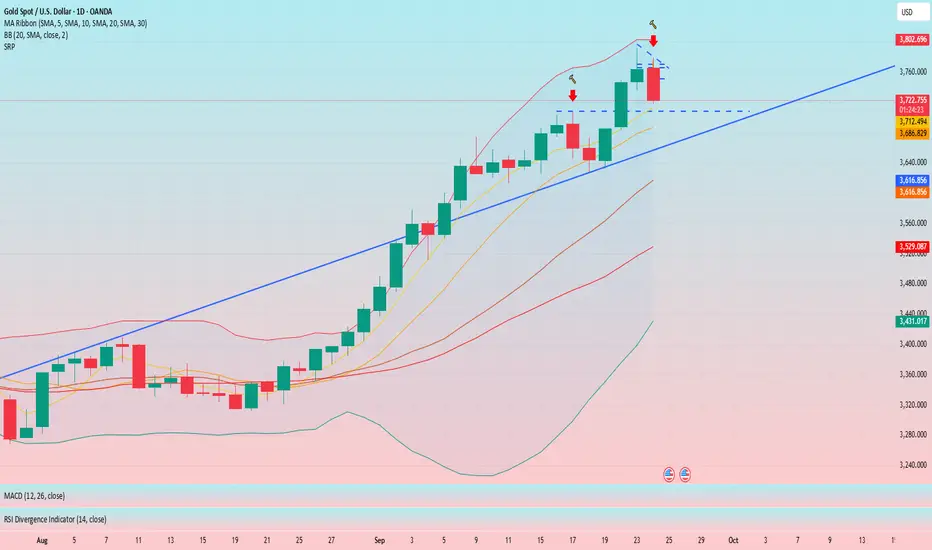
Gold Buyers Face ResistanceHi traders and investors!
This analysis is based on the Initiative Analysis concept (IA).
The last daily candle showed strong volume and a long upper wick — indicating that the buyer met resistance from the seller.
Looking at the 1-hour timeframe, the price has formed a sideways range.
It’s better to look for long setups after the buyer defends the lower boundary of this range - 3736.
However, it’s also possible that the price will drop lower — down to the 50% level of the daily buyer initiative, which is 3709.608.
This expectation is based on several factors:
the extended buyer trend on the daily timeframe (a pause might be needed),
signs of seller resistance (as shown by the long upper wick on the last daily candle),
and the fact that the sideways range on the 1H chart has expanded significantly to the upside — ideally, the price would move just as far below the range for balance.
By the way, the 50% level of the daily buyer initiative almost coincides with the level of the last breakout on the daily chart.
Wishing you profitable trades!

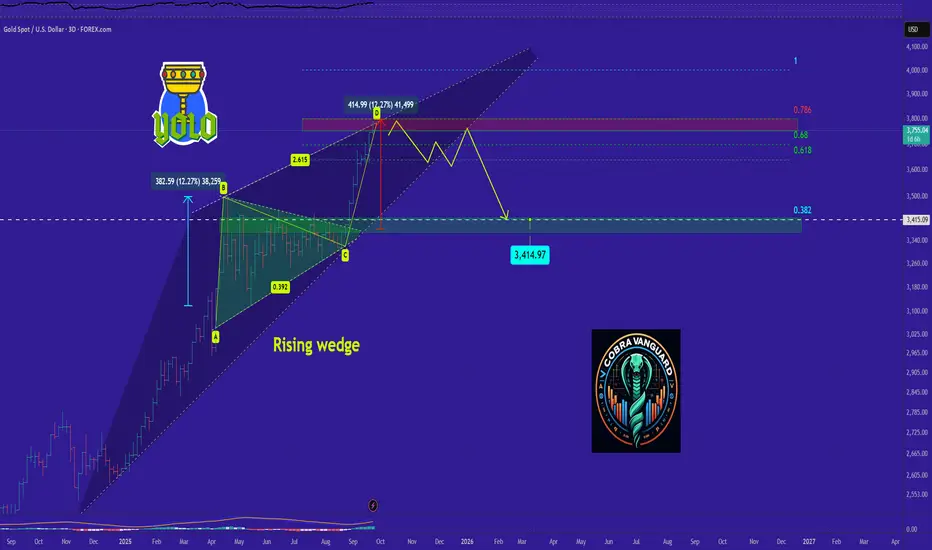
GOLD is bearish now and many Traders don't see it !!As you can see, the price is within a descending wedge, and it has reached the upper boundary of this wedge. According to technical analysis patterns, the price has closely followed the AB=CD pattern, indicating a need for a slight correction. In the coming days, the price may range within this wedge, and if the pattern breaks, the price could drop to the Fibonacci levels shown.
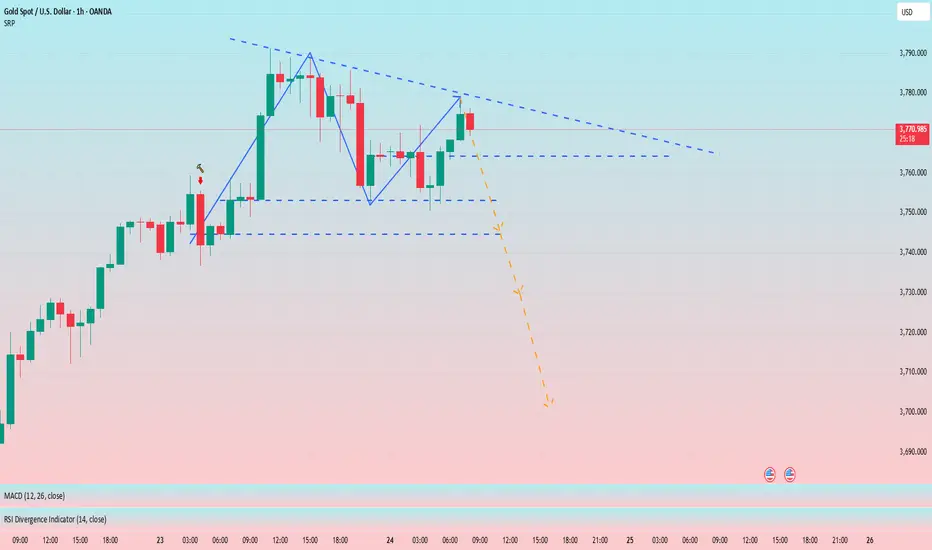
If the price remains below 3780, continue short selling.The daily chart closed with a long upper shadow, indicating a clear technical need for a correction. The Asian session fell as expected in the morning, repeatedly testing 3750. Those who followed the short selling could basically get nearly 150pips profit. Although a bullish structure appears in the hourly chart, the trend pressure above 3780 is still there in the short term. If gold fails to effectively break the trend pressure, it will fall back in the short term. The first support below can be seen at 3750. Once it falls below, gold will test the support of 3735. Currently, gold has rebounded again. As long as it fails to effectively break through and stabilize above 3780, we can still consider shorting gold.

GOLD: Bullish Continuation & Long Signal
GOLD
- Classic bullish setup
- Our team expects bullish continuation
SUGGESTED TRADE:
Swing Trade
Long GOLD
Entry Point - 3756.7
Stop Loss - 3751.5
Take Profit - 3768.4
Our Risk - 1%
Start protection of your profits from lower levels
Disclosure: I am part of Trade Nation's Influencer program and receive a monthly fee for using their TradingView charts in my analysis.
❤️ Please, support our work with like & comment! ❤️

GOLD Free Signal! Sell!
Hello,Traders!
GOLD is trading in a strong uptrend. And it is oversold now, so as the price has formed a double top pattern, we will be expecting a bearish correction. The confirmation for the entry will be the breakout of the neckline.
------------------
Stop Loss: 3,791$
Take Profit: 3,710$
Entry: 3,754$
Time Frame: 3H
------------------
Sell!
Comment and subscribe to help us grow!
Check out other forecasts below too!
Disclosure: I am part of Trade Nation's Influencer program and receive a monthly fee for using their TradingView charts in my analysis.

Gold 1H – Inflation Fears & Risk Flows Drive MomentumGold on the 1H timeframe is trading around 3,753 after repeated BOS confirmations, showing strong bullish structure but facing premium resistance. Liquidity remains stacked above 3,787–3,785, while discount demand zones sit lower at 3,725–3,723 and deeper at 3,688–3,686.
Today’s headlines on sticky U.S. inflation expectations and renewed geopolitical tensions in Eastern Europe are fueling safe-haven demand, but intraday structure suggests engineered sweeps into resistance before retracement into demand zones.
________________________________________
📌 Key Structure & Liquidity Zones (1H):
• 🔴 SELL SCALP 3,787–3,785 (SL 3,794): Premium resistance where liquidity sweeps may trigger short-term rejections targeting 3,780 → 3,775 → 3,770.
• 🟢 BUY ZONE 3,725–3,723 (SL 3,718): Pullback entry aligned with BOS structure, offering upside targeting 3,740 → 3,755 → 3,770+.
• 🟢 BUY ZONE 3,688–3,686 (SL 3,680): Deeper discount demand, attractive for dip buys targeting 3,700 → 3,715 → 3,730+.
________________________________________
📊 Trading Ideas (Scenario-Based):
🔺 Buy Setup – Pullback Entry (3,725–3,723)
• Entry: 3,725–3,723
• Stop Loss: 3,718
• Take Profits:
TP1: 3,740
TP2: 3,755
TP3: 3,770+
🔺 Buy Setup – Discount Demand (3,688–3,686)
• Entry: 3,688–3,686
• Stop Loss: 3,680
• Take Profits:
TP1: 3,700
TP2: 3,715
TP3: 3,730+
🔻 Sell Setup – Liquidity Run (3,787–3,785)
• Entry: 3,787–3,785
• Stop Loss: 3,794
• Take Profits:
TP1: 3,780
TP2: 3,775
TP3: 3,770
________________________________________
🔑 Strategy Note
With inflation concerns heating up and geopolitical risks sustaining safe-haven flows, the broader trend remains bullish. Smart money may engineer stop-runs into premium resistance before retracements into discount zones. Focus on buy-the-dip opportunities at well-defined supports, while fading liquidity sweeps cautiously near 3,787–3,785. Expect intraday volatility as markets react to U.S. inflation chatter and risk-off headlines.

XAU/USD | GOLD Breaking Records – $4K Target Loading…!By analyzing the TVC:GOLD chart on the 1-hour timeframe, we can see that nothing seems to be stopping its series of new record highs — it almost feels like the $4,000 target isn’t too far away! Every small correction in gold is simply gathering more liquidity and demand to push toward higher levels.
At this very moment, gold has printed a new ATH at $ 3,734 , and I expect the rally to continue. The next possible upside targets are $3,740, $3,780, and $3,800.
THE MAIN ANALYSIS :
Please support me with your likes and comments to motivate me to share more analysis with you and share your opinion about the possible trend of this chart with me !
Best Regards , Arman Shaban

Gold operation strategy, firmly bullish and unwaveringCurrently, gold's technical indicators still show an overbought condition, given its recent sharp upward trend. Therefore, some correction is expected. Support remains at the low level of 3746-3754. If this level is broken, a new downward trend could emerge in the short term. Overall, the upward momentum hasn't yet dissipated, but consolidation at these high levels could lead to a potential reversal. After yesterday's attempt to break through 3791, the bullish momentum weakened, requiring a brief pullback. Gold's upward trend pattern generally follows a "three steps forward, one step back" pattern, aiming for new highs. With both the international market and technical indicators pointing to further gains, the probability of a sustained downward correction is very low. Therefore, our trading strategy for today remains to buy on dips.
From the 4-hour analysis, the effective support below is maintained at around 3746-54, and the upper pressure is focused on the 3800 line. The operation is mainly to go long on pullbacks. For the middle position, watch more and do less, be cautious in chasing orders, and wait patiently for key points to enter the market.
Gold Trading Strategy:
Buy on dips at 3756-60; add to positions on dips at 3746-50; stop loss at 3738; target 3790-3800.

gold on sideway until breakout#XAUUSD we await for 3778 breakout to buy, first target above 3790 which if H1 closes above there will continue till 3800.
Below the 3763 breakout on M30 close price will drop till 3756-3750 which has rejection to buy. But breakout and H1 close below 3748 price is full bearish.

XAUUSD Yesterday Trade Update 30MXAUUSD Yesterday Trade Update 30M Projection.
XAUUSD is currently SELL side.

Hack Gold. Win Fast. Inside XAUUSD trading secrets.
⚡ If you just chose Gold to trade, listen up. This market doesn’t forgive.
It’s fast, brutal, violent, yet equally rewarding. But if you don’t know what you are doing, it will chew you up and spit you out before you even finish your first coffee.
Here are 5 Hacks to help you every single day instead of the same Mistakes that keep new traders in losses, frustrated, and blaming “manipulation” instead of fixing their own game:
🔔1. Trading Blind With Zero Knowledge
Everyone wants quick cash, and most traders do not want to study. If you don’t know about liquidity, order blocks, or imbalances, you are just guessing. And Gold punishes guesses.
Copying random signals online won’t save you. You need a system, discipline, and screen time. Period.
🔥HACK 1: Learn the game before you risk the money. Demo, daily chart study & repeat hundreds of times. If you treat this like a casino, you will always leave broke.
✨2. Pretending Risk Management Is Optional
This one kills more accounts than anything else. No stop loss, no take profit, just “I’ll close it when it comes back.” And then the market doesn’t come back. Sometimes ever.
Gold can drop 300 pips in minutes, and if you are sitting unprotected, you will blow up faster than you can blink.
🔥HACK 2: Risk max 0.3 per trade. Place your SL. Place your TP or watch profits like a hawk. And if you don’t know where to place them, you are not ready to trade real money. Find real premium help, not fake flashy plastic scams.
💥3. Loading the Gun With Too Many Trades
Gold moves fast. One wrong click, and if you are stacked with five positions, you are done.
I have seen traders open buys, sells, hedges, all at once, thinking they are “diversified.” No. You are just multiplying risk. A 1% move against you and XAUUSD can wipe your entire account if you are over-leveraged.
🔥 HACK 3: Stick to one clean setup, manage the size, and stop spraying bullets like you are in an arcade game.
🔴4. FOMO Buying Tops (and Selling Bottoms)
Gold hits a new high. Like yesterday. Traders scream “To the moon!” You panic and click Buy. Two minutes later, your drawdown hits rock bottom. Happens all the time.
FOMO is the fastest way to donate your money to smarter traders.
🔥HACK 4: Plan your trades before the price gets there. If you were not ready before the move, you missed it. Accept it. The market is not closing tomorrow or ever.
😡5. Revenge Trading Like a Maniac
You take a loss. Then your brain screams: “I’ll get it back!” So you double the next position. Then triple. Guess what? XAUUSD is so volatile that it will run over your feelings and leave you in depression. You are not getting your money back, just gaining more anxiety and daily stress.
🔥HACK 5: Close the platform. Step away. One good trade tomorrow is worth more than five revenge trades today.
🖊️Homework:
Memorize your hacks, stick them on a post-it by your screen, in your wallet, and read them as many times as needed; learn them like a mantra. Daily.
If this article helped you today and brought you more clarity:
Drop a 🚀 and follow us✅ for more trading ideas and trading psychology. Thank you.

#GOLD NewforcastOANDA:XAUUSD continues to climb upward channel.
If price holds above 3747, the breakout projection targets the zone above 3800 resistance.
risks:3747 - 3700
3800 My trigger profit - taking and short -term pullbacks.

Continue to short on rebound, expect a big drop#XAUUSD OANDA:XAUUSD
The daily line closed with a long upper shadow bullish candlestick, the price deviated significantly from the moving average, and the need for technical adjustment was obvious; the four-hour chart simultaneously released a callback signal, the probability of bulls "resting" in the short term increased greatly, and a wave of adjustments was ready to go! Investors should be wary of this potential pullback risk. For the bears to trigger a significant decline, the key support level of 3735 must be broken; otherwise, gold is likely to rebound.
XAUUSD – Demand Holding, Eyes on Weak HighPrice is reacting from a demand zone around 3750–3760 after a clean drop. This area has held well in the past, and the strong low is still intact, suggesting buyers may step in again. Price is also near the lower boundary of a bullish channel, which adds to the confluence for a possible move higher.
There’s a weak high around 3779 that could be a target for liquidity. If price holds above the current support zone, we could see a push toward 3765, then 3770–3779.
This idea will be invalid if the current strong low at 3750 is broken.
