Gold Pullback Toward 3,700 Within Ongoing UptrendHey Traders, in today's trading session we are monitoring XAUUSD (Gold) for a buying opportunity around the 3,700 zone. Gold is trading in an uptrend, with price currently correcting toward this key support/resistance level.
Structure: The broader bias remains bullish, but price is retracing after recent highs.
Key level in focus: 3,700 — a critical area where buyers may look to step in and resume the upward move.
Fundamentals: Softer USD sentiment and steady safe-haven demand continue to favor the bullish case for Gold on dips.
Trade safe,
Joe.
Xauusd(w)

XAUUSD (16-9-25 @ 10:54pm)
1. In 4 hours chart, OB and FVG peding to be sweept before go higher.
2. Zone 3665 to 3650 become a strong POI zone which FIBO 0.618 + OB + support zone existed.
Conclusion
Wait price come to POI zone and long entry

Global news might have us Stalling on Gold! Chart Context (MGC Futures, H1/H4)
Price stalled out after rejecting the H4 bearish zone (3791.4–3769.9).
Yesterday’s downside move lost steam before fully reaching the deeper H4 bullish demand (3746.3–3735.2).
We’re now compressing between Daily High (3792.1) and Daily Low (3752.0).
Fundamentals:
U.S. geopolitical/military headlines (Defense Secretary Pete Hegseth ordering hundreds of generals/admirals to an urgent meeting at Quantico, Sep 30) are creating uncertainty, which could trigger safe-haven flows in gold.
Bias Going Into Friday:
Watching for liquidity sweep of yesterday’s lows (~3752/DL). If swept and reclaimed, could trigger bullish continuation.
Alternatively, a clean break & hold above yesterday’s high (~3792/DH) sets up momentum longs targeting 3812+ (previous imbalance).
No trade in the middle of the chop — patience until liquidity is taken on one side.

GOLD BULLISH BIAS|LONG|
✅XAUUSD Price forms a bullish flag above the wide demand area, showing ICT displacement. Smart Money likely drives momentum toward liquidity resting at 3,780$. Time Frame 3H.
LONG🚀
✅Like and subscribe to never miss a new idea!✅

Tension at the Top – Will Gold Crack the Supply Wall or Fade BacHello traders 👋
Price is hovering at 3754, just beneath a key liquidity shelf and staring straight into premium resistance. Bulls have kept structure clean, but the real test is moments away. Today’s battle is shaped between a hardened supply above and a fresh demand pocket waiting below. This is a sniper’s day — let’s map it tactically 👇
🔹 HTF Structural Zones (D1, H4, H1 – wide institutional ranges)
🟥 Supply Zone (D1 OB) → 3770–3780
The last valid bearish OB on D1, untouched since formation. This is where previous rallies failed. Imbalance + FVG inside, aligned with RSI H1 overbought. Any return here requires extreme caution for bulls.
🟦 Demand Zone (H1–H4 confluence) → 3732–3726
The last bullish reaction base before the push toward 3761. Protected by EMA 21 + 50 (Dynamic EMA Flow). Clean structure, built with absorption and demand reloading. RSI shows bullish divergence on M30. Expect reactions if tapped.
⚪ Decision Zone (Intraday Control Shelf) → 3744–3740
The zone that separates continuation from correction. Price has defended this shelf three times, making it the intraday line of control. Below it → buyers lose momentum. Above it → bulls stay in charge.
🎯 Precision Zones (Execution Focus)
🟦 Long setups only inside 3732–3726
🟥 Short setups only after rejection inside 3770–3780
⚪ Control flips decisively in 3744–3740
🎲 Scenarios
🟢 Bullish Setup
Hold above 3744–3740 → push through 3758
Sweep and close above 3761 → price targets 3770–3780
Acceptance inside OB → extension toward 3810
🟥 Bearish Setup
Tap or sweep 3761, reject from 3770–3780
Reclaim 3758 → 3744 → break below decision zone
Loss of 3740 opens the gate for 3732–3726, with risk of deeper dive to 3698
🗺️ Tactical Map Summary
🟦 Potential Buy Zone: 3732–3726 (discount sniper zone)
🟥 Potential Sell Zone: 3770–3780 (premium OB supply)
⚪ Decision Zone: 3744–3740 (intraday control line)
🧩 Conclusion
Gold stands between two power zones. Bulls still lead, but they’re knocking at a door guarded by old supply. Today’s direction flips inside the 3744–3740 control zone. Patience is power. Wait for the reaction. Strike with confirmation.
Drop your thoughts in the comments, smash the like button, and hit follow on GoldFxMinds for more daily sniper plans. Let’s keep building this edge together 🚀✨

XAUUSD BUY 3734Here’s a sharp TradingView idea description for your XAUUSD Buy at 3734 setup, tailored for engagement and clarity:
🟢 XAUUSD Buy Setup – Targeting Upside from 3734
Gold is showing bullish momentum after a key support retest near 3734. Price action confirms a potential reversal zone with confluence from:
- 🔹 Fibonacci retracement aligning with 3734 (golden pocket zone)
- 🔹 Bullish engulfing candle on 4H chart
- 🔹 RSI bounce from oversold territory
- 🔹 MACD crossover signaling upward momentum
📈 Trade Plan:
- Entry: 3734
- Stop Loss
- Take Profit Zones
This setup favors a disciplined risk/reward approach. Watch for volume confirmation and news catalysts (e.g., Fed commentary or geopolitical tension) that could accelerate gold’s move.

Will Gold Buyers Defend 3725 for a Quick Move to 3750?Gold is showing signs of stability after recent price fluctuations, and a potential swing trade opportunity is forming. Buyers are attempting to defend the short-term support zone, which may encourage momentum toward the next resistance levels.
Key Levels:
Buy Entry Point: 3725
Take Profit: 3750
Stop Loss: 3710
Reasoning:
The price has been consolidating near support, and a bounce from this area aligns with the prevailing short-term bullish momentum. Protecting the trade with a stop at 3710 reduces risk in case of breakdown, while the upside target at 3750 captures the next logical resistance area.
Disclaimer:
This analysis is for educational purposes only and not financial advice. Markets are volatile manage your risk carefully and trade according to your own strategy.

The bearish trend will continue unless the price rises above3765#XAUUSD OANDA:XAUUSD
Gold closed with a negative daily line, reaching a low of around 3717. If today's closing daily line falls below the MA5 moving average and touches the MA10 moving average, we need to be alert that the bears may dominate the market again tomorrow, Friday.
The downward trend is still under pressure during the day, and trading is still mainly short-selling. The immediate resistance level to watch is 3748-3750, which also marks the boundary of the triangle pattern; a touch of this level could signal a short-selling opportunity. Further pay attention to the trend pressure of 3765. As long as this point is not broken, the short trend of gold will not change. Pay attention to the short-term support of 3735-3720 below. You can go long on gold if it is not broken on the first pullback.

DXY at a Critical Juncture — What’s the Fed’s Next MoveHey Guys,
I’ve put together a swing-style analysis for the DXY.
This one’s been highly requested — my followers are valuable to me, and I never turn them down.
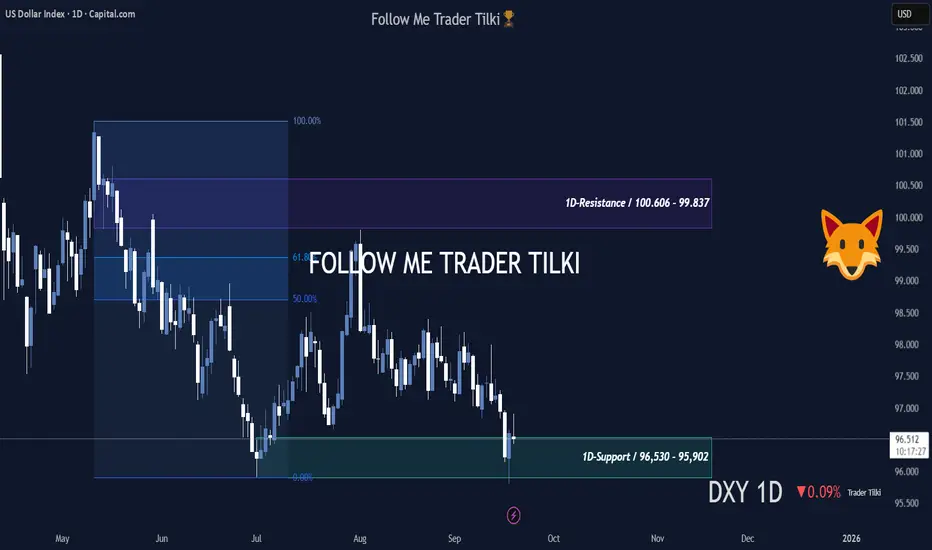
DXY Daily Levels:
- Resistance: 100.606 – 99.837
- Support: 96.530 – 95.902
From a fundamental perspective, the U.S. Dollar Index is currently dropping due to Fed policies.
No steps are being taken to push the dollar higher.
Because of this, investors are choosing gold as a safe haven instead of buying dollars.
Gold keeps hitting new ATHs, and naturally, the dollar index is sliding.
Unless the Fed takes action to support the dollar, this decline will continue.
In short, the drop in the dollar is entirely due to the policies implemented by the Fed Chair.
Remember — DXY isn’t heavily influenced by technical analysis; it’s driven by Fed policy.
That said, since the index has fallen so much, I believe we might see some steps taken in the coming months to lift the dollar.
I’ll be sharing updates right here.📢
Once support or resistance levels are broken, I’ll post new insights immediately.
Every like from you is my biggest motivation to keep sharing these analyses.
Thanks to all my friends who support me — you’re the best. ❤️
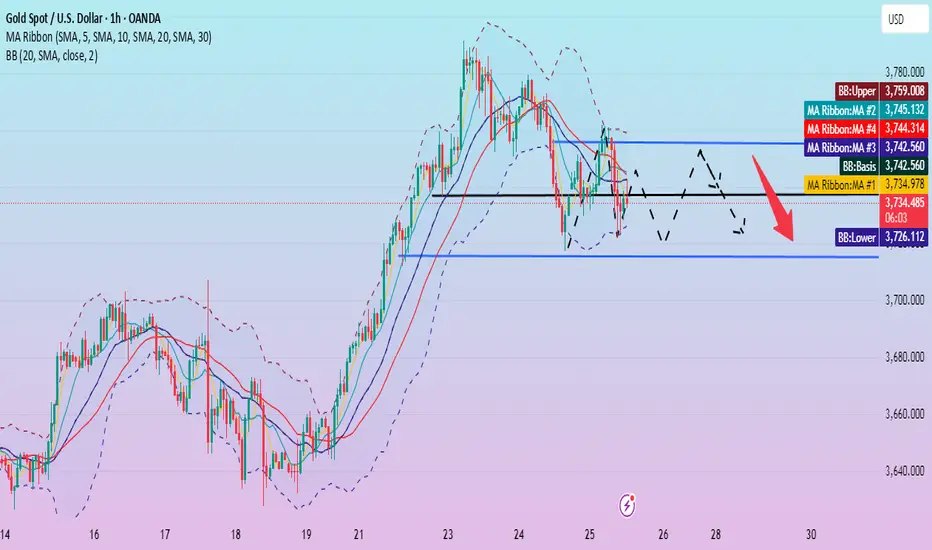
Is the correction over? Has the low been reached?This price correction began near the upper Bollinger Band at 3760, reaching a low near the lower Bollinger Band at 3722. It's currently rebounding slightly and trading near the middle Bollinger Band. The 1-hour MA20 moving average is converging with the middle Bollinger Band, indicating the possibility of further price adjustments in the short term.
Gold's 1-hour moving average is sloping downward, and the price is currently fluctuating around the low of 3735. Despite the bearish US initial jobless claims data, gold prices did not fall. Instead, they rebounded from around 3722 to 3745 before falling under pressure. As of now, it has not broken through the important support level of 3715. This level is a key focus in the short term.
From the 4-hour perspective, the effective support below is still maintained around 3715, which is consistent with the 1-hour line support. The upper pressure is focused around 3755. The short-term operation strategy of maintaining range fluctuations remains unchanged.
Trading strategy:
Go long around 3715, stop loss at 3705, profit range 3740-3750.
Short around 3755, stop loss at 3765, profit range 3725-3710.
Gold breaks records and tops out: Where next?Gold achieved a historic breakthrough to $3,759 per ounce, potentially driven by an unusual "barbell strategy" where investors simultaneously bought risk assets while hedging against systemic risks.
On the one hand, continued expectations for two additional rate cuts by year-end supported non-yielding assets. On the other hand, political uncertainty increases as Trump prepares to meet with lawmakers on funding proposals. The probability of a Gov shutdown approaches 70% by October 1st, which would force the FOMC into a 'blind' meeting in October.
Technicals
The short-term setup shows a double top formation at $3,759, suggesting potential consolidation rather than immediate continuation.
Resistance Levels : $3,800 is a critical resistance, both a Fibonacci extension cluster and a psychological level
Support Levels :
Immediate support at $3,740 (breakout confirmation level)
Secondary support at $3,700-$3,730 (previous consolidation zone)
Deeper pullback potential to $3,673 (61.8% Fibonacci retracement)
Wave Structure : Elliott waves suggest completion of a potential Wave 3, with consolidation expected before a possible fifth wave extension toward $3,785-$3,800
Forward Outlook
The setup favours consolidation over the remainder of the week, with key events including Fed Chair Powell's speech and Friday's PCE inflation data serving as potential catalysts for the next directional move.
The momentum divergences suggest limited downside risk from current levels, making any pullback toward $3,700-$3,740 a potential buying opportunity for the anticipated final leg higher toward the $3,800 resistance zone.
Risk management remains crucial given the proximity to potential reversal levels and the unusual nature of gold's correlation with equity strength.
This content is not directed to residents of the EU or UK. Any opinions, news, research, analyses, prices or other information contained on this website is provided as general market commentary and does not constitute investment advice. ThinkMarkets will not accept liability for any loss or damage including, without limitation, to any loss of profit which may arise directly or indirectly from use of or reliance on such information.

GOLD 4H CHART ROUTE MAP UPDATEHey Everyone,
Quick follow-up on yesterday’s 4H chart setup.
We successfully hit 3 of our projected targets and are currently consolidating within the 3778–3738 range. The bounce from the 3738 support zone (Goldturn) played out exactly as anticipated, providing solid entries.
Next phase: we’ll monitor for a EMA5 cross and lock above/below either boundary to define the next actionable trading range.
We will continue to buy dips using our support levels taking 20 to 40 pips. As stated before each of our level structures give 20 to 40 pip bounces, which is enough for a nice entry and exit. If you back test the levels we shared every week for the past 24 months, you can see how effectively they were used to trade with or against short/mid term swings and trends.
The swing range give bigger bounces then our weighted levels that's the difference between weighted levels and swing ranges.
BULLISH TARGET
3696 - DONE
EMA5 CROSS AND LOCK ABOVE 3696 WILL OPEN THE FOLLOWING BULLISH TARGETS
3738 - DONE
EMA5 CROSS AND LOCK ABOVE 3738 WILL OPEN THE FOLLOWING BULLISH TARGET
3778 - DONE
EMA5 CROSS AND LOCK ABOVE 3778 WILL OPEN THE FOLLOWING BULLISH TARGET
3811 -
EMA5 CROSS AND LOCK ABOVE 3811 WILL OPEN THE FOLLOWING BULLISH TARGET
3845
BEARISH TARGETS
3655
EMA5 CROSS AND LOCK BELOW 3655 WILL OPEN THE FOLLOWING BEARISH TARGET
3615
EMA5 CROSS AND LOCK BELOW 3615 WILL OPEN THE FOLLOWING BEARISH TARGET
3583
EMA5 CROSS AND LOCK BELOW 3583 WILL OPEN THE SWING RANGE
3546
3509
EMA5 CROSS AND LOCK BELOW 3509 WILL OPEN THE SECONDARY SWING RANGE
3458
3409
As always, we will keep you all updated with regular updates throughout the week and how we manage the active ideas and setups. Thank you all for your likes, comments and follows, we really appreciate it!
Mr Gold
GoldViewFX

Gold Buyers Eye 3800 – Can Support Hold?Gold (XAUUSD) is showing strength after finding support at 3750. Buyers are defending this key area, and price action suggests a potential continuation move toward the 3800 resistance zone. This trade idea outlines a clean swing setup with clear entry, stop loss, and take profit levels.
Key Levels:
Buy Entry: 3750
Take Profit: 3800
Stop Loss: 3730
Reasoning:
Price is consolidating above 3750 support, showing signs of accumulation. Momentum indicators and short-term structure suggest bullish continuation. If buyers hold this level, the path toward 3800 becomes favorable. The stop loss at 3730 protects from downside volatility, while the 3800 target aligns with the next resistance level.
Disclaimer:
This analysis is for educational purposes only and does not constitute financial advice. Trading carries risks, and traders should apply their own judgment and risk management.

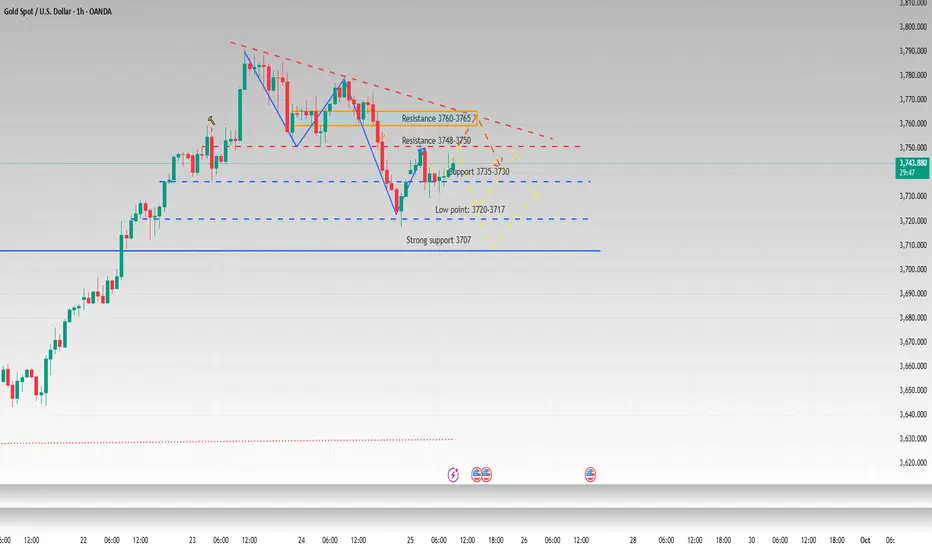
XAUUSD 1H – Potential Bullish Reversal from SupportPrice has reacted from a well-defined support zone between 3730 – 3717, respecting the current strong low and showing signs of a potential bullish reversal. This bounce suggests a possible move back toward the resistance zone near 3760, which aligns with a weak high and descending trendline. If momentum continues, a break above this resistance could signal a short-term shift in structure.
However, this setup will be invalid if the current strong low is broken, as that would confirm continuation of the broader bearish trend. Until then, I’ll be watching for bullish confirmation from support for a possible move toward the 3760 resistance level.

GOLD Breakout Done , Short Setup Valid To Get 200 Pips !Here is My 30 Mins Gold Chart , and here is my opinion , we finally Below 3750.00 With 4H Candle ! and we have a 4H Candle closure below it And Perfect Breakout and this give us a very good confirmation , so we have a good confirmation now to can sell after the price go back to retest the broken area 3750.00 , and we can targeting 100 to 200 pips . if we have a daily closure above this area this mean this idea will not be valid anymore .
Reasons To Enter :
1- Perfect Touch For The Area .
2- Clear Bearish Price Action .
3- Bigger T.F Giving Good Bearish P.A .
4- Over Bought .
5- Perfect 30 Mins Closure .

Gold Price Outlook Demand Zone Reversal PotentialThis XAUUSD (Gold vs USD) 30-minute chart shows a recent bearish move after multiple change-of-character (CHoCH) signals, pushing price back toward the highlighted blue demand zone. The projection suggests a potential bounce from this demand area, with buyers expected to step in and drive price upward toward the red supply zone above. If the demand holds, the bullish move could target levels around 3,760–3,780, aligning with the marked liquidity and fair value gap (FVG) zones.

GOLD Bearish Breakout!
HI,Traders !
#GOLD made a bearish
Breakout of the key horizontal
Level of 3750.17 and the
Breakout is confirmed so
We are bearish biased and
We will be expecting a
Further bearish move down !
Comment and subscribe to help us grow !

TraderTilki Gold Play: Double Sell, One TargetGood morning, Traders
Back again with my gold analysis.
Right now, gold has a clear target at 3700. It’ll either reach it straight from the 3736 level, or after a move up to 3768.
I’m opening a sell from here, aiming for 3700. If price pushes up to 3768, I’ll open another sell there—same target, 3700.
Gold will absolutely hit 3700.
Once it does, I’ll update you again.
My friends, every single like from you is my biggest motivation to keep sharing these analyses.
Huge thanks to all of you who support me with your likes.

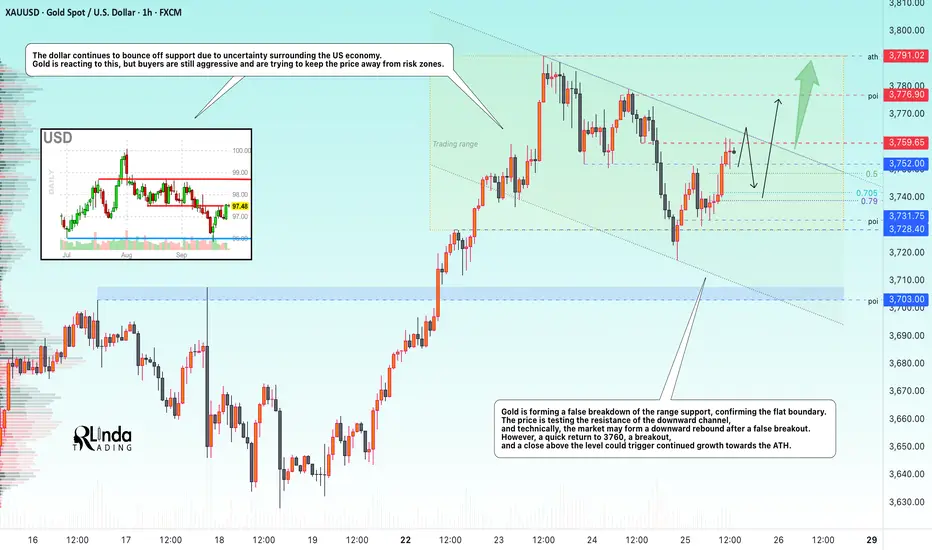
GOLD → Will the correction continue, or is it time for growth?FX:XAUUSD is inside a descending channel—corrections within a global bullish trend. The price is forming a retest of resistance, and the market's reaction to the 3760 zone will give further insight into price movement...
Gold is consolidating in the range of 3730-3790 in anticipation of US economic data and speeches by Fed officials. Pressure on the metal is intensifying due to revised expectations for rate cuts and a correction in the dollar...
Key factors: Markets have reduced expectations for easing to 43 bps by the end of the year after cautious comments from the Fed. The dollar index has reached a 9-day high, limiting gold's growth. Tensions between Russia and NATO are preventing gold from falling.
The market is in wait-and-see mode ahead of tomorrow's PCE data. Strong data today will strengthen the dollar and reinforce the correction in the metal, while escalating geopolitics will bring back demand for safe havens.
Resistance levels: 3760, 3776, 3791
Support levels: 3752, 3741, 3731
Technically, the market is testing downward resistance. Since the opening of the session, the price has already moved a lot and there may not be enough potential for an initial breakout. I expect a pullback to 3745-3740, and if the bulls return the price to 3760, the market will have a chance to break through resistance and continue growing towards the resistance level of the range.
Best regards, R. Linda!
GOLD – Dollar Strength Weighs as Market Awaits PCE DataGOLD – Overview
Gold eased in early trading as a stronger U.S. dollar weighed on prices after Fed Chair Jerome Powell struck a cautious tone on further rate cuts in his Tuesday speech.
Looking ahead, Friday’s U.S. PCE inflation data will be key—softer numbers could revive expectations for additional monetary easing and help gold reclaim recent highs.
Technical View
Gold is stabilizing below the pivot line at 3,770, keeping short-term pressure on the downside.
Bearish Scenario:
As long as price trades below 3,770, the metal is likely to continue its bearish correction toward 3,754 → 3,739.
A confirmed 15-min close below 3,739 would open the way to deeper support at 3,714.
Bullish Scenario:
A confirmed 1H close above 3,787 would invalidate the correction and signal a push toward 3,801 → 3,807.
Key Levels
Pivot: 3,770
Resistance: 3,780 – 3,800 – 3,806
Support: 3,754 – 3,739 – 3,714

The trend has not changed, continue to shortAfter yesterday's high-level fluctuations, gold prices retreated significantly in the US market due to news, hitting a low near 3717.
Yesterday's daily gold price closed in the red, with the MA5 moving average near 3735. If today's daily closing price falls below the MA5 and reaches the MA10, bears will regain control of the market. Looking at the 4-hour Bollinger Bands, after breaking below the middle line, the price has fluctuated, briefly stabilizing near 3735. Currently, it is consolidating sideways, but if the European/US session breaks below 3735-3720, further declines to 3710-3700 are possible. The short-term downward trend is still under pressure and the market is in a weak state. Therefore, intraday gold trading is still mainly short selling, with long buying as an auxiliary.
The main pressure range above is 3750-3765. If the rebound touches the upper resistance range without breaking it, you can continue to short gold. The short-term support is at 3735-3720 below. If it falls back but does not break through, you can go long with a light position. Strong support focuses on the previous top and bottom conversion of 3710-3700.
#GOLD #NEW_forcast #XAUUSD#XAUUSD pulled back hitting the 3790 resistance but continues to respect the upward trend line and channel structure.

XAUUSD 1H – Bearish Rejection from SBR ZonePrice is currently retesting a key SBR (Support Becomes Resistance) area near 3760, following a break of structure to the downside with clear lower highs and lower lows. The move up appears corrective, and this SBR zone aligns with a recent weak high, making it a potential area for price to reject and resume the downtrend toward 3730 – 3717 support.
This bearish idea will be invalid if the SBR zone is broken and price closes above the 3760.347 level. Until then, I’ll be watching this zone closely for signs of bearish rejection to enter short, in line with the prevailing market structure.
