XAUUSD Analysis todayHello traders, this is a complete multiple timeframe analysis of this pair. We see could find significant trading opportunities as per analysis upon price action confirmation we may take this trade. Smash the like button if you find value in this analysis and drop a comment if you have any questions or let me know which pair to cover in my next analysis.
Xauusdidea

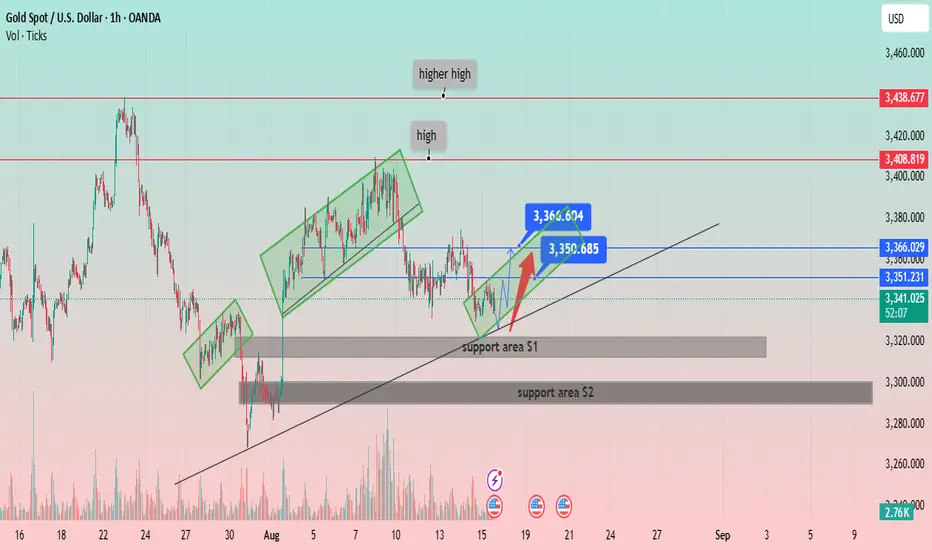
XAU/USD: Navigating the Uptrend and Key Support LevelsPrice Structure: Gold has been forming a series of higher highs and higher lows, indicative of a general uptrend. The chart labels a "high" and a "higher high," confirming this bullish structure.
Support and Resistance:
Two key support areas are identified:
Support area S1: A narrow zone around 3,320 USD. The price recently bounced off this area.
Support area S2: A broader, more significant zone around 3,290 USD, which appears to have been a strong support level in the past.
Several horizontal resistance levels are marked:
Immediate resistance: Around 3,351.231 USD and 3,366.029 USD.
Higher resistance: At 3,408.819 USD and 3,438.677 USD.
Channels and Trendlines:
The price has been moving within a series of ascending channels (highlighted in green rectangles), suggesting a stair-step upward movement.
A primary ascending trendline (black line) serves as a long-term support, with the price currently hovering just above it.
Recent Price Action and Projections:
The price recently broke out of a small downtrend and is showing signs of recovery from the "support area S1."
A potential price path is drawn with a red arrow, indicating a possible move towards the immediate resistance levels around 3,351 USD and 3,366 USD.
The chart highlights two specific price points, 3,360.604 USD and 3,350.685 USD, which likely represent a short-term trading range or target.
Volume: The volume spikes visible at key price points (e.g., at the low on July 30 and during the recent drop) indicate strong market activity.
GOLD H1 Intraday Chart Update For 18 AUG 2025Good Morning Traders
as you can see that GOLD successfully break 3350 Psychological for Shorter term scenario
All eyes on 3330 level breakout for the day if market breaks 3330 level then it will move towards 3310 level otherwise market will move towards 3380 level soon
Disclaimer: Forex is RISKY
Elliott Wave Analysis – XAUUSD July 18, 2025
Momentum
• D1 timeframe: Momentum is preparing to turn bullish. The current decline has lasted for 5 daily candles – this is often the usual number that completes wave D. Therefore, the current stage is sensitive, and price could reverse upward at any time. However, during such periods, price often sweeps liquidity to the downside first, so caution is required.
• H4 timeframe: Momentum is still bearish, suggesting that price may continue falling on Monday. That said, a reversal to the upside on Monday is also possible.
• H1 timeframe: Momentum is already in the oversold zone, with the lines sticking together. If price continues to fall at the Asian session open, a gap may appear. In that case, pay close attention to the downside target zones.
Wave Structure
• D1 timeframe: On the daily chart, we can see a completed abcde corrective structure, followed by a strong rally. The current move is a decline, likely forming waves 1 and 2 (green) within the 5-wave structure of the larger wave 5. The latest D1 candle shows a long upper wick, indicating that selling pressure still remains.
• H4 timeframe: A 5-wave impulse (12345, black) has formed, which could represent wave 1 (green). Afterward, a 3-wave ABC correction (purple) developed. The market is likely within wave C (purple) at the moment. With H4 momentum still bearish, this supports the scenario that wave C (purple) is continuing. Key downside targets to watch: 3322 and 3298.
• H1 timeframe: Within wave C (purple), a 5-wave impulse (12345, black) is unfolding. The market is currently in the late stage of wave 4 and the start of wave 5. Wave 5 will be confirmed if price breaks below 3331. Key downside targets for wave 5:
o Target 1: 3322
o Target 2: 3315
o Target 3: 3299
Trading Plan
• Scenario 1:
o Buy Zone: 3323 – 3321
o SL: 3312
o TP1: 3333
o TP2: 3350
o TP3: 3381
• Scenario 2:
o Buy Zone: 3300 – 3298
o SL: 3290
o TP1: 3333
o TP2: 3350
o TP3: 3381
technical analysis of the XAUUSDPrice: Around $3,345 currently.
Chart Indicators
Zig Zag (5, 10): Helps highlight major swing highs and lows.
RSI (Relative Strength Index): 14-period with levels at 70 (overbought) and 30 (oversold).
Recent Low: Around $3,247 (late July).
Lower highs and lower lows indicate short-term bearish trend.
Price broke below a minor swing support around $3,380 and is now testing $3,345.
Zig Zag Pattern: Suggests corrective moves but overall downward bias after recent top at 3,438.
RSI Analysis
Recently peaked near 70 (overbought zone) during mid-August high.
Currently near 50 (neutral), showing consolidation after a sell-off.
Signal: No clear divergence, but bearish momentum eased after recent drop.
Key Support & Resistance
Support Levels:
$3,320–3,330: Near-term support zone.
$3,247: Major previous swing low (strong support).
Resistance Levels:
$3,380–3,400: Immediate resistance (recent broken support).
$3,438: Last swing high (strong resistance).
Volume Analysis
Downward move from $3,438 to $3,345 happened with moderate volume, suggesting steady selling pressure but not a panic drop.
Possible Scenarios
Bullish Scenario (Reversal or Pullback)
Price needs to hold above $3,330 and break $3,380 to target $3,420–3,438.
RSI moving above 60 would strengthen bullish momentum.
Bearish Scenario (Continuation)
If price breaks below $3,330, next target is $3,300, then $3,247.
RSI dropping toward 30 would confirm strong bearish momentum.
Trade Idea (Not Financial Advice)
For Bulls: Wait for a break & close above $3,380 for a potential long entry.
For Bears: Watch for a break below $3,330 for a potential short toward $3,247.
Stop-loss: Use nearby swing highs/lows for risk management.
Overall Sentiment:
Currently neutral to slightly bearish, as price is below key resistance and forming lower highs.

XAUUSD Analysis todayHello traders, this is a complete multiple timeframe analysis of this pair. We see could find significant trading opportunities as per analysis upon price action confirmation we may take this trade. Smash the like button if you find value in this analysis and drop a comment if you have any questions or let me know which pair to cover in my next analysis.

XAU/USD (Gold CFD) – Weekly Opening Outlook | SMC Perspective# 🟡 XAU/USD (Gold CFD) – Weekly Opening Outlook | SMC Perspective
**Date:** 2025/08/17
**Timeframe:** 45M (Heikin Ashi)
**Methodology:** Smart Money Concept (SMC)
---
## 📊 Market Context
Gold closed the previous week under heavy liquidity grabs after multiple **CHOCH** and **BOS** structures. The current market is positioned around **3,335**, balancing between two potential phases:
1. **Phase 1 (Bullish Recovery)**
2. **Phase 2 (Bearish Continuation)**
Both phases are mapped on the chart with clear structural references.
---
## 🔵 Forecast Phase 1 – Bullish Scenario
1. **Key Levels:**
- **Immediate Demand Zone:** 3,330 – 3,335
- **Equilibrium Reaction Zone:** 3,350 – 3,360
- **Liquidity Pool:** 3,380 – 3,390
2. **Conditions for Validation:**
- Price must hold the **discount demand zone** (PDI).
- A strong **CHOCH → BOS** sequence from current level.
- Break and close above **3,350 equilibrium**.
3. **Expected Move:**
- Push towards **previous PDH** and sweep above **3,370 – 3,380**.
- Potential continuation into **EQH (3,390 – 3,400)** liquidity zone.
4. **Targets:**
- 🎯 TP1: **3,350** (equilibrium retest)
- 🎯 TP2: **3,370 – 3,380**
- 🎯 TP3: **3,390 – 3,400** (EQH / liquidity sweep)
5. **Invalidation:**
- Closing candles below **3,330 demand zone** will weaken bullish outlook.
---
## 🔴 Forecast Phase 2 – Bearish Scenario
1. **Key Levels:**
- **Discount Zone:** 3,320 – 3,325
- **Major Demand Zone:** 3,300 – 3,280
- **Extended Liquidity Pool:** 3,260 – 3,250
2. **Conditions for Validation:**
- Failure to hold above **3,335 – 3,330**.
- Clear rejection at equilibrium levels (**3,350 – 3,360**).
- A new **BOS** towards the downside.
3. **Expected Move:**
- Market could unfold in 5-leg structure (as shown on chart: ① → ⑤).
- First rejection around **3,335 – 3,340**, followed by extension towards **3,310 – 3,280**.
- Final liquidity sweep possible into **3,260 – 3,250 zone**.
4. **Targets:**
- 🎯 TP1: **3,320 – 3,325**
- 🎯 TP2: **3,300 – 3,280**
- 🎯 TP3: **3,260 – 3,250**
5. **Invalidation:**
- A confirmed **bullish CHOCH** above **3,350 equilibrium** invalidates the bearish scenario.
---
## ⚖️ Summary
- **Phase 1 (Bullish):** Possible rebound from current demand towards **3,390 – 3,400** liquidity.
- **Phase 2 (Bearish):** Failure at equilibrium may trigger deeper continuation into **3,280 – 3,250 demand**.
Traders should monitor **CHOCH / BOS confirmations** closely before positioning.
---
#XAUUSD #Gold #SMC #CHOCH #BOS #Liquidity #FVG #TradingView

Gold balances on a fine line: growth or correction?Following the release of soft US inflation data, gold is consolidating in the $3,250–$3,450 range, holding above key support. A weak dollar and expectations of a Fed rate cut are supporting bulls, but locally the price has hit a resistance zone.
Bullish:
Fixing above $3450 → target $3500, then $3550–$3600.
Breakthrough of $3500 will increase momentum to $3650+.
Bearish:
Breakthrough below $3250 → decline to $3200, with increasing pressure — to $3100.
📊 Indicators (D1)
RSI (14): ~43 — neutral, not overbought
MACD: in the negative zone — signal of a possible correction
SMA50/100/200: price slightly below average, indicating a pause in growth

GOLD RAID ON – Bullish Limit Orders Are LIVE! XAU/USD💰GOLD HEIST IN PROGRESS! XAU/USD BULLISH RAID BEGINS! 🏴☠️📈
Asset: XAU/USD – Gold vs U.S Dollar
📊 Plan: BULLISH ROBBERY
🎯 Target: 3460.00
🛑 Stop Loss: 3330.00
📥 Entry: ANY level – vault is wide open!
👑 THIEF MODE ACTIVATED – Time to raid GOLD like a pro. We’re stacking multiple limit orders (layering entries) just like setting traps for those greedy bears 🐻💥
🚪💼 Entry strategy:
“The vault is unlocked – grab your bag and go!”
Place buy limits at recent swing lows (15m/30m) or jump in live with your bullish crew. Use alerts to catch price at key pullback zones.
🛑 SL placed at: 3330 – Just below thief territory. Adjust based on your lot size + number of entries 🔐
🎯 Target: 3460 – Hit and run, or trail that SL and let the gold rain! ☔💸
🧠 Thief Tactics for GOLD:
Only trade Long-side – scalpers, swing traders, all aboard 🚂
Use trailing SL to protect your loot
Avoid trading during high-impact news (CPI, NFP, Fed, etc) ⚠️
Stay alert for manipulations + fake-outs at key levels – it's a trap game out here 🎭
📰 Before the Heist:
🧾 Read Fundamentals • COT Report • Sentiment • Macro Outlook
📌 Always stay updated, news can flip the market faster than a backstab 🗡️
🗣️ Boost this idea if you’re robbing with us!
💥 Smash that LIKE if you believe in the heist
🚨 Follow for more high-voltage thief trades
💎 Daily playbooks. Clean getaways. All signals, no noise.
Join the crew. Trade like a THIEF. Get rich or get smarter.
🕵️♂️💰🚀🔥🐱👤📈

The impact of the meeting on gold prices.Trump: Speaks with Lukashenko. We discussed prisoner releases and a meeting with Putin. The meeting details are as follows:
Trump: "Had a great meeting with Belarusian President Lukashenko. The purpose of the call was to thank him for releasing 16 prisoners. We are also discussing the release of an additional 1,300 prisoners. We had a very pleasant conversation. We discussed many topics, including President Putin's visit to Alaska. I look forward to meeting with President Lukashenko in the future."
The meeting did not clearly indicate any positive or negative impact on the market. However, Jess believes that gold prices will continue to fall in the short term, so it is advisable to sell gold at a high level to profit.

Gold Under Attack! Thief Trader’s Layered Sell Plan in Action!💣 XAU/USD GOLD HEIST: Police Waiting at 3270 – Escape Before They Catch Us! 🔐💰
🕵️♂️ Hello Thief OG’s, Money Grabbers & Market Shadows!
Today’s mission is Gold (XAU/USD) – not to wear, but to steal! 💸✨
🎯 MISSION BRIEF
We’re going BEARISH on Gold. No single-shot nonsense – we’re using layered SELL LIMIT traps to grab the loot piece by piece.
💼 Entry Layers:
3340.00
3350.00
3360.00
(💡 Add more layers if you want to go full gang mode.)
🛑 Stop Loss – The Alarm Trigger
SL @ 3380.00 🚨
But hey… Thief OG’s adjust it to your own strategy & risk. Don’t get caught with your mask off. 😎
💰 Target – The Escape Plan
Main Target: 3270.00 (Police barricade 🚔)
Quick Exit: 3280.00 (Escape van is ready 🚐)
📊 Why This Is the Perfect Hit
Price dancing near resistance – the “vault door” is open.
Weak bullish attempts = fake gold rush trap.
Trend sniffers pointing down on higher timeframes.
Market makers guarding at 3380 = the alarm system.
📜 Thief Trader Rules for This Mission
Avoid entering during major economic news bombs 💣.
Trail your SL once price moves in your favor – thieves who overstay get caught.
Always rob smart – we’re professionals, not gamblers.
💥 Support the Robberhood Crew!
Boost this idea if you want more Thief Trader missions.
Every boost = more ammo for the next market robbery.
Remember: No chase, no case. 🕶️💼💣
#XAUUSD #GoldTrade #BearishPlan #LayeringStrategy #ThiefTrader #RobTheMarket #BoostForMore
XAU/USD – Institutional Outlook 15 August 2025Gold continues to grind through a tight mid-$3,300 range after Thursday’s hot U.S. PPI print boosted the dollar and dented large Fed rate-cut bets. Despite the short-term pullback, the broader 4H structure remains intact — giving traders both an upside and downside opportunity today.
This is not a scattergun approach. We work with only ONE Buy Zone and ONE Sell Zone with full institutional confluence. Every level here is refined using Price Action, Smart Money Concepts, ICT core principles, Order Blocks, Fair Value Gaps, Premium/Discount arrays, and liquidity mapping.
Primary Buy Zone ($3,325–$3,330) – The Golden Zone
This is today’s highest-probability trade location. Price sits in structural discount, right on top of a fresh 4H Rally-Base-Rally demand zone with a refined bullish Order Block. An unmitigated Fair Value Gap overlaps perfectly with the Optimal Trade Entry (0.705–0.79 retracement) of the last bullish leg.
Liquidity is positioned just below at equal lows near $3,322, inviting a possible stop-run before reversal. Volume imbalance on the prior up-leg confirms smart-money participation.
Entry: $3,325–$3,330
Stop-Loss: Below $3,318 (liquidity + swing low)
Take-Profit Targets:
TP1: $3,357 (local structure)
TP2: $3,380 (Fib 1.272 projection)
Kill Zone: London open into New York overlap
Primary Sell Zone ($3,355–$3,360)
Gold’s upside is capped by a 4H Drop-Base-Drop supply zone nested in premium pricing. A refined bearish Order Block aligns with a Fair Value Gap from the last impulsive sell-off. Equal highs around $3,360 offer liquidity for a potential sweep before distribution.
Entry: $3,355–$3,360
Stop-Loss: Above $3,370 (EQH cluster)
Take-Profit Targets:
TP1: $3,330
TP2: $3,305 (Fib 1.272 extension)
Fallback Zones – In Case of Manipulative Displacement
Fallback Buy: $3,315–$3,320 → Demand zone + OTE + minor FVG; SL below $3,308; same TPs as Primary Buy.
Fallback Sell: $3,365–$3,370 → Secondary supply + OTE + OB; SL above $3,375; same TPs as Primary Sell.
Why the Golden Zone Matters Today
Among all four levels, the Primary Buy Zone at $3,325–$3,330 stands out. It sits at the crossroads of structural discount, smart-money footprints, and liquidity positioning. If price sweeps the equal lows at $3,322 during the London or early NY session, the probability of a sharp, institution-led reversal increases dramatically.
Institutional Consensus
Market commentary from FXStreet, FXEmpire, and DailyForex all acknowledge mid-$3,320s as a key support zone, with resistance forming near $3,355–$3,400. This alignment reinforces our bias: sellers control the premium zone, but buyers are poised to defend structural discounts.
Execution Reminder
Trade only the defined zones with precise risk control. These are institution-level liquidity plays, not mid-range chases. If price fails to respect the primary zone, step aside or switch to the fallback. Patience is part of the edge.
💬 If you find this level-by-level breakdown useful, drop a comment below. Let’s see how the Golden Zone plays out in real time.

Gold Spot / U.S. Dollar (XAUUSD) - 4 Hour Chart (OANDA)4-hour chart from OANDA displays the recent price movement of Gold Spot (XAUUSD) against the U.S. Dollar. The current price is $3,334.075, reflecting a decrease of $21.620 (-0.64%) from the previous value. The chart shows a sell price of $3,333.800 and a buy price of $3,334.340, with a spread of 54.0. The price has fluctuated between $3,368.176 (high) and $3,323.839 (low) in recent trading, with a shaded area indicating a potential support or resistance zone around $3,340. The data covers the period from mid-August to early September 2025.

Gold: From Bullish Bias to Bearish Shift- N.Y UpdateIn this morning's analysis, I mentioned that Gold was still in bullish territory, but the line in the sand was the 3350–3355 zone.
In fact, I bought at that level — but given the choppy price action and the sharp rejection from the 3375 resistance, I kept the position size small. Good thing I did, as the stop loss was eventually hit.
With price now falling below the 3350 zone and showing what can be categorized as a strong reversal from resistance, the odds have shifted decisively to the bearish side.
Trading plan: Any rally above the 3350 zone should now be viewed as an opportunity to sell into strength. 🚀
Disclosure: I am part of TradeNation's Influencer program and receive a monthly fee for using their TradingView charts in my analyses and educational articles.

XAUUSD Analysis todayHello traders, this is a complete multiple timeframe analysis of this pair. We see could find significant trading opportunities as per analysis upon price action confirmation we may take this trade. Smash the like button if you find value in this analysis and drop a comment if you have any questions or let me know which pair to cover in my next analysis.

Elliott Wave Analysis – XAUUSD August 14, 2025
1. Momentum Analysis
• D1 timeframe: Momentum is showing signs of reversal. Although price may not reverse immediately when the two momentum lines converge, this is a clear signal that the current selling pressure is weakening.
• H4 timeframe: Momentum is declining and has only formed 2 H4 candles since the reversal began. It will likely take another 2–3 H4 candles to enter the oversold zone and potentially reverse upward.
• H1 timeframe: Momentum is also falling, suggesting a likely downward move during the Asian session.
________________________________________
2. Wave Structure
• On H1, price is moving in a choppy manner, indicating a corrective phase that has nearly reached its target.
• However, the D1 momentum preparing to reverse upward creates two possible scenarios:
Scenario 1: D1 momentum reverses upward and confirms → The uptrend could last for 4–5 days, conflicting with the current scenario of a corrective wave B. In this case, we would have an alternative scenario of an initial diagonal wave 1 as shown in the right-hand chart.
Scenario 2: D1 momentum enters the oversold zone and stays there → A strong drop would be needed to confirm that the current price action is wave B.
________________________________________
3. Two Potential Price Scenarios
1. WXY corrective pattern → Target for wave Y is around 3381.
2. Initial diagonal wave 1 → Wave 2 could decline toward 3345 before wave 3 rises again. This scenario currently aligns better with the D1 momentum signal.
________________________________________
Conclusion: At present, there is a conflict between momentum signals and wave structure. Further observation is required to determine a clearer trading plan, so no trade recommendation for today.

8/14: Watch Resistance at 3352–3358, Support at 3332–3323Good afternoon, everyone!
After entering the 3372–3378 resistance zone, gold attempted two breakouts but failed, forming a double-top pattern and breaking below the 3366 support. It then found temporary support at 3358–3352, but the rebound failed to reclaim 3366, leading to a further drop to test the 3343–3337 area. This is a textbook support-to-resistance shift, worth studying for those interested in technical analysis.
Currently, the structure favors the bears. In the coming moves, watch closely to see if the 3352–3358 area turns from support into resistance again. If selling pressure persists, 3332–3323 will be the next battleground. Should bulls fail to defend it, the 3300 level could be retested.
For the rest of the week, trading should remain focused on these key support and resistance zones. With data coming in during the US session today, risk management is crucial — favor short positions on rebounds, with long trades as a secondary option. If caught in a losing position, and your account is safe, consider averaging down or hedging. If you need assistance, feel free to message me.

XAUUSD analysis – 1H FVG and OB SetupsOn the 1H gold chart, price recently reacted to the FVG (red zone) at 3410, showing a clean rejection and shifting order flow to the downside.
Below the current price, we have three key bullish OB zones:
First green OB around 3460, acting as the closest demand zone.
Second green OB around 3310, a deeper liquidity zone.
Third green OB at 3287, a stronger higher-timeframe demand that may act as a swing point.
If price retraces back into 3410 and rejects with confirmation in lower timeframes (3m–15m), it could provide a short setup toward the 3460–3310 demand range.
Conversely, if price breaks above 3410 with strong momentum, the bias may shift to testing higher liquidity levels.
📊 ProfitaminFX | Gold, BTC & EUR/USD & Crypto
📚 Daily setups & educational trades

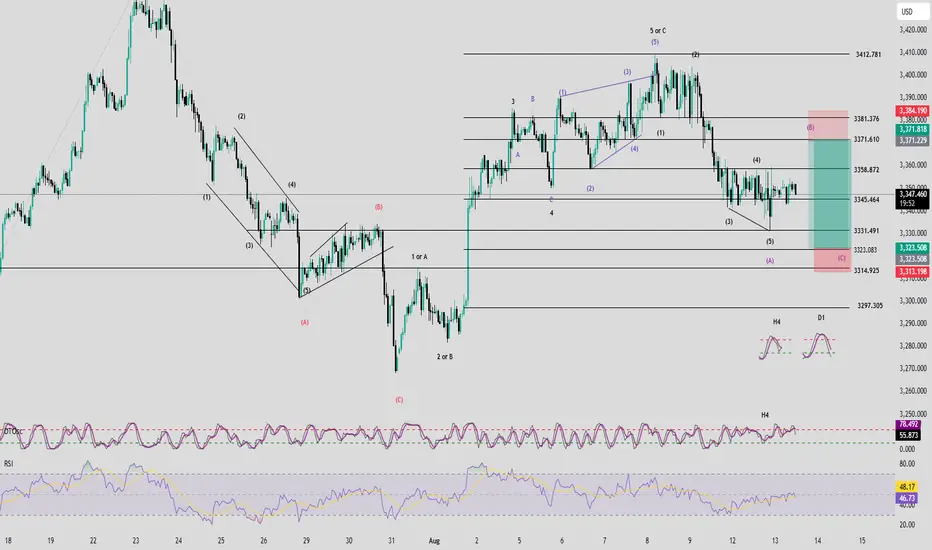
Elliott Wave Analysis – XAUUSD (August 13, 2025)
1. Momentum
• D1 Timeframe: Momentum is about to enter the oversold zone. By the end of today, it is likely to be fully in oversold territory. This stage often leads to strong price movement – either a sharp decline or a bullish reversal.
• H4 Timeframe: Momentum is preparing to turn upward. We need to wait for the current H4 candle to close for confirmation. If confirmed, a recovery move is likely to occur today.
• H1 Timeframe: Momentum is currently tightening and approaching the overbought zone – a typical sign of sideways price action. This explains why, despite the high probability of a recovery, H1 does not yet provide a good entry signal.
________________________________________
2. Wave Structure
• RSI shows a bullish divergence between price and the indicator – a pattern often seen in wave 3 or wave 5. This supports the view that wave 5 (black) has completed around the 3333 level.
• With a complete 5-wave structure, wave A (red) of the ABC (red) correction may already be in place.
• A recovery in wave B (red) is expected, which aligns with H4 momentum preparing to turn upward. Wave B typically forms a 3-wave corrective structure, where price moves in a choppy, overlapping manner rather than trending strongly.
• Wave B target zones:
1. 3371
2. 3381
These two levels are close to each other, so they can be treated as one combined zone. The plan is to take the first target as the base level while extending the SL to cover the second target. If price approaches these levels, it’s best to watch real-time price action before entering a trade.
• Alternative scenario: If wave 5 (black) is not yet complete, the 3323 zone remains a good Buy opportunity (as per the previous analysis).
________________________________________
3. Trading Plan
Sell Setup:
• Entry Zone: 3371 – 3373
• SL: 3385
• TP1: 3358
• TP2: 3331
• TP3: 3323
Buy Setup:
• Entry Zone: 3323 – 3321
• SL: 3313
• TP1: 3331
• TP2: 3357
• TP3: 3371
2. Wave Structure
• RSI shows a bullish divergence, often seen in wave 3 or 5, suggesting wave 5 (black) may have completed around 3333.
• Wave A (red) of the ABC cycle may be complete; wave B (red) is expected to recover in a 3-wave, choppy pattern.
• Wave B target zone: 3371–3381 (treated as one zone; monitor price action before entry).
• Alternative scenario: If wave 5 (black) is not yet complete, 3323 remains a potential Buy zone.
GOLD Buyers In Control Now , Long Setup To Get 200 Pips !Here is My 15 Mins Gold Chart , and here is my opinion , we finally above 3358.00 and we have a 4H Candle closure above it And Perfect Breakout and this give us a very good confirmation cuz we have not any 4H closure above this area since this week start , so we have a good confirmation now to can buy after the price go back to retest the broken area to can use a small stop loss , and we can targeting 100 to 200 pips . if we have a daily closure below this area this mean this idea will not be valid anymore .
Reasons To Enter :
1- Clear Breakout On Bigger T.F
2- Clear Bullish Price Action .
3- Bigger T.F Giving Good Bullish P.A .
4- The Price Take The Last High .

8/12: Key Support at 3343–3337, Resistance at 3366–3372Good morning, everyone!
Yesterday, the market saw a one-sided drop, with selling pressure on the 4H chart largely released. However, the daily bullish structure has been damaged. Given the size of yesterday’s decline, there’s a decent chance of an intraday rebound today.
Key support levels to watch are 3343–3337 and 3328–3323, while resistance sits at 3352–3358 and 3366–3372–3378. Trading should focus on these zones.
With today’s news-driven volatility likely to exceed yesterday’s, if the downtrend continues, I see 3312–3298 as an attractive buying opportunity. My overall bias for the day remains buying on dips, with potential short opportunities near resistance.

Gold Spot / U.S. Dollar (XAU/USD) 4-Hour Chart - OANDA4-hour chart from OANDA displays the price movement of Gold Spot (XAU/USD) from late July to mid-September 2025. The current price is $3,335.985, reflecting a decrease of $6.670 (-0.20%). Key levels include a sell price of $3,335.720 and a buy price of $3,336.270. The chart highlights recent price fluctuations, with a notable drop and a shaded support/resistance zone between approximately $3,340.000 and $3,360.000

EURUSD GBPUSD and DXY Analysis todayHello traders, this is a complete multiple timeframe analysis of this pair. We see could find significant trading opportunities as per analysis upon price action confirmation we may take this trade. Smash the like button if you find value in this analysis and drop a comment if you have any questions or let me know which pair to cover in my next analysis.
