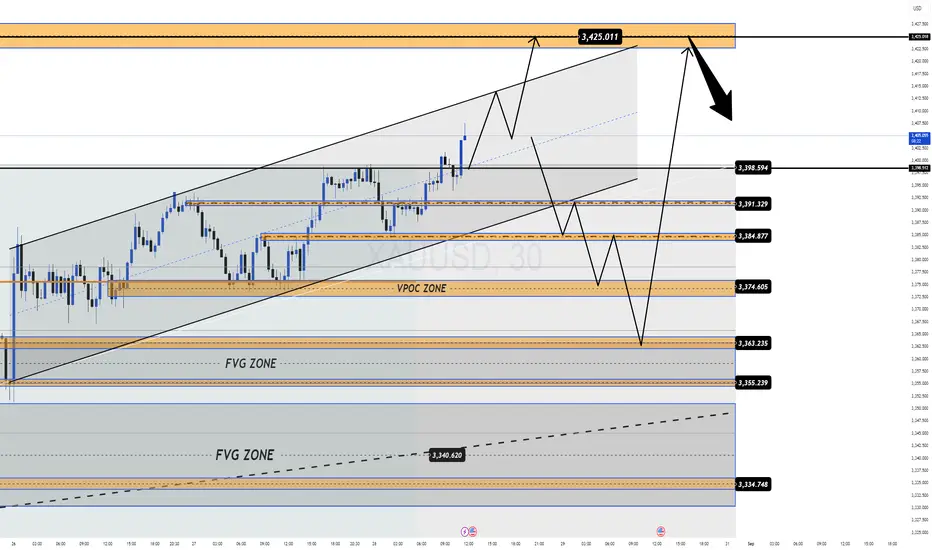
From Rally to Reversal: Gold Near PRZ, Bears Prepare!As I expected in the previous idea , Gold started to rise with the help of Powell's words and reached my targets(Full Target) .
Gold is currently entering the Potential Reversal Zone(PRZ) and is also moving near the Resistance zone($3,451-$3,406) and Resistance line .
In terms of Elliott Wave theory , Gold appears to be completing microwave 5 of the main wave C . The wave structure is a Zigzag Correction(ABC/5-3-5) .
I expect Gold to drop to at least $3,363 after entering the Potential Reversal Zone(PRZ) .
Second Target: $3,351
Third Target: Support lines
Note: Stop Loss (SL) = $3,416(Worst)
Gold Analyze (XAUUSD), 2-hour time frame.
Be sure to follow the updated ideas.
Do not forget to put a Stop loss for your positions (For every position you want to open).
Please follow your strategy; this is just my idea, and I will gladly see your ideas in this post.
Please do not forget the ✅ ' like ' ✅ button 🙏😊 & Share it with your friends; thanks, and Trade safe.
Xauusdidea

Gold Trade Set UpOANDA:XAUUSD
www.tradingview.com
Price has been making HH/HL so im overall bullish above this 15m high. I want to see a close above, and retest to target PDH/HH

XAUUSD – 1H | OB / CCH map Green = Buy OB, Red = Sell OB. Current price ~ 3410.7.
Key zones I’m tracking:
CCH / 1H supply: 3415–3422
HTF HIGH supply: 3435–3448
1H OB (near): 3382–3372
1H OB (deeper): 3334–3320
Scenario 1 – Rejection from supply (sell):
If price sweeps into 3415–3422 (CCH) or pushes into 3435–3448 (HTF HIGH) and 3–5m closes fall back below 3420, I’ll look for shorts targeting 3382–3372 first, then the 3334–3320 OB. Invalidation for the idea is sustained acceptance above 3450.
Scenario 2 – Mitigation then continuation (buy):
If price pulls back to 3382–3372 (1H OB) and prints a bullish shift (3–5m BOS/CHoCH), I’ll look for buys back to 3415/3422, and, if accepted above 3420, continuation into 3435–3448. If the first OB fails, the next buy zone is 3334–3320 (reaction-only with confirmation).
Execution: entries on 3–5m, always require a clear shift; no blind orders.

XAU/USD — All Eyes on US Data, Gold Ready for a Big Move!
Gold continues to hold strong buying pressure despite the recovery of the USD (DXY). The market is now waiting for today’s key US economic releases during the New York session:
📊 USD Prelim GDP q/q → Forecast: 3.1% (Prev. 3.0%)
📊 USD Unemployment Claims → Forecast: 231K (Prev. 235K)
🔎 Possible Scenarios
1️⃣ If US data comes out strong → Gold could break down from the rising channel, targeting the VPOC 3374, and with heavier pressure even dip towards the 335x zone (though this might be harder to achieve).
2️⃣ If US data is weak / neutral → Gold is likely to continue its bullish leg, aiming at 3392 – 3398 and potentially extending to 342x – 343x to retest the previous ATH.
📌 Key Levels to Watch
Resistance: 3398 – 3400 → breakout could fuel a quick rally into 342x – 343x
Support: 3374 → break below opens room to 335x
Buy Zone: Watching for a sharp dip into 335x – 337x for clean long setups
🎯 MMFLOW Strategy
👉 Priority remains: wait for a liquidity grab / sharp dip to BUY in line with the broader trend.
👉 Be cautious — with this being the main economic release of the week, volatility can spike aggressively when the numbers hit.
🔥 What do you think?
Will Gold break higher into new ATHs, or will we see a liquidity sweep first before the next leg up?
💬 Share your view in the comments — let’s trade smart together!
Gold (XAU/USD) Technical Outlook - 29 August 2025Gold remains in a highly reactive zone, with price currently consolidating near the $3410 handle. Institutional order flow shows a battle between bulls defending discount demand zones and bears attempting to exploit premium supply levels. By combining Daily, 4H, and 1H confluences, today’s analysis outlines the most execution-ready buy and sell zones with defined entries, stop-loss levels, and profit targets.
🔹 Primary Buy Zone – $3388 to $3396
This is the highest-probability demand area for today. On the Daily timeframe, the zone sits within a deep discount region of the last bullish leg, aligning with the broader macro bias. The 4H chart reveals a fresh, unmitigated bullish order block, while the 1H structure confirms a BOS (Break of Structure) and liquidity sweep beneath equal lows.
Momentum indicators support this view — RSI is approaching oversold levels, and MACD momentum is shifting bullish. Volume also highlights absorption, suggesting institutional accumulation.
Entry: $3392
SL: $3384
TP1: $3415
TP2: $3428
🔹 Secondary Buy Zone – $3365 to $3372
If the primary demand fails, the next strong support sits around $3365–$3372. This zone overlaps with a Daily breaker block and coincides with the 50% retracement of the previous swing leg. On 4H, liquidity is pooled just below $3370, while 1H imbalance (FVG) aligns with demand.
RSI divergence also strengthens the bullish probability here.
Entry: $3368
SL: $3358
TP1: $3390
TP2: $3410
🔹 Primary Sell Zone – $3425 to $3435
This is the strongest intraday supply zone. On the Daily timeframe, price approaches a premium level of the current retracement, while 4H charts show a fresh supply zone formed from institutional distribution. The 1H chart reveals liquidity buildup above $3428, creating an engineered high.
RSI is flashing bearish divergence at this level, with volume showing prior rejection and imbalance — confirming potential sell-side pressure.
Entry: $3430
SL: $3438
TP1: $3410
TP2: $3395
🔹 Secondary Sell Zone – $3448 to $3458
This zone sits higher, acting as a fallback supply level. It overlaps with a Weekly supply zone, while 4H structure confirms old consolidation highs resting here. If tapped, price is likely to engineer liquidity before displacement. ATR also shows exhaustion at this level, making it a potential reversal point.
Entry: $3453
SL: $3463
TP1: $3430
TP2: $3410
🏆 Executive Summary – Golden Zone
The Primary Buy Zone ($3388–$3396) is nominated as today’s Golden Zone. This area aligns with Daily discount, 4H unmitigated demand, and 1H structural confirmation. With multiple confluences (order block, BOS, liquidity sweep, RSI, MACD), it presents the highest reward-to-risk opportunity.
Golden Execution Idea:
Buy $3392 → SL $3384 → TP $3428 (≈1:4 RR)
Final Thoughts
Gold is currently positioned at a critical juncture, with well-defined buy and sell zones framing today’s opportunities. Traders should stay disciplined, execute only on confirmed setups, and remain aware of liquidity manipulation around key levels. The $3388–$3396 Golden Zone offers the most institutionally aligned trade for today, but alternative supply and demand levels provide structured backup scenarios.

Gold (XAU/USD) – 2H – Inducement & HTM OBGold (XAU/USD) – 2H – Inducement & HTM OB
🔹 Market Structure
The chart shows a potential inducement pattern above liquidity levels, designed to trap early buyers before the real move.
Price has created a fake bullish impulse (a–b–c–d–e), suggesting exhaustion and a setup for downside liquidity grab.
The liquidity above 3,416 has been taken, aligning with inducement theory.
---
🔹 Inducement & Liquidity
After inducement, price is expected to sweep liquidity resting around the 3,400 – 3,390 area.
This liquidity grab could provide momentum toward the HTM Order Block (OB) zone around 3,370 – 3,365.
That zone is the higher-probability demand area where smart money may step in.
---
🔹 HTM Order Block (OB)
The HTM OB aligns with strong confluence:
Previous demand zone
Overlapping liquidity pool
Technical retracement structure
Once price taps this level, a bullish reversal toward higher levels becomes probable.
---
🔹 Outlook & Trading Plan
Bearish short-term: Expect continuation to the downside after inducement, targeting 3,390 → 3,370.
Bullish mid-term: From HTM OB (3,370 – 3,365), potential rebound upward toward 3,416+.
Invalidation: If price closes strong above 3,430, the bearish inducement setup is invalid.
---
✅ Bias: Bearish into HTM OB → Bullish from demand zone
🎯 Targets: 3,390 → 3,370 → 3,416+
❌ Invalidation: Close above 3,430

GOLD Resistance Ahead!
HI,Traders !
#GOLD is trading in an
Uptrend and Silver shot
Up sharply today and it
Is now locally overbought
So after the retest of the
Horizontal resistance above
At 3436.05 from where we
Will be expecting a local
Bearish move down !
Comment and subscribe to help us grow !

GOLD at Major Resistance – Big Drop Incoming?Hello Traders! 👋
Gold (XAUUSD) is now testing a critical supply zone at 3425.86 – 3499.36 after weeks of sideways consolidation. This region has acted as a strong ceiling multiple times, and price is once again showing signs of exhaustion.
If sellers step in here, we could see a sharp bearish move targeting:
🟢 3176.40 (first demand zone)
🟢 2982.24 (major demand zone & final target)
🔑 Key Levels to Watch:
Resistance Zone: 3425.86 – 3499.36
Current Price: 3409.58
Bearish Targets: 3176.40 → 2982.24
⚡ Bias: Bearish from supply rejection. However, a daily close above 3499.36 would invalidate this setup and open doors for new highs.
📌 Technical Confluence:
Strong resistance zone ✅
Previous rejections at this level ✅
Potential double top pattern forming ✅
What’s your take, traders? Will GOLD finally break higher or respect the supply zone and dump hard?
💬 Share your thoughts in the comments!
👍 Like & Follow for more market breakdowns!

GOLD Very Bullish , Can We Buy Again And Get 200 Pips ?Here is My 15 Mins Gold Chart , and here is my opinion , we finally above 3400.00 and we have a 4H Candle closure above it and we have a Perfect Breakout and this give us a very good confirmation , so we have a good confirmation now to can buy from 3400.00when the price back to retest it , we need the price to go back and retest it and give us a good bullish price action and then we can enter , we can targeting 100 to 200 pips . if we have a daily closure below this area this mean this idea will not be valid anymore .
Reasons To Enter :
1- Perfect Touch For The Area .
2- Clear Bullish Price Action .
3- Bigger T.F Giving Good Bullish P.A .
4- The Price Take The Last High .
5- Perfect 15 Mins Closure .

XAUUSD 15m – EW Short SetupHi fellow traders,
On the 15m XAUUSD chart, I am applying Elliott Wave principles to capture a potential short move. Price action is unfolding within an ending diagonal pattern, and I am anticipating the final leg down as wave (v).
Additional confluence is provided by the red-shaded supply zone, which coincides with the projected entry area and strengthens the probability of a reversal at this level.
I am entering at 3335.37, with a Stop Loss at 3345.30 serving as the invalidation level. My Take Profit is set at 3307.64, targeting the next key support area.
Good luck and trade safe.

XAUUSD 1H – EW Bearish Scenario Hi fellow traders,
On the 1h XAUUSD chart, I am applying Elliott Wave principles to outline a potential expanding flat scenario, forming either as an X-wave or a B-wave. If this count holds, I expect another leg to the downside before the larger structure completes.
The red-shaded supply zone provides a potential rejection area, while the blue-shaded demand zone below marks where price could stabilize. Most importantly, the golden box beneath remains untested, aligning with my expectation that price will revisit this key support zone before a stronger reversal.
For this setup, my entry is positioned around the supply zone, with a Take Profit aimed at the golden box below. The Stop Loss is placed at the invalidation level, meaning the trade idea is no longer valid if price breaks above this structure.
Although the broader sentiment may lean bullish, this bearish scenario remains technically supported by Elliott Wave structure and confluence levels.
Good luck and trade safe.

Gold Trade Set up Aug 28 2025OANDA:XAUUSD
www.tradingview.com
price is making HH/HL on the daily 4h and 1h time frames so overall im bullish. There is a 1h FVG formed and HL acting as SSl that is being tested, so if price closes above HL i will look for internal structure on the 5m to target BSL around 3409 but if price closes under HL it can come to test lower SSL around 3385 before continuing up

GOLD Still Very Bullish , 2 Chances To Buy And Get 200 Pips !Here is My 15 Mins Gold Chart , and here is my opinion , we finally above 3377.00 and we Still Not have a 4H Candle closure above it but we have a Perfect Breakout and this give us a very good confirmation , so we have a good confirmation now to can buy from 2 places , first one and best one for me will be 3377.00 , we need the price to go back and retest it and give us a good bullish price action and then we can enter , or if you a aggressive trader you can enter from 3381.00 cuz we have a small double bottom reversal pattern so we can enter from neckline also . we can targeting 100 to 200 pips . if we have a daily closure below this area this mean this idea will not be valid anymore .
Reasons To Enter :
1- Perfect Touch For The Area .
2- Clear Bullish Price Action .
3- Bigger T.F Giving Good Bullish P.A .
4- The Price Take The Last High .
5- Perfect 15 Mins Closure .
6- Small Reversal Pattern .

Gold (XAU/USD) – 30m – AMD (Accumulation / Manipulation / DistriGold (XAU/USD) – 30m – AMD (Accumulation / Manipulation / Distribution)
🔹 Phase 1: Accumulation
The market showed a period of range-bound price action in the lower zone, where liquidity was building up.
This phase indicates that smart money was collecting positions, creating the base for the next move.
The price respected the liquidity trendline and showed a gradual shift of demand.
---
🔹 Phase 2: Manipulation
A clear stop-hunt / liquidity grab occurred above the accumulation range.
This move is characterized by a false breakout above the consolidation zone, designed to trap early buyers.
The spike in volume and quick rejection signals the transition into distribution.
---
🔹 Phase 3: Distribution
Price moved into the 3,406 – 3,410 area, marking the distribution zone.
This is where supply overtakes demand as institutional players offload positions.
Strong rejection candles confirm sellers are active here.
Risk of reversal is high, and any long trades are considered risky at this point.
---
🔹 Outlook & Trading Plan
If price holds below 3,406, we can expect a downward continuation toward 3,377 and potentially the 3,368 liquidity pool.
Any short entry should ideally align with rejection signals in the distribution phase.
If the market breaks and sustains above 3,410, it invalidates the distribution setup and indicates continuation of bullish momentum.
---
✅ Bias: Bearish under 3,406
🎯 Targets: 3,377 – 3,368
❌ Invalidation: Above 3,410
Analysis: mohsen mozafari nejad
Adminstration of persiaux king academy

3400, the upper edge of the triangle, is gold long or short?#XAUUSD OANDA:XAUUSD
I reminded you yesterday not to chase the rising prices easily. 💻Gold retreated today as expected, hitting a low near 3385.
Gold is currently in a consolidation phase and has not given a clear trading direction, or it is waiting for the release of initial jobless claims data.📊
As the price of gold rises, the short-term support also moves up. 🌈The focus below is on the 3390-3380 support line. 🥅If it falls back but does not break, you can consider going long.📈 Pay attention to the short-term resistance range of 3402-3412 on the upside. Once it breaks through, it is expected to set a new high. Otherwise, it will maintain a high-level fluctuation pattern during the day.📉

Gold (XAU/USD) Targets $3,397 – $3,406 Amid Bullish MomentumAnalysis:
The 4H chart of Gold (XAU/USD) shows strong bullish momentum after a corrective phase. Price has broken above consolidation and is currently trading around $3,382, with upside targets at $3,397 and $3,406 (highlighted resistance zone).
The supply zone on the higher timeframe remains intact below $3,280, acting as a long-term support.
Immediate support levels lie at $3,371, $3,356, and $3,348. A break below these could shift momentum bearish.
Current bullish structure suggests that as long as price holds above $3,371, buyers may drive the price higher toward the resistance levels.
A rejection from $3,406 may lead to a pullback toward the mid-support zone before another attempt higher.

Gold Shows Potential Breakout at $3,390Gold (XAU/USD) has been exhibiting mixed price action over the past few weeks. On the 4-hour chart, we notice a critical resistance trendline forming a descending pattern that has contained price movement for some time. The current price stands at $3,390.26, indicating a potential breakout scenario.
Key Levels to Watch
Resistance: $3,400 – A level that has repeatedly capped upward movements.
Support: $3,325 – The lower boundary of recent price consolidation.
Immediate Buy Level: $3,390.54
Immediate Sell Level: $3,390.32
The price is currently testing the descending trendline, suggesting a possible upward momentum if bulls sustain above this level. Traders should be cautious of a false breakout, as consolidation is still evident around $3,375 – $3,400.
RSI Analysis
The Relative Strength Index (RSI) 14-period shows the momentum hovering near the 60-65 zone, indicating moderately strong buying pressure but not yet overbought. Previous RSI peaks near 70 triggered minor pullbacks, highlighting the importance of this indicator for spotting reversals.
ZigZag Indicator Insight
The ZigZag 5 10 indicator highlights the swing highs and lows, helping traders visualize the trend reversal points. The recent formation suggests a potential shift toward an upward trend if the current breakout holds above the resistance.
Trading Strategy
1. Bullish Scenario:
Entry above $3,400 with a target near $3,450.
Stop loss around $3,375 to manage risk.
2. Bearish Scenario:
If the breakout fails and price dips below $3,375, short positions could target $3,325.
Confirm with RSI moving below 50 for stronger conviction.
Conclusion
XAU/USD is showing signs of a potential bullish breakout after a prolonged period of consolidation. Traders should monitor the $3,400 resistance level closely and watch RSI behavior for momentum confirmation. With careful risk management, this could be a profitable swing trade opportunity.

Elliott Wave Analysis XAUUSD – August 28, 2025
Momentum
• D1 timeframe: Momentum is still in a bearish reversal zone (overbought). Price is stalling but has not yet given a clear reversal confirmation → showing that bullish strength is weakening.
• H4 timeframe: Momentum is also turning bearish → from now until the US session, price is likely to continue sideways or decline further.
• H1 timeframe: Momentum is turning bullish → suggesting a short-term corrective rally or sideways movement.
Wave Structure
• D1 timeframe: At the moment, there are two possible wave counts (as mentioned in yesterday’s plan). Both scenarios point to the same outcome: after completing the correction, price will move higher.
o Key note: The final corrective structure is a triangle. Once this triangle completes, it typically signals a strong upward breakout, confirming the end of the corrective phase.
• H4 timeframe: Price is consolidating within a contracting triangle, leaving two possibilities:
1. Leading diagonal for wave 4 (abcde) → once completed, price could drop sharply towards the 0.618 Fibonacci retracement.
2. Ending triangle for wave d → a strong wave e decline is expected before the next rally begins. In this case, the signal to watch is price testing the lower boundary of the triangle.
• H1 timeframe: A leading diagonal is forming, while RSI shows bearish divergence at the top. This supports the sell scenario. However, since H1 momentum is currently bullish, we expect one more push higher into resistance at 3403, which will provide a potential short opportunity.
o Note: Today’s US Jobless Claims data could trigger a stop-hunt move upward before a strong sell-off. Ahead of the news, price may continue ranging between 3385 – 3387.
Trading Plan
• Since price has not dropped significantly yet, it is likely still within wave 5 of the triangle. The upper resistance at 3403 is an ideal sell zone.
• A safer option: wait for price to break below the triangle’s lower boundary and close beneath it → then look for a breakout sell setup.
• Target: 0.618 Fibonacci retracement at 3345.
Trade Setup
• Sell Zone: 3403 – 3405
• Stop Loss: 3413
• Take Profits:
o TP1: 3374

Gold (XAU/USD) 28 August 2025Gold continues to consolidate within a high-volatility environment, with price testing key liquidity pools and approaching unmitigated supply/demand levels. Today’s analysis blends Daily macro bias, 4H swing structure, and 1H execution refinement to identify the most reliable zones for institutional-grade entries.
🔵 Demand Zones (Buy Setups)
Primary Buy Zone: $3360 – $3370
This is today’s highest-probability demand area.
Daily: Bullish structure intact with higher-highs and higher-lows.
4H: Fresh bullish Order Block formed after a strong BOS (Break of Structure).
1H: Liquidity sweep below recent lows at 3372, providing a refined entry trigger.
Indicators: RSI recovery from oversold divergence; MACD showing momentum reversal.
Volume: Absorption at 3365 confirms buyer presence.
Execution Plan:
SL: 3350 (structure invalidation)
TP1: 3405
TP2: 3425
Secondary Buy Zone: $3325 – $3335
Daily: Nested demand block aligning with prior bullish BOS.
4H: Deep discount zone of previous swing.
1H: ICT displacement candle originated at 3330, unmitigated.
Execution Plan:
SL: 3310
TP1: 3365
TP2: 3400
🔴 Supply Zones (Sell Setups)
Primary Sell Zone: $3420 – $3430
This is the nearest high-probability supply area.
Daily: Strong resistance shelf; unmitigated supply.
4H: Bearish OB after displacement down from 3428.
1H: Liquidity pool resting above 3415 equal highs.
Indicators: Bearish RSI divergence; MACD momentum fading.
Execution Plan:
SL: 3440
TP1: 3390
TP2: 3365
Secondary Sell Zone: $3455 – $3465
Daily: Weekly supply nested in premium pricing.
4H: Swing-high liquidity at 3460 remains untested.
1H: Inefficient wick zone above equilibrium.
Indicators: RSI extreme overbought; ATR volatility ceiling.
Execution Plan:
SL: 3475
TP1: 3430
TP2: 3400
⭐ Executive Summary – Golden Zone
The Primary Buy Zone at $3360 – $3370 stands out as today’s Golden Zone:
Backed by 6 institutional confluences across Daily, 4H, and 1H.
Well-defined risk with SL at 3350.
Reward asymmetry toward TP1 at 3405 and TP2 at 3425.
This zone offers the cleanest risk-to-reward profile, aligning macro structure with intraday liquidity positioning.
⚖️ Final Note
As always, zones are execution frameworks, not blind signals. Wait for confirmation on 1H/15M displacement and liquidity sweeps before entering. Managing risk with precision is crucial given Gold’s current volatility and ATR expansion.

GOLD : 1D - X SETUP Hello , Welcome 🙏
We Are Looking X Setup On 1D Timeframe
BUYTRENDLINE + SELL TRENDLINE BREAKOUT
CISD + BUY ENGULFING ZONE
BUY ZONES ⬇️
3376 / 3360 - 3355 / 3350 - 3330
Good Luck With Your Trading

Gold Trade Set Up Aug 27 2025OANDA:XAUUSD
www.tradingview.com
In asai session gold swept PDH and in london session gold made LH/LL so for sells i will want to test LH and close below then make internal structure to go lower towards SSL. But if price closes above LH i will look for a continuation higher to BSL

Watch Resistance at 3391–3398, Avoid Chasing HighsGold rebounded strongly from 3352 support today, breaking through the 3358–3366 resistance and rallying to 3386 before consolidating. During this phase, multiple tests of the 3368 support held firm, and price has now returned above 3380, keeping the overall bias bullish.
⚠️ However, caution is warranted: resistance is not only near 3386 but also at the 3391–3398 zone, where fresh selling pressure is likely. The upside looks limited, making blind chasing risky.
📌 Suggestion: Focus on sell opportunities around resistance. For larger accounts with proper position sizing, chasing a short-term rally may be manageable; but for smaller accounts, chasing highs carries significant risk and is not recommended.
These are my personal views for reference only. Please evaluate carefully based on your own situation. If you’d like more tailored guidance, feel free to reach out.

XAUUSD Analysis Today Hello traders, this is a complete multiple timeframe analysis of this pair. We see could find significant trading opportunities as per analysis upon price action confirmation we may take this trade. Smash the like button if you find value in this analysis and drop a comment if you have any questions or let me know which pair to cover in my next analysis.
