NIFTY 50 Index (2H timeframe) ..NIFTY 50 Index (2H timeframe)
---
Current Market Context
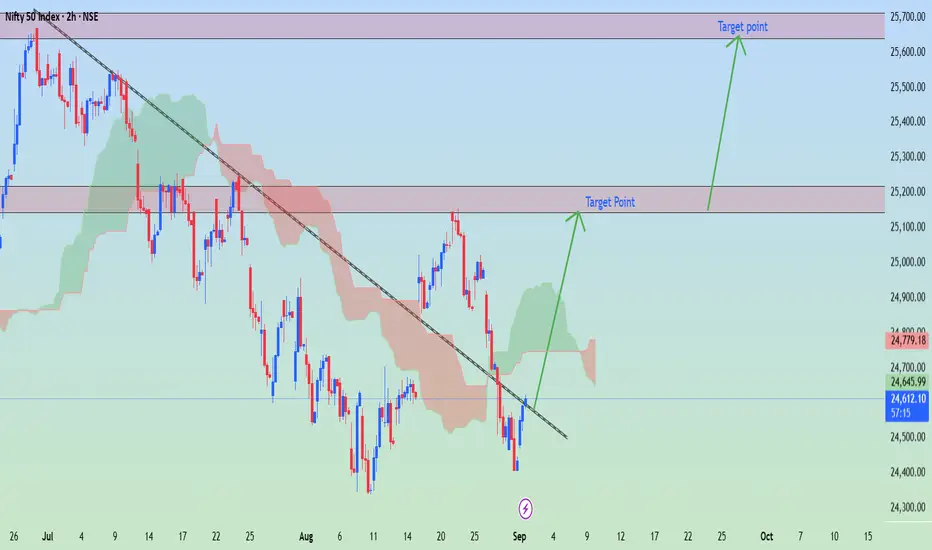
Instrument: NIFTY 50 Index (NSE)
Current Price: ~24,709
Trend: Recently bounced from a support zone after a downtrend.
Indicators: Price is trying to recover above the Ichimoku cloud and has broken a short-term descending trendline.
---
Targets Marked on my Chart
1. First Target Zone: 25,150 – 25,200
This is the immediate resistance / supply zone.
Likely to be tested first on bullish continuation.
2. Second Target Zone: 25,550 – 25,600
This is the extended bullish target.
It aligns with the next major resistance zone marked in your chart.
---
Trade Idea
Entry Zone: Around 24,700 – 24,750 (current levels).
Take Profit 1: ~25,150 – 25,200.
Take Profit 2: ~25,550 – 25,600.
Stop Loss: Below recent swing low (~24,500).
---
⚠ Note: NIFTY moves strongly with global cues and India’s market data. If bulls fail to hold above 24,500, bearish pressure could resume.
Xauusdupdate
(XAUUSD – Gold Spot vs U.S. Dollar, 2h timeframe)(XAUUSD – Gold Spot vs U.S. Dollar, 2h timeframe), just look my marked a breakout above the downtrend line with a bullish move.
Key Levels on my Chart.
Current Price: ~3,378
Support Zone: 3,351 – 3,361 (highlighted green box and Ichimoku cloud support)
Target (marked on chart): ~3,410
Technical Observation:
The price has broken above resistance near 3,361 and is retesting it.
The breakout suggests momentum towards the next resistance.
My chart shows the target zone at 3,410, which is the next resistance area.
👉 Target: 3,410 (short-term upside target) if the bullish momentum continues.

GOLD Very Bullish , Can We Buy Again And Get 200 Pips ?Here is My 15 Mins Gold Chart , and here is my opinion , we finally above 3400.00 and we have a 4H Candle closure above it and we have a Perfect Breakout and this give us a very good confirmation , so we have a good confirmation now to can buy from 3400.00when the price back to retest it , we need the price to go back and retest it and give us a good bullish price action and then we can enter , we can targeting 100 to 200 pips . if we have a daily closure below this area this mean this idea will not be valid anymore .
Reasons To Enter :
1- Perfect Touch For The Area .
2- Clear Bullish Price Action .
3- Bigger T.F Giving Good Bullish P.A .
4- The Price Take The Last High .
5- Perfect 15 Mins Closure .

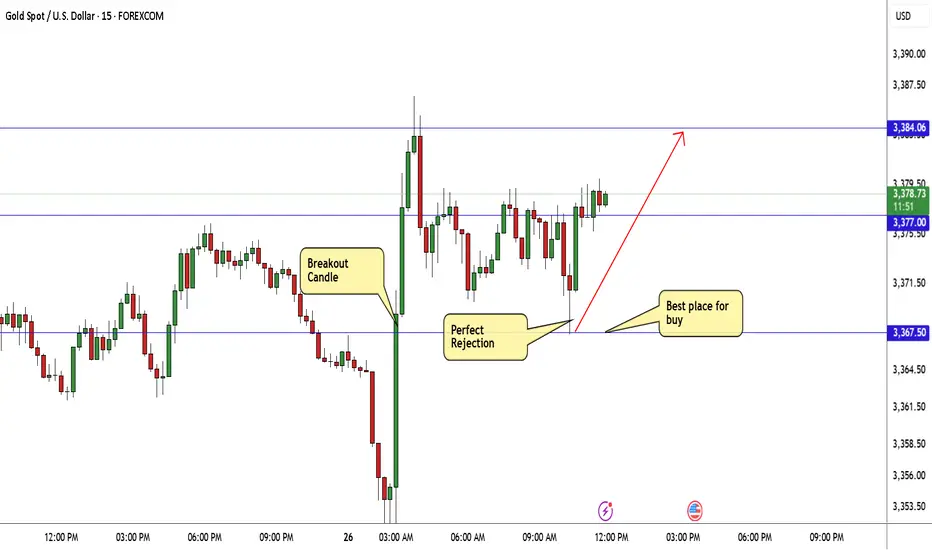
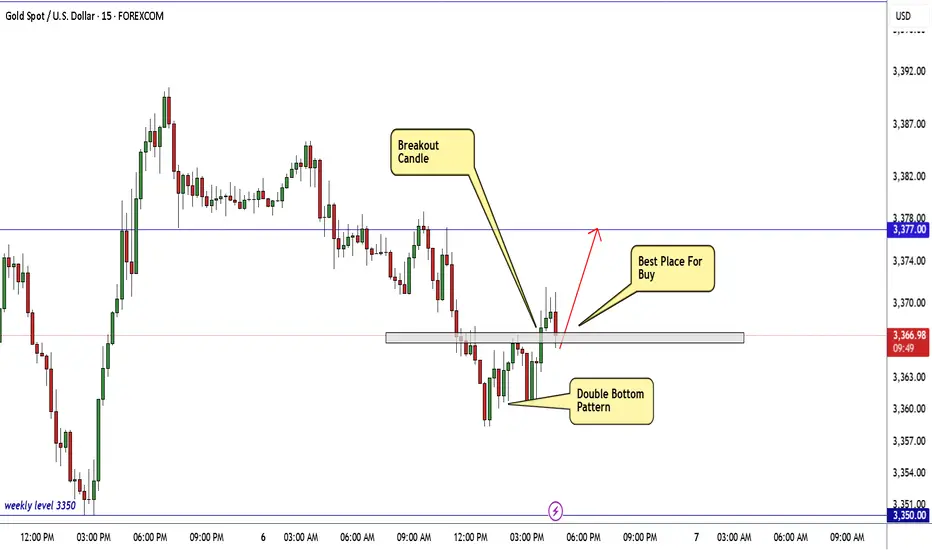
GOLD Still Very Bullish , 2 Chances To Buy And Get 200 Pips !Here is My 15 Mins Gold Chart , and here is my opinion , we finally above 3377.00 and we Still Not have a 4H Candle closure above it but we have a Perfect Breakout and this give us a very good confirmation , so we have a good confirmation now to can buy from 2 places , first one and best one for me will be 3377.00 , we need the price to go back and retest it and give us a good bullish price action and then we can enter , or if you a aggressive trader you can enter from 3381.00 cuz we have a small double bottom reversal pattern so we can enter from neckline also . we can targeting 100 to 200 pips . if we have a daily closure below this area this mean this idea will not be valid anymore .
Reasons To Enter :
1- Perfect Touch For The Area .
2- Clear Bullish Price Action .
3- Bigger T.F Giving Good Bullish P.A .
4- The Price Take The Last High .
5- Perfect 15 Mins Closure .
6- Small Reversal Pattern .

GOLD Breakout Done , Long Setup Valid To Get 200 Pips !Here is My 15 Mins Gold Chart , and here is my opinion , we finally above 3367.50 and we have a 4H Candle closure above it And Perfect Breakout and this give us a very good confirmation , so we have a good confirmation now to can buy after the price go back to retest the broken area 3367.50 , and we can targeting 100 to 200 pips . if we have a daily closure below this area this mean this idea will not be valid anymore .
Reasons To Enter :
1- Perfect Touch For The Area .
2- Clear Bullish Price Action .
3- Bigger T.F Giving Good Bullish P.A .
4- The Price Take The Last High .
5- Perfect 15 Mins Closure .
XAU/USD (Gold) on the 4-hour timeframe. XAU/USD (Gold) on the 4-hour timeframe.
📊 Chart Observations:
My analysis marked a breakout zone from a consolidation/triangle pattern.
Price is currently trading around $3,376 (as shown).
The chart shows two target points:
First target: Around $3,410
Second target: Around $3,460
🎯 Possible Targets:
1. Immediate Target (Short-Term):
If the breakout sustains, the first resistance/target level is at $3,410.
2. Extended Target (Medium-Term):
If momentum continues and price breaks above $3,410, the next target is near $3,440.
3. Support Levels to Watch:
$3,362 (short-term support)
$3,348 (stronger support if price pulls back)
⚠ Reminder: This is technical analysis, not financial advice. Always manage risk with stop-losses, as gold can be very volatile.

GOLD Best Places To Buy And Sell Cleared , 400 Pips Waiting !Here is m y opinion on GOLD On 15 Mins T.F , We have a sideway movement since week start between 3343.00 to 3326.00 so we can buy and sell from both areas , 3343.00 will be the best place for sell and 3326.00 will be the best place for buy , now the price very near buy area we can wait the price to retest the support area and then enter a buy trade and targeting 3343.00 and when the price touch it and give us a good bearish P.A , we can enter a sell trade and targeting 3326.00 .

GOLD For Buy , Clear Closure & Clear Confirmation,200 Pips ClearHere is My 15 Mins Gold Chart , and here is my opinion , we finally above 3345.00 and we have a 4H Candle closure above it And Perfect Breakout and this give us a very good confirmation cuz we have not any 4H closure above this area since this week start , so we have a good confirmation now to can buy after the price go back to retest the broken area or even direct entry now to can use a small stop loss , and we can targeting 100 to 200 pips . if we have a daily closure below this area this mean this idea will not be valid anymore .
Reasons To Enter :
1- Perfect Touch For The Area .
2- Clear Bullish Price Action .
3- Bigger T.F Giving Good Bullish P.A .
4- The Price Take The Last High .
5- Perfect 15 Mins Closure .

GOLD Buyers In Control Now , Long Setup To Get 200 Pips !Here is My 15 Mins Gold Chart , and here is my opinion , we finally above 3358.00 and we have a 4H Candle closure above it And Perfect Breakout and this give us a very good confirmation cuz we have not any 4H closure above this area since this week start , so we have a good confirmation now to can buy after the price go back to retest the broken area to can use a small stop loss , and we can targeting 100 to 200 pips . if we have a daily closure below this area this mean this idea will not be valid anymore .
Reasons To Enter :
1- Clear Breakout On Bigger T.F
2- Clear Bullish Price Action .
3- Bigger T.F Giving Good Bullish P.A .
4- The Price Take The Last High .

Gold Spot / U.S. Dollar (XAUUSD) 4-Hour Chart - OANDA4-hour price movement of Gold Spot (XAUUSD) against the U.S. Dollar, sourced from OANDA. The current price is $3,349.050, reflecting a decrease of $48.715 (-1.43%) as of 01:11:40. Key levels include a sell price of $3,348.830 and a buy price of $3,349.380, with a highlighted support zone around $3,348.849 and a resistance zone near $3,370.815. The chart covers the period from early August to mid-September 2025.

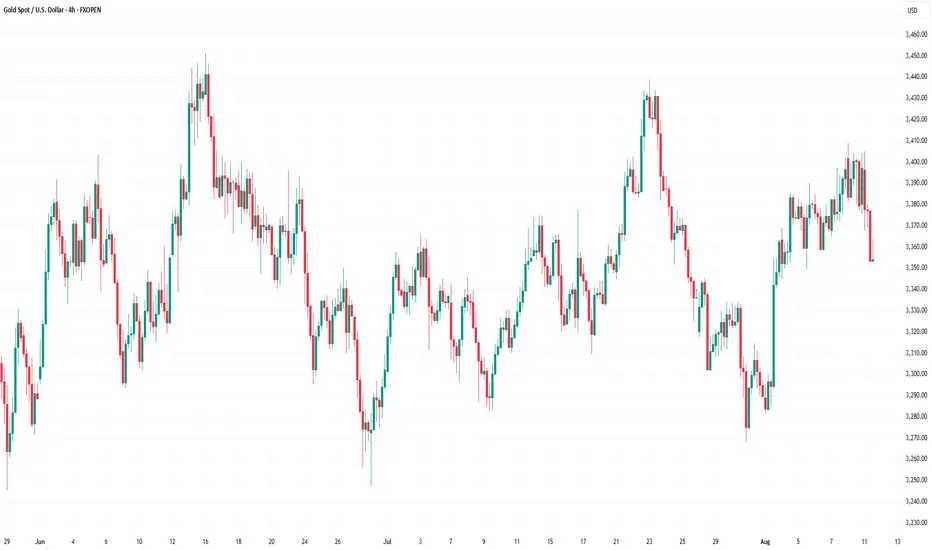
Gold Price Declines Amid Easing Geopolitical TensionsGold Price Declines Amid Easing Geopolitical Tensions
It has been announced that a meeting between the Presidents of the United States and Russia will take place this week. Donald Trump and Vladimir Putin are expected to meet in Alaska. This will mark the first face-to-face talks between the leaders of the two major powers since 2021, when Putin met with Biden in Geneva.
The upcoming meeting is widely seen as a potential step towards ending the full-scale military conflict in Ukraine, which began in 2022. Anticipation of the talks is easing geopolitical tensions, which is reflected in today’s downward movement of the gold price, visible on the XAU/USD chart.
XAU/USD Technical Analysis
Today, gold prices have fallen to the $3,360 area, with several bearish signals apparent on the chart:
→ The decline occurred on long bearish candles (as shown by the arrow). From a price action perspective, this suggests mounting selling pressure.
→ The MACD histogram has moved below zero, with the indicator lines pointing downward.
→ Gold has broken the upward trendline support from above (marked in blue). The breakout level, around $3,380, may now act as resistance, as sellers have asserted their dominance here.
→ From a broader perspective, the price appears to be reversing from the resistance line drawn through this summer’s highs.
Given these factors,we could assume that gold is heading towards the lower black trendline, which runs through the notable July lows and forms a channel with the upper line. However, along the way, sellers will need to overcome a key support zone in the form of a bullish Fair Value Gap (marked in purple). The upper boundary of this zone is reinforced by the 50% Fibonacci retracement level plotted from the bullish impulse points A→B.
Whether the bears can push the price through the FVG zone will largely depend on gold’s reaction to tomorrow’s US inflation data (CPI release scheduled for 15:30 GMT+3).
This article represents the opinion of the Companies operating under the FXOpen brand only. It is not to be construed as an offer, solicitation, or recommendation with respect to products and services provided by the Companies operating under the FXOpen brand, nor is it to be considered financial advice.
GOLD Melted , Clear Chance To Buy It Now , 150 Pips Waiting !Here is My 15 Mins Gold Chart , and here is my opinion , the price go down very hard after touch 3400.00 and melted to 3353.00 and we finally above 3358.00 and we have a 30 Mins Candle closure above it And Perfect Breakout and perfect bullish price action , so we have a good confirmation now to can buy it and we can targeting 100 to 200 pips as a small correction after this huge movement to downside in a very short period , so i will buy it to see if we have a correction for 150 to 200 pips at least .
Reasons To Enter :
1- New Support Created .
2- Bullish Price Action .
3- Bigger T.F Giving Good Bullish P.A .
4- 30 Mins Confirmation
5- Little Correction .

GOLD Breakout Done , Long Setup Valid To Get 150 Pips !Here is My 15 Mins Gold Chart , and here is my opinion , we finally above 3384.00 and we have a 30 Mins Candle closure above it And Perfect Breakout , so we have a good confirmation now to can buy it and we can targeting 100 to 150 pips .
Reasons To Enter :
1- New Support Created .
2- Bullish Price Action .
3- Bigger T.F Giving Good Bullish P.A .
4- Clean Breakout .

GOLD Ready To Go Up From Current Price , 150 Pips WaitingHere is My 15 Mins Gold Chart , and here is my opinion , we finally above 3365.00 and we have a 30 Mins Candle closure above it And Perfect Breakout , so we have a good confirmation now to can buy it and we can targeting 100 to 150 pips .
Reasons To Enter :
1- New Support Created .
2- Bullish Price Action .
3- Bigger T.F Giving Good Bullish P.A .
4- Clean Breakout .
5- Reversal Pattern .
GOLD Breakout Done , Long Setup Valid To Get 150 Pips !Here is My 15 Mins Gold Chart , and here is my opinion , we finally above 3350.00 and we have a 30 Mins Candle closure above it And Perfect Breakout , so i`m waiting the price to go back and retest this res and new support and give me a good bullish price action to can enter a buy trade and we can targeting 100 to 150 pips .
Reasons To Enter :
1- New Support Created .
2- Bullish Price Action .
3- Bigger T.F Giving Good Bullish P.A .
4- Clean Breakout .

GOLD Bullish Today , Long Scalping Entry Valid To Get 150 Pips !Here is My 15 Mins Gold Chart , and here is my opinion , we finally above 3296.00 and we have a 30 Mins Candle closure above it , so i`m waiting the price to go back and retest this res and new support and give me a good bullish price action to can enter a buy trade and we can targeting 100 to 150 pips .
Reasons To Enter :
1- New Support Created
2- Bullish Price Action
3- Bigger T.F Giving Good Bullish P.A .

Market Analysis: Gold Prices Ease – Market Awaits Fresh CatalystMarket Analysis: Gold Prices Ease – Market Awaits Fresh Catalyst
Gold price started a fresh decline below $3,380.
Important Takeaways for Gold Price Analysis Today
- Gold price climbed higher toward the $3,430 zone before there was a sharp decline against the US Dollar.
- A key bearish trend line is forming with resistance near $3,350 on the hourly chart of gold at FXOpen.
Gold Price Technical Analysis
On the hourly chart of gold at FXOpen, the price climbed above the $3,380 resistance. The price even spiked above $3,400 before the bears appeared.
A high was formed near $3,432 before there was a fresh decline. There was a move below the $3,380 support level. The bears even pushed the price below the $3,350 support and the 50-hour simple moving average.
It tested the $3,325 zone. A low was formed near $3,325 and the price is now showing bearish signs. There was a minor recovery wave towards the 23.6% Fib retracement level of the downward move from the $3,433 swing high to the $3,325 low.
However, the bears are active below $3,342. Immediate resistance is near $3,350. There is also a key bearish trend line forming with resistance near $3,350.
The next major resistance is near the $3,380 zone. It is close to the 50% Fib retracement level of the downward move from the $3,433 swing high to the $3,325 low. The main resistance could be $3,410, above which the price could test $3,432. The next major resistance is $3,450.
An upside break above $3,450 could send the gold price towards $3,465. Any more gains may perhaps set the pace for an increase toward the $3,480 level.
Initial support on the downside is near the $3,325 level. The first major support is near the $3,310 level. If there is a downside break below it, the price might decline further. In the stated case, the price might drop towards the $3,265 support.
This article represents the opinion of the Companies operating under the FXOpen brand only. It is not to be construed as an offer, solicitation, or recommendation with respect to products and services provided by the Companies operating under the FXOpen brand, nor is it to be considered financial advice.

GOLD Melted , 2 Best Places To Sell Clear , Don`t Miss 200 Pips Here is My 30 Mins Gold Chart , and here is my opinion , we Again Below 3377.00 and we have a 30 Mins Candle closure below this strong res , so i`m waiting the price to go back and retest this res and new support and give me a good bearish price action to can enter a sell trade and we can targeting 200 pips , and we have a good res @ 3365.00 we can sell from it also if the price didn`t reach 3377.00 and targeting from 100:200 pips , and if we have a Daily Closure below This res this will increase the reasons for us , just wait the price to back a little to retest it and then we can sell it . if we have a daily closure aboveit this idea will not be valid anymore .

Gold UpdateGold (XAUUSD) is currently trading between PD High and PD Low, showing signs of consolidation after a recent downtrend.
Price reacted from the demand zone near PD Low and is now testing a minor resistance zone.
Key levels to watch: 3375–3385 resistance and 3355–3360 support.
Break above 3385 could open the path toward 3395–3400.
Failure to hold 3355 may trigger further downside toward 3340.
Waiting for clean structure and candlestick confirmation for directional bias.

GOLD Still Bullish , Are You Ready For New Wave ? 200 Pips ValidHere is My 15Mins Gold Chart , and here is my opinion , we finally above 3400.00 and we have a 30 Mins Candle closure above this strong res , so i`m waiting the price to go back and retest this res and new support and give me a good bullish price action to can enter a buy trade and we can targeting 200 pips , and if we have a 4H Closure Above This res this will increase the reasons for buyers , just wait the price to back a little to retest it and then we can buy it . if we have a daily closure below it this idea will not be valid anymore .
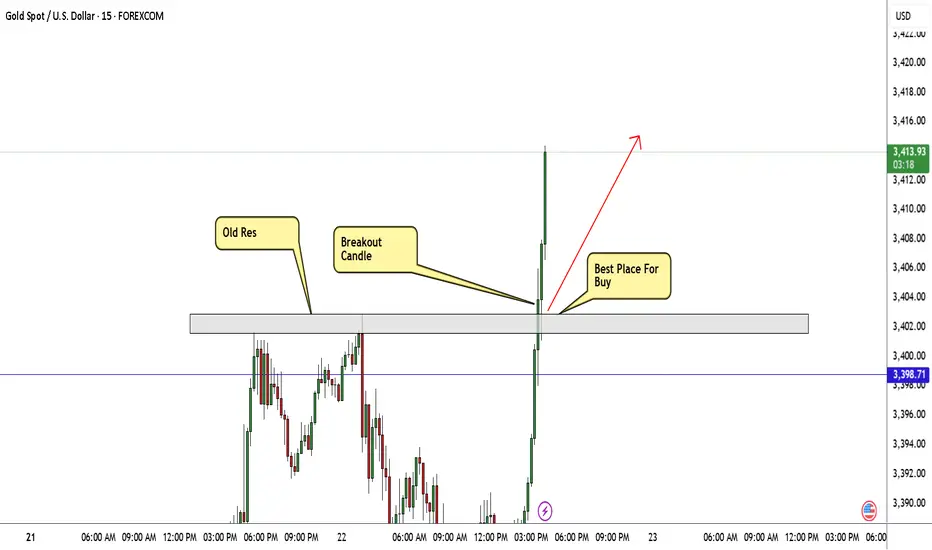
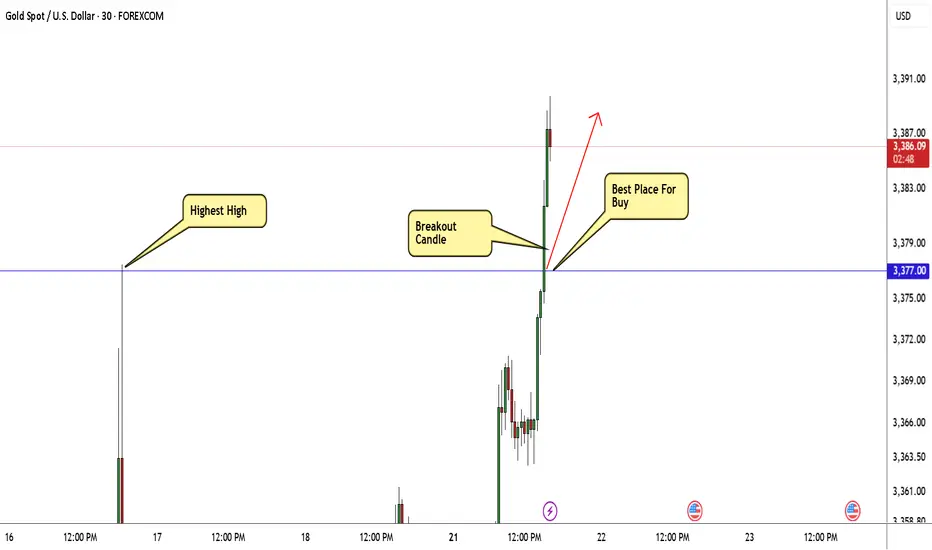
GOLD Breakout Done , Long Setup Valid To Get 200 Pips !Here is My 30 Mins Gold Chart , and here is my opinion , we finally above 3377.00 and we have a 30 Mins Candle closure above this strong res , so i`m waiting the price to go back and retest this res and new support and give me a good bullish price action to can enter a buy trade and we can targeting 200 pips , and if we have a 4H Closure Above This res this will increase the reasons for buyers , just wait the price to back a little to retest it and then we can buy it . if we have a daily closure below it this idea will not be valid anymore .
GOLD Made Triple Top Pattern , Short Setup Very Clear !Here is my opinion on 15 Mins T.F On Gold , we have a triple Top Reversal Pattern , on 15 mins and 30 mins T.F , And we have a clear closure below neckline , so i think we can sell this pair for 100 pips at least to get this pattern target , we can sell from the current price or from m y best area for sell .

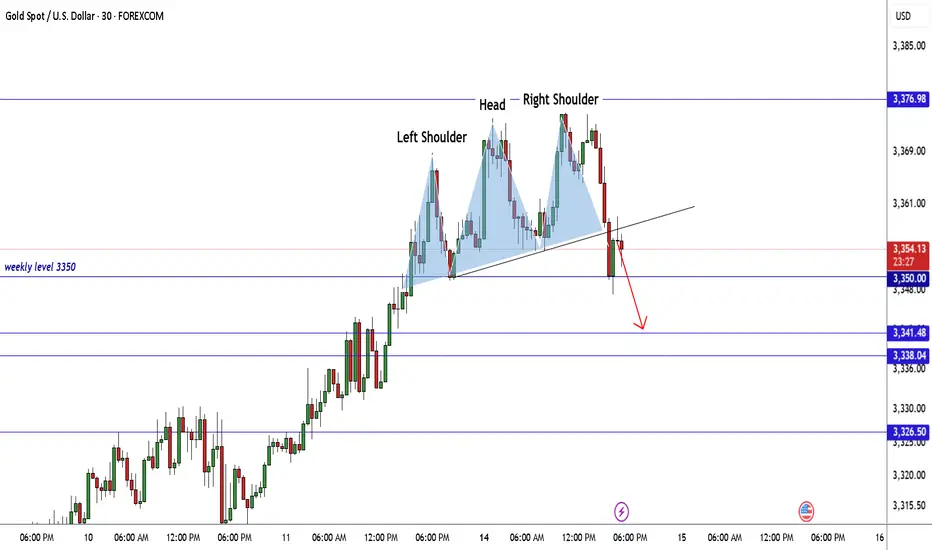
GOLD Made H&S Reversal Pattern , Scalping Short Setup Valid !Here is my GOLD 30 Mins Chart and if we checked the chart we will see that the price created a very good reversal pattern on 30 mins T.F , Head & shoulders reversal pattern and also it`s already confirmed by closure below neckline so the short is very clear now and we can targeting 100 to 150 pips , 3350.00 is a very good support also so we can see a price bounce from it to upside .