BTCUSD: Choppy VolatilityBTCUSD is experiencing volatile swings today, primarily driven by divergent Fed policy stances, alongside technical bull-bear tussles and market capital sentiment.
During the Asian session, Bitcoin briefly surged above 88,000 in the morning before reversing course in the afternoon, sliding below 86,000.
Key Levels:
Support Zones:
Primary support lies at the Bollinger Bands midline region of 85,500 – 86,000.
Secondary support is near the recent swing low around 83,500 – 84,000.
Strong support converges at the psychological and prior low zone of 80,000 – 82,000. A breakdown below the critical 80,000 level could trigger a deeper correction.
Resistance Levels:
Immediate resistance is concentrated at 87,500 – 88,000; a breakout here is necessary to mount a challenge on 89,000.
89,000 stands as a key market-focus resistance level. A decisive breach may pave the way for a test of the 90,000 psychological mark.
Buy 85000 - 85500
SL 84500
TP 86800 - 87200
Sell 87500 - 88000
SL 88500
TP 86000 - 85000
Xauusdupdates

Gold (XAU/USD) 2H Chart Analysis – Sell Setup from High ProbabilBased on the chart you provided, Gold is currently reacting near a High Probability POI (supply zone) after a corrective bullish move. The structure still shows:
Lower highs and lower lows → Bearish market structure
Price is approaching a supply zone where sellers previously dominated
Liquidity has been taken above internal highs (marked as "$$$"), indicating a liquidity grab
This supports a short position idea from the supply zone.
🔍 Key Technical Levels
Zone / Level Meaning
4,125 – 4,150 USD High Probability POI / Supply (Sell area)
4,080 – 4,100 USD Entry region (price is currently here)
4,040 – 4,025 USD First reaction / partial take zone (50% area)
3,990 – 4,000 USD Main Target (previous demand + equal lows)
🎯 Suggested Target
Primary Target: $4,000
(Exactly aligning with your chart’s marked “TARGET” zone where liquidity sits)
If momentum continues and structure breaks more aggressively:
Extended Target: $3,975 – $3,960
(deeper sweep into demand)
🛑 Risk Management
Detail Level
Stop Loss Above 4,155 USD (beyond POI + liquidity)
R:R Potential Approx. 1:3 to 1:4
📌 Summary
Price has retraced into a key supply zone
Liquidity was taken → seller confirmation likely
Expectation is continuation downward towards the liquidity pool below
📊 Title Recommendation:
“Gold Retests Supply Zone – Bearish Continuation Toward $4,000 Expected”

XAU/USD – Gold Under Heavy Pressure, 4,000$ Break Looks ImminentGold continues to slide as the US Dollar strengthens, fueled by resilient US data. With markets waiting for the final week of November and the upcoming FOMC decision, safe-haven flows remain weak—making XAU/USD extremely vulnerable to further downside.
📊 Technical Outlook – H1/H30
The short-term structure remains clearly bearish:
1️⃣ Trend Bias: Bearish
Price keeps rejecting the descending trendline.
Every pullback is shallow and absorbed quickly by intraday supply zones.
2️⃣ Key Technical Levels
Resistance / Supply Zones:
4,078 – 4,089
4,104 (major confluence: Fibo + H1 supply)
Support / Liquidity Targets:
4,023 – 4,013
3,989 – 3,975 → major liquidity zone (high reaction probability)
3️⃣ Scenarios to Watch
🔻 Scenario 1 — Continuation Drop (Primary Bias)
Break below 4,044 → targets 4,023, then the liquidity sweep at 3,99x – 3,97x.
🔄 Scenario 2 — Pullback Before Drop
Retracement to 4,054 – 4,078 → rejection → continuation lower.
🔺 Scenario 3 — Deeper Recovery (Low Probability)
Only valid if price closes above 4,104, unlocking a move toward 4,13x – 4,15x.
🎯 MMF Trading Plan
SELL – Trend-Following (Primary)
Sell Zone 1: 4,054 – 4,078
SL: 4,105
TP: 4,023 → 4,013 → 3,99x
Sell Zone 2: 4,089 – 4,104
SL: 4,112
TP: 4,054 → 4,023
BUY – Only as a Reaction Trade (Liquidity Sweep)
Buy Zone: 3,99x – 3,97x
SL: 3,955
TP: 4,023 → 4,054
⚠️ Buy setups are counter-trend and require strong confirmation.
Primary bias remains SELL as long as price stays below 4,104.
⚜️ MMFLOW TRADING View
Gold is being pushed toward the psychological 4,000$ support.
A clean break could trigger a broader bearish expansion into 3,98x – 3,95x.
With month-end positioning, FOMC expectations, and shifting Fed sentiment, volatility is likely to increase sharply.
Stay with the trend—SELL the rallies. BUY only at deep liquidity zones with confirmation.

Gold: Short-term pullback amid bearish pressureGold is trading with a downward oscillation bias today, suppressed by factors including fading Fed rate cut expectations and a strong US dollar. Amid bull-bear tussle, short-term momentum remains indecisive.
During the Asian session, London Gold extended the previous day’s pullback with muted early volatility. Selling pressure intensified in the afternoon, amplifying short-term downward momentum.
While the medium-to-long-term uptrend structure remains intact, near-term headwinds have pushed prices into a consolidative decline.
Key Levels:
Resistance: The immediate resistance zone lies at 4,087 – 4,090, where price previously retreated after facing selling pressure and continues to cap rallies today. A decisive break above the critical psychological level of 4,100 is required to unlock further upside momentum.
Support: Short-term support is concentrated around 4,020 – 4,030. A breakdown below this zone could trigger a test of 4,000, a level likely to attract fresh buying interest. However, a valid breach of 4,000 may spark a deeper correction.
Trading Strategy:Our core approach today is "Prioritize selling on rallies, complement with short-term long positions at support levels, and follow trends on breakouts".
Sell 4075 - 4085
SL 4090
TP 4050 - 4040 - 4030
Buy 4020 - 4030
SL 4015
TP 4050 - 4060 - 4070

Gold Dancing Around 4050– Will the Market Rhyme With Last Month?1. Recap of Last Week’s Price Action
Last week started with a fake attempt at recovery:
Gold reversed early in the week back above 4100, reaching a local high around 4133.
From there, sellers stepped back in and pushed the price lower, bringing us once again into the familiar 4050–4100 range I have been talking about for days.
On Friday, we had a classic whipsaw:
- Price dipped below 4050 support,
- Then reversed sharply and tested 4100 resistance again,
- Only to close the day slightly above support, right back inside the range.
Today, during the Asian session, selling pressure returned and Gold is trading below 4050 support once again. The market is still orbiting this key zone like a magnet.
2. Current Technical Picture – A Heavy Market Hiding Behind a Sideways Range
Right now, the chart shows:
- Well-defined resistance: 4100–4110
- Broken/fragile support: 4050
- Key downside reference: 3900 zone
Even though we are “just” ranging between 4050 and 4100 most of the time, I still see the structure as heavy, not neutral.
The fact that:
- Every bounce above 4100 fails quickly, and
- Every dip below 4050 gets a bit deeper or a bit more frequent,
…suggests that sellers are slowly gaining control, even if there is no clean breakdown yet.
3. Bigger Picture Outlook – Why I Still Expect 3900 📉
My medium-term outlook remains the same:
➡️ I still expect a drop toward the 3900 zone.
Why?
- Failed upside follow-through:
- The reversal back around 4100 looked promising for bulls, but there was no continuation. That kind of failed breakout often precedes a deeper leg down.
Support erosion at 4050:
4050 used to be a clean support. Now it’s constantly pierced, reclaimed, then lost again. When a level is “played with” too much, it often breaks properly later.
Lack of strong bullish candles:
We see bounces, yes, but not the kind of decisive ones that normally start a new leg up.
Because of this, I still see 3900 as the next logical destination once the market finally gives up on this range.
For now, I’m out of the market, waiting patiently to sell rallies, not chase price in the middle.
4. The “Rhyme” With Last Month – A Speculative but Interesting Angle 📅
“Markets don’t repeat, but they often rhyme.”
If we look back at last month’s end-of-month action, there’s an interesting similarity in structure:
- On Thu 23 Oct, we had a low, then a reversal up.
- By Mon 27 Oct, price was back to support around 4050 – yes, the same 4050 zone we’re dealing with now.
- On that Monday, we then got the real break, followed by a 1,500-pip drop into Thu 28 Oct.
Now compare that to the current price action:
- We have a low → bounce → failure → back to 4050 pattern,
- We’re again at (or just under) 4050,
- The broader structure feels like a tired consolidation after an earlier strong move.
Is this a guarantee that we’ll see another sharp fall like last time?
👉 Of course not. This is only speculation and observation.
But the similarity in the structure is worth keeping on the radar, especially considering that:
- We’re again at 4050,
- We’re again in a sideways consolidation after a strong leg down
- And again the market seems to be “deciding” whether to finally break.
If the “rhyme” plays out, we might see:
- A bit more back-and-forth around 4050–4080,
- A clean, decisive break of 4050,
- A more direct move toward 3900 (or even beyond) with less hesitation than now.
5. Trading Plan – What I’m Actually Doing (Not Just Thinking)
Despite the interesting fractal and speculation, my plan stays simple and disciplined:
- I’m currently out of the market – volatility around 4050 is messy.
- I’m looking to sell rallies, especially if we see:
- Price popping back into 4100 area, but failing to hold, or
- Weak, corrective rebounds into resistance after another dip.
I’m not interested in chasing shorts after a big down candle at 4010 or 4000. I want price to come to me, not the other way around.
Target remains: 3900 zone.
If the market gives a similar “impulsive leg” as it did last month, this level can be reached faster than most traders expect.
6. Conclusion – Logic First, Speculation Second
Bias: still bearish.
Key level: 4050 – the market is clearly “fighting” around this line.
Plan: stay patient, sell rallies, target 3900.
The October “rhyme” is just an extra narrative layer – nice to watch, but risk management and levels still come first.
If the market decides to repeat that end-of-month pattern, I’ll be ready. If not, I’ll still trade the levels, not the story. 😊

Gold Price Outlook – Trade Setup (XAU/USD)📊 Technical Structure
OANDA:XAUUSD Gold (XAU/USD) is trading just below $4,050, stuck between a ceiling at $4,068–4,076 (Resistance Zone) and a floor at $4,008–4,018 (Support Zone). Price has repeatedly been rejected from the upper band, with lower highs forming beneath $4,080, showing that sellers are still defending this region.
As long as price holds below $4,068–4,076, the short-term bias leans sideways-to-bearish, with scope for another rotation back toward the support band around $4,018–4,007. A clean break above $4,084 would invalidate the bearish setup and expose $4,100–4,120, while a decisive move below $4,008 could accelerate losses toward $4,000.
🎯 Trade Setup
Idea: Fade the resistance – sell the rally toward $4,068–4,076, targeting a move back into the support zone.
Entry: $4,068 – $4,076
Stop Loss: $4,084
Take Profit 1: $4,018
Take Profit 2: $4,007
Estimated Risk–Reward: ≈ 1 : 3.16
Bias: Cautiously bearish while price remains capped below $4,084.
🌐 Macro Background
Gold starts the week under pressure, trading just under $4,050 despite a softer US Dollar. According to FXStreet’s Haresh Menghani, “Gold sticks to modest intraday losses… while the USD struggles to capitalize on last week’s strong move to the highest level since late May.” 【FXStreet】
Fed & Rates:
-New York Fed President John Williams called policy “modestly restrictive” and signaled room to lower rates in the near term, pushing markets to price roughly a 67% chance of a December cut.
-In contrast, Dallas Fed President Lorie Logan argued for keeping rates on hold, helping the USD retain strength and limiting gold’s upside.
Risk Sentiment:
Hopes for another December rate cut have encouraged risk-on flows, lifting Asian equities and partially dampening safe-haven demand for gold.
Geopolitics:
Ongoing Russia–Ukraine tensions and fresh Middle East risks (including Ukraine’s drone attacks and renewed Russian advances) keep a floor under gold as a hedge against geopolitical shocks.
Data Ahead:
Markets are watching a busy US data slate this week – delayed PPI, Retail Sales, Consumer Confidence, followed by Q3 GDP and the PCE Price Index. These will be crucial for refining expectations on the Fed’s 2025 rate-cut path and could trigger sharp moves in USD and gold.
Overall, fundamentals are mixed: rate-cut hopes and geopolitics are supportive, but risk-on mood and lingering USD strength make rallies into resistance attractive for tactical shorts.
🔑 Key Technical Levels
Resistance Zone: $4,068 – $4,076
Support Zone: $4,018 – $4,007
Psychological Levels: $4,050; $4,000
Bearish Invalidation: Sustained break above $4,084
📌 Trade Summary
Gold is trapped in a tight range, trading below the $4,068–4,076 resistance band. With sellers defending this zone and macro signals still mixed, the preference is to sell into strength near resistance, targeting a rotation back toward $4,032 – $4,020. A sustained break above $4,084 would invalidate the setup and suggest the start of a broader recovery toward $4,100+.
⚠️ Disclaimer
This analysis is for reference only and does not constitute trading advice. Trading involves significant risk, and proper risk management is essential.

Gold Fluctuates in Support Range; Accumulation Signals Rise⏰ Timeframe: 30m
📅 Update: 24/11/2025
🔍 Market Context
After a corrective decline from the 4,104 USD area, gold is moving within a range-bound structure with strong support at the 4,003–4,023 USD area.
The market is in a short-term re-accumulation phase, as consecutive CHoCH movements appear around the bottom area — reflecting the buying side's effort to absorb liquidity.
The selling side temporarily controls, but balancing signals are becoming clearer as the price continuously rejects breaking deeply below the Demand Zone.
📊 Technical Structure
Resistance Zone (4,090–4,104 USD): main supply area, confluence with Fibo 1.0, where profit-taking reactions are likely if the price rebounds.
Support Zone (4,023 USD): intermediate support, playing a key role in the current sideways structure.
Demand Zone (4,003 USD): potential demand area, confluence with previous liquidity bottom – main BUY Zone area.
Structure Bias: still inclined towards accumulation – recovery, as long as the price maintains above 4,003 USD.
🎯 Market Outlook
1️⃣ Priority Scenario (Buy setup):
• The price may continue to retest the Demand Zone (4,003–4,023 USD).
• When a clear reaction signal appears, expect a recovery to the Fibo 0.618 → 1.0 area, corresponding to 4,075–4,104 USD.
2️⃣ Secondary Scenario (Breakdown):
• If the price breaks below 4,003 USD, the recovery structure will be invalidated, bringing gold back to the lower liquidity area around 3,985 USD.
💎 Key Zones
BUY Zone: 4,003 – 4,023 USD
SELL Zone: 4,090 – 4,104 USD
🧠 Analyst’s View
Gold is currently in a liquidity re-accumulation phase, as both sides are testing the lower boundary of the main support area.
The buying side needs confirmation with a break above 4,075 USD, while the selling side still holds the advantage if the price cannot maintain above the balance area.
In the current context, price behavior leans towards the “Sweep – Retest – Expansion” model, with the potential for forming a short-term technical recovery wave.
🛡️ Risk Note
The market is in a low volatility area – avoid emotional actions without clear structural confirmation.

XAUUSD ANALYSIS #01 ( 24 NOV 25 )This is just our intial plan about PURPLETRADING:XAUUSD. According our analysis we marked two support zone below. Currently price is trading near our first support zone. If the price break the trend line with a strong candlestick pattern or chart pattern we will plan a trade on retest.
Either if the price move below and it goes near our second support zone. We will wait for a confirmation.
Mainly our plan is trading on the up side for today. Let's see where the market goes. Stay connect with us.

XAUUSD Analysis todayHello traders, this is a complete multiple timeframe analysis of this pair. We see could find significant trading opportunities as per analysis upon price action confirmation we may take this trade. Smash the like button if you find value in this analysis and drop a comment if you have any questions or let me know which pair to cover in my next analysis.

XAUUSD | Gold Swing Short SetupGold closed strong Bearish in Weekly now retesting the Bearish Ob, Until unless it doesn't take liquidation below, chances are higher it will dump again. Use proper risk management, if it forms the daily fvg, then take first entry from the 50% of daily fvg, 2nd from the entry mentioned, and hold till tp or SL.

Where is gold heading?Short Term Outlook for Gold
Gold continues to attract strong interest as global uncertainty supports safe haven demand. A softer United States dollar and lower real interest rates are also helping keep gold well supported, while central banks and investment funds remain key buyers.
In the short term gold may move within a range as traders watch incoming economic data and statements from the Federal Reserve. If the Federal Reserve signals future rate cuts and real yields decline gold could gain further momentum. If economic data strengthens or the dollar rises gold could pause or experience a modest pullback.
Overall the short term outlook suggests steady support for gold with the potential for further gains if market conditions shift in its favour.

XAUUSD Weekly Market Outlook 17-21 NOVDear traders,
This week in the gold market brought a blend of controlled volatility, structural clarity, and liquidity-driven movement. Below is your institutional-style recap summarizing everything that shaped XAUUSD — and the key factors to monitor moving forward.
⸻
📌 Weekly Summary
Gold spent the week rotating between a well-protected daily demand zone at $4,032–$3,952 and a strong intraday supply zone at $4,088–$4,110. Despite multiple sharp intraday moves, the broader market held its bullish structure, consolidating after October’s exceptional rally.
This tightening price action indicates accumulation and prepares the market for a significant expansion.
⸻
📈 Technical Highlights
🔹 Daily Chart (D1)
• Strong defense of the $4,032–$3,952 demand region.
• Price remained above major trend EMAs.
• Sellers continued protecting $4,088–$4,132.
• RSI neutral, showing no confirmed trend reversal.
🔹 H4 / H1
• Clean descending channel respected throughout the week.
• Multiple London sweeps below $4,022–$4,033.
• Supply at $4,078–$4,090 consistently rejected price.
• Friday’s end-of-week power move hinted at bullish intent but still lacked confirmation.
🔹 15M–5M
• Ideal conditions for scalpers: CHoCH ➝ BOS sequences repeated across sessions.
• Buy-side and sell-side liquidity taken repeatedly:
• BSL: $4,067 / $4,079
• SSL: $4,033 / $4,025
• MACD + momentum divergence signaled exhaustion before every reversal.
⸻
💧 Liquidity Overview
A liquidity-driven week with textbook sweeps around session opens.
Buy-Side Taken:
$4,067 → $4,079 → partial sweep $4,088
Sell-Side Taken:
$4,033 → $4,025 → multiple weak lows cleared
The market continues accumulating orders before the next major move.
⸻
🌍 Macro Drivers
• DXY remained neutral; no strong directional catalyst.
• Yields softened slightly, easing downward pressure on gold.
• Market anticipates next week’s FOMC minutes, which may be the spark for a breakout.
Expect continued positioning until then.
⸻
🔭 Next Week’s Outlook
Gold is winding up for a breakout. The next clean H1 move will likely set the tone for the coming weeks.
Bullish Breakout Requires:
H1 close above $4,090
🎯 Targets: $4,107 → $4,132 → $4,160
Bearish Break Requires:
Break below $4,048
🎯 Targets: $4,033 → $4,000 → $3,952
Until breakout: expect range, liquidity grabs, and fakeouts.
⸻
📣 Weekly Performance Highlights
🪙 BTC/USD WEEKEND BONUS
✅ SELL +600 PIPS
✅ BUY +1,100 PIPS
🔥 Additional +1,700 PIPS added to the weekend.
━━━━━━━━━━━━━━━
📊 WEEKLY RECAP
🏅 GOLD NET PIPS: +5,220
💰 TOTAL WEEKLY PROFIT: +5,220 PIPS
📌 49 Signals → 45 Wins | 4 SL
🎯 Win Rate: 92%
These results speak for themselves — consistency, precision, and high-probability execution week after week.

XAGUSD idea 11.11.2025I'm primarily looking at two scenarios here: a short could potentially be at sfp above high at a price of around 53.1 and a short that I would like is sfp below low at a price of around 46.7

GOLD Buying Trade idea From the Support LevelHello Traders
In This Chart GOLD HOURLY Forex Forecast By FOREX PLANET
today Gold analysis 👆
🟢This Chart includes_ (GOLD market update)
🟢What is The Next Opportunity on GOLD Market
🟢how to Enter to the Valid Entry With Assurance Profit
This CHART is For Trader's that Want to Improve Their Technical Analysis Skills and Their Trading By Understanding How To Analyze The Market Using Multiple Timeframes and Understanding The Bigger Picture on the Charts

XAUUSD sell and buy level to look forXAUUSD was in range past week create a weekly inside bar after stong rejection week before.
As price closed with potentail further range bound possibility, there are couple of levels we can look on lowertimeframe for selling and buying opportunity througouth the week.
With Fed's possible rate cut in dcemember, which is the one of the most influencial driving force for GOLD to bounce, price may eventually could take off ffrom the weekly support fueled by end of year close which all could fuel GOLD to drive up this week after past week's slowdown
Therefore level's to look at based on 15mintues timeframe
As price broken out of dynamic resistance, it is now slowly moving teards the base line.
breaking above 4076.50 is high supply zone for sellers to look at
coming below 4000.00 is an extreme liquidity zone, to look for long on a rejection above 4000.00
with strong rejection can possibly break above 4100.00

GOLD UPDATE Gold has been behaving well and it would be best to always close partial profits where necessary to help secure the profits , it has huge potential to the upside to the recent highs

XAUUSD – ACCUMULATION TRIANGLE ON D1💛 XAUUSD – ACCUMULATION TRIANGLE ON D1, AWAITING A NEW BREAKOUT THIS WEEK 🎯
🌤 Overview of the New Week
Hello everyone, Lana here 💬
Gold, after a very strong rise from the 3,500 region to above 4,400, is entering a "resting" phase on the D1 frame: the price continuously tests the upward trendline but has not yet broken it to confirm a downtrend.
The market is clearly waiting for a real breakout before forming a new medium-term wave.
Next week, we have CPI and PPI – important inflation data that could act as a catalyst to push gold out of the current accumulation zone.
💹 Technical Analysis (Daily Triangle)
On the D1 frame, when connecting the descending peaks and ascending bottoms, gold is in a narrowing triangle pattern.
The upward trendline below is still maintained, indicating that the medium-term trend has not reversed.
Below are important zones:
≈ 3,890: if the price closes below this area, it could confirm medium-term weakening.
Fibonacci & psychological resistance zone 3,800–3,900: strong support, confluence with old price structure.
POC Volume Profile around 3,650: if a deep decline scenario occurs, this will be the next price attraction zone.
Above, the old peak zone around 4,300–4,400 remains a large liquidity zone, a natural target if gold breaks the upper edge of the triangle.
In summary: the more compressed the triangle, the stronger the breakout – the direction will depend heavily on CPI/PPI data & Fed expectations.
🎯 Reference Trading Plan (Medium-Term)
💖 Scenario 1 – Maintain Uptrend (priority when the trendline is not broken)
Observe the reaction at the D1 upward trendline (area around 4,000).
If the price continuously bounces from the trendline and stays above the 3,890 area, you can:
Prioritize buying according to the trend at support retests on H4–H1.
Medium-term targets: 4,150 → 4,250 → 4,300–4,400 if the triangle breaks upwards.
💢 Scenario 2 – Triangle Breaks, Shifts to Medium-Term Decline
If D1 closes below 3,890:
Consider this a signal confirming medium-term weakening.
Prioritize selling at newly formed resistance zones.
Step-by-step targets: 3,800 → 3,700 (POC) → 3,500 (strong previous support).
In both scenarios, specific entry points should be refined on smaller frames (H4, H1) based on price action/OB/FVG.
⚠️ Note News & Risk Management
Next week's CPI & PPI could be the "final blow," pushing gold out of the triangle – volatility can be wide and fast, spreads may widen.
Last week's NFP news hardly created big waves for gold after the US government shutdown, indicating the market is holding strength waiting for more important data.
🌷 Conclusion & Interaction with LanaM2
Gold on D1 is in the final stage of the accumulation triangle – this is a time where patient observation is as important as a beautiful entry point 💛
Next week, I will continue to update daily details on smaller frames so everyone can have more specific entry points.

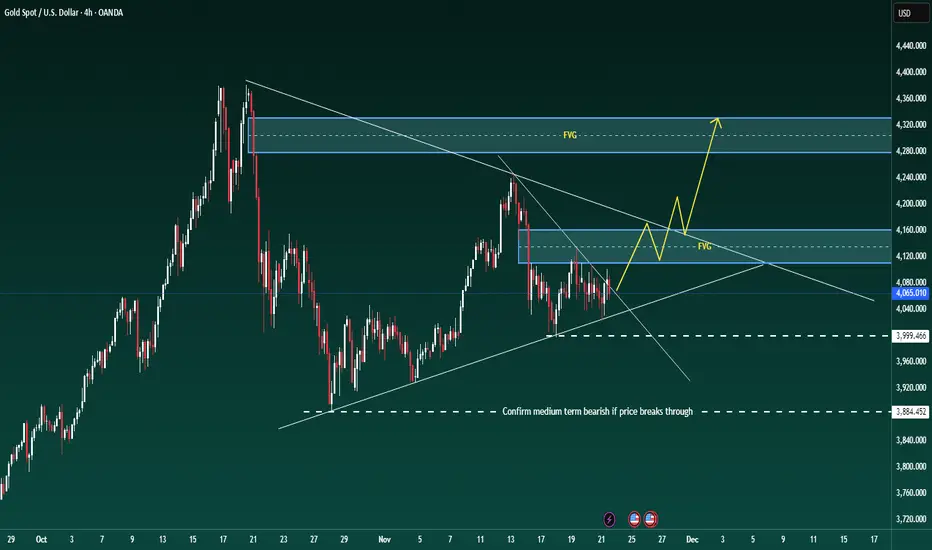
Gold is compressed; next week’s US data will pick a side.Gold is being compressed, the upcoming US data week will decide which side gets squeezed.
Good evening everyone, Brian here with a view on XAUUSD on the H2 and H4 frames for the upcoming week.
Fundamental Analysis – a "tailor-made" week for the USD
Next week is packed with US data, meaning gold will react more to numbers than narratives:
Core PPI, PPI, and Retail Sales
Initial Unemployment Claims
Prelim GDP q/q
Core PCE Price Index m/m – the Fed's preferred inflation gauge
If inflation and growth come out weak, the market will lean more towards the slow growth / easing policy narrative. This usually pressures the USD and supports gold, especially as real yields gradually decline.
Conversely, stronger-than-expected data will strengthen the USD, raise yields, and create short-term downward pressure on gold. In such a context, price and liquidity areas around news releases will be more important than usual – typically, fading emotional spikes back to structural areas is safer than chasing the initial move.
Technical Analysis – triangle, FVG, and key support areas
On the H4 frame, gold is still trading within a broad triangle structure. The previous decline has stalled, with prices continuously reacting at the upward support line and around 4,000, but there has yet to be a clear breakout from the pattern.
When zooming into H1–H2:
The price has broken a short-term downtrend line and closed strongly above – this is an early signal that selling pressure in this move is weakening.
The nearest support is around 4050–4040, deeper is the support band 4000–3998 (marked on the chart as important support). As long as it holds above 4,000, the structure remains positive.
Above, we have a very important confluence area around 4135–4160 including:
Fibo 0.382 of the most recent main decline
An old fair value gap (FVG) and resistance block
Chart note: "Gold will go strong if it passes this price range" – aligns with my view: if the price accepts above this area, the potential for a stronger upward move will open up.
Around 4100 is an area prone to a "large liquidity response" – expect strong profit-taking and position restructuring if the price returns to this area.
Currently, I see the market as accumulating above 4,000 in a corrective pattern, with a slight upward bias as long as 4,000 is maintained.
Key Price Areas
Resistance:
4100 – first liquidity area
4135–4160 – Fibo 0.382 + FVG + strong resistance
Support:
4050–4040 – nearest intraday support
4000–3998 – large frame support; if broken, it will change the picture
3940 area – stronger support if 4k is breached
Trading Scenarios for Next Week
(All are for reference only, not investment advice.)
Scenario 1 – Buy when the price adjusts above 4,000 (foundation for the next upward wave)
Idea: follow the forming upward bias as the price still respects the triangle support and the 4,000 mark.
Entry area: 4050–4040 or any clean retest of the broken downtrend line on smaller frames
Area for cautious position addition: 4025–4005 if there is a deep sweep to 4,000 with a strong rebound reaction
Stop Loss: below 3990–3988 depending on risk appetite
Targets:
First: 4100 (liquidity area)
Second: 4135–4140 (lower edge of FVG/resistance)
Extended: 4155–4160 if a strong continuation move appears
Signals to wait for: wick rejection from support, bullish engulfing candle, or clear intraday structural phase shift to a series of higher highs and lows.
Scenario 2 – Break & Retest Long above 4135–4140
If the price does not give a deep adjustment but runs straight up:
Condition: H2/H4 candle closes clearly above 4135–4140 and holds when retesting
Entry: when the price pulls back in a controlled manner to the 4135–4140 area, turning this area from resistance to support
SL: below 4120
TP: 4180 → 4200+ depending on momentum strength
This is the "gold goes strong" scenario as noted on the chart – viewing the FVG/0.382 area as a launchpad for a larger impulse wave.
Scenario 3 – Bearish scenario if 4,000 is broken
If fundamentals and cash flow turn against gold, decisively pushing the price below 4,000, the bullish view needs to be set aside.
Condition: daily candle closes clearly below 4000–3998
Plan: wait for the price to retrace up to retest 4000–4020 from below
Entry: short when rejection signals appear at that retest area
TP: 3960 → 3940, then reassess the structure
When below 4,000, the triangle will break down, and the market is likely to hunt deeper liquidity areas before potentially forming a new medium-term upward wave.
In summary: as long as 4,000 holds, I prioritize the buy scenario on adjustments, respecting the upward potential to 4135–4160 and beyond. If there is a decisive break below 4,000, the picture will reverse – then retracements up will be opportunities to look for shorts.
Trade according to what the structure shows, not what I hope for. Manage risk tightly around next week's data points and let the major price areas "do the heavy lifting."
If this perspective helps you plan better, don't forget to follow Brian for weekly gold analysis and share your scenarios in the comments to compare.
XAUUSD 4H OutlookOn the 4H chart, gold is still in a macro bullish structure after a very strong rally from the lower demand zones around 3640–3680 (old OB + POC). The recent price action is more like a sideways correction / range inside an uptrend rather than a fresh bearish trend.
Key points:
Overall bias: still bullish
As long as the main swing lows around the 4H OB at 3880–3900 hold, I treat this as a mid-trend consolidation.
Current range around a key intraday level
Price has been bouncing multiple times off the horizontal yellow line around 4030–4040 – this is our short-term pivot.
If this level keeps holding and the range highs break, I expect a move towards the 1H Order Block above at 4100–4120.
That 1H OB is the first area where we can see meaningful supply and at least a reaction.
Primary bullish scenario:
Price sweeps some liquidity around 4030–4040, maybe with a small fakeout below;
Then we see a push through the range high into the 4100–4120 1H OB;
On lower timeframes (15m/5m) if we see absorption of sellers and a bullish CHOCH/BOS, this could be the start of the next impulsive leg up, targeting previous highs and eventually the red supply zone 4240–4280.
Deeper pullback scenario:
If the 4030–4040 support breaks with a strong 4H candle and price starts to hold below it:
I’ll look for price to revisit the 4H OB demand zone at 3880–3900;
This is my main high-RR buy zone, provided we get a clear bullish shift in structure on lower timeframes;
The idea: drop into 3880–3900 → form a higher low versus previous swings → rotate back up towards 4100–4120 and then higher.
Key zones to watch:
3640–3680 – old POC + OB, major demand if we ever get a bigger flush.
3880–3900 (4H OB) – main buy zone on a deeper correction.
4030–4040 – current range support / intraday pivot.
4100–4120 (1H OB) – first upside target and likely reaction zone.
4240–4280 – higher-timeframe supply, where larger sellers may step in again.
As always, execution will be done on the lower timeframes with confirmation; the 4H chart is giving us the map, but entries come only after a clean shift in structure and proper liquidity grabs.

Gold Trade Set Up Nov 21 2025Price has changed to bullish structure in London session with a 1h BOS so i will first want to see a sweep of internal 15m SSL and/or tap into 1h FVG to then look for internal bullish engulfing candle plus CISD on the 15m-5m to target higher BSL/PDH

Breakout from a triangle pattern indicates a potential direction#XAUUSD OANDA:XAUUSD TVC:GOLD
From a trend perspective, gold is currently in a triangle consolidation range. As time goes on, the short-term resistance is also moving downwards. Therefore, gold did not provide us with a suitable opportunity to participate in trading last night. Gold is currently continuing its decline and may further test the 4025-4015 support level. If it pulls back to this level, we can consider a small long position in gold.
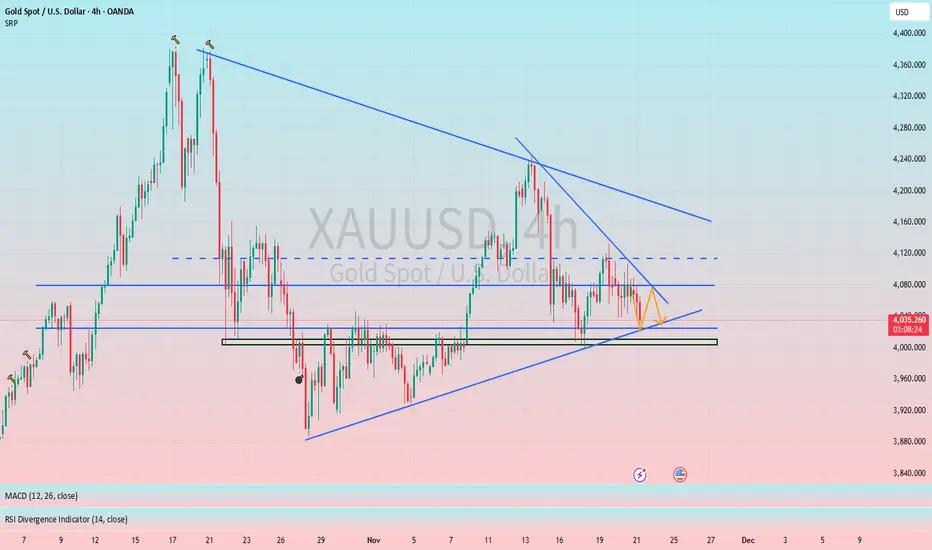
XAU/USD – Short-Term Structure & Key Reaction ZonesThis chart highlights the current short-term structure on XAU/USD. Price is holding below a recent intra-day range and showing reactions around a lower support zone. If the market pulls back into the highlighted mid-zone, it may form a corrective structure before continuing its broader downward momentum.
The upper yellow zone marks an important reaction area where price previously paused, while the lower blue zone represents the current region where price is stabilizing. The projected path illustrates a possible liquidity grab and retest phase before the market decides its next move.
This analysis focuses only on market structure, reaction zones, and potential movement behavior — not trade signals.

GOLD: Range Trading Between 4040-4125Gold is trading sideways in a narrow range today, influenced by multiple factors including Federal Reserve policy expectations and divergent capital flows. Technically, the market is at a critical juncture of bull-bear confrontation.
Despite a strong rebound last night, gold failed to test the 4,110 level, where short-term resistance remains significant. With successive lower highs in rebounds, gold shows a mild bearish bias. We recommend selling on rallies during the early session.
From the 4-hour chart perspective, gold is expected to trade range-bound during the Asian session. On the upside, focus on the short-term resistance zone of 4,110 - 4,125. A decisive break above this range will open up further upside momentum toward 4,150 - 4,180. On the downside, the short-term support lies at 4,040 - 4,050. Holding above this level will prevent a deeper short-term correction, while a break below could trigger a further decline to the key support of 4,000.
Technically, the bias remains tilted toward consolidation and pullback. We will patiently wait for opportunities to enter positions at key levels.
Sell 4110 - 4120
SL 4125
TP 4080 - 4070 - 4060
Buy 4050 - 4060
SL 4040
TP 4090 - 4100 - 4110
