Gold (XAU/USD) Price Outlook – Trade Setup📊 Technical Structure
OANDA:XAUUSD Gold has rallied sharply in the previous session and is now consolidating near the $4,323–$4,330 resistance zone. This area has repeatedly acted as a key reversal zone, and price action shows clear signs of hesitation as bullish momentum slows.
On the 30-minute chart, while the broader short-term structure remains constructive, upside follow-through is weakening near resistance. If price fails to achieve a clean breakout and hold above $4,333, a technical pullback toward the lower demand area becomes increasingly likely. Initial downside focus is on the $4,299–$4,292 support zone, where buyers previously stepped in.
🎯 Trade Setup (Short-Term Pullback)
Entry Zone: 4,323 – 4,330
Stop Loss: 4,334
Target 1: 4,299
Target 2: 4,292
Risk-to-Reward: Approx. 1 : 2.85
As long as price fails to close above 4,334 on a 30-minute basis, the short-term corrective bias remains valid.
🌐 Macro Background
Recent US labour data shows job growth remains positive but unemployment has risen to 4.6%, signalling a cooling labour market. This has reinforced expectations for further Fed rate cuts, weighing on the US Dollar and providing medium-term support for gold.
However, in the near term, Fed officials remain divided on the pace of easing in 2026, and markets are awaiting clarity from upcoming US CPI and PCE inflation data. Ahead of these key releases, gold is more likely to digest recent gains through consolidation or a technical retracement rather than extend aggressively higher.
In short: medium-term fundamentals remain supportive, but short-term price action favours a corrective pullback.
🔑 Key Technical Levels
Resistance Zone: 4,322 – 4,330
Support Zone: 4,299 – 4,292
Bearish Invalidation: 30-minute close above 4,334
📌 Trade Summary
Gold has climbed to seven-week highs on easing expectations but is now struggling to break decisively above the $4,322 resistance zone. Unless a clear breakout occurs, price action favours a short-term pullback toward $4,299 and $4,292. A sustained break above resistance would invalidate the bearish correction view and signal renewed upside momentum.
⚠️ Disclaimer
This analysis is for reference only and does not constitute trading advice. Trading involves significant risk, and proper risk management is essential.
Xauusdupdates

Gold price movements following the NF report on December 17th.1️⃣ Trend Structure & Trendline
🔹 Main Trend
The market is currently in a medium-term uptrend:
Higher Lows are being formed
Highs are approaching or exceeding previous highs (potential Higher High)
The ascending trendline (below) is still intact → acting as the backbone of the current trend
👉 Only a decisive break below this rising trendline would invalidate the medium-term uptrend.
🔹 Short-term Descending Trendline (Upper)
The descending trendline above is pressuring price in the short term
It acts as a dynamic resistance, where selling pressure appears on rallies
Price is currently compressing between the descending trendline (above) and support (below) → a consolidation phase before a strong move
📌 A clear breakout above the descending trendline = confirmation of trend continuation to the upside.
2️⃣ Key Resistance
🔴 Major Resistance Zone: 4,380
This zone represents:
A previous high
A clear supply zone
If price breaks into this area:
Strong profit-taking and volatility are likely
Confirmation is required (strong close, good volume) for continuation
👉 A sustainable bullish move is only confirmed when price breaks and holds above 4,379.
3️⃣ Key Support
🟢 Near-term Support: 4,277
This zone includes:
Confluence with moving averages
A price level with multiple reactions
Role: Healthy pullback support
👉 Holding above this level keeps the short-term uptrend intact.
🟢 Deeper Support: 4,258
A structural support level
If price breaks below 4,277:
A retest of 4,258 is highly likely
This is a trend-decision zone
📌 A breakdown below 4,258 significantly increases the probability of price returning to the major ascending trendline below.
4️⃣ Trading Plan
🟢 BUY GOLD: 4258 – 4256
Stop Loss: 4246
Take Profit: 100 – 300 – 500 pips
🔴 SELL GOLD: 4379 – 4381
Stop Loss: 4391
Take Profit: 100 – 300 – 500 pips

Gold Analysis
Gold is in bullish channel and close to resistance area.
Daily candles closes are good although they have shadow from top but weekly candle is gonna close with a good body.
Check for confirmation in 15 min timeframe to join buyers.
Stay tuned for our next updates.

1216 XAUUSD 4-Hour Trading PlanHello traders,
I. Current Technical Context
- Instrument: Gold Spot vs. U.S. Dollar (XAUUSD), 4-hour chart
- Pattern: Harmonic pullback pattern (Zone C ~4382 as rejection zone; current price ~4287 in retracement phase)
- Key Levels:
- Rebound resistance: 4300-4310
- Support levels: 0.382 Fib (~4218), 0.5 Fib (~4176)
- Current RSI: 52 (neutral range)
II. Trading Strategies (with Risk-Reward Ratio)
1. Short Strategy (Enter on Rebound)
- Entry Condition: Price rebounds to 4300-4310 with bearish candlestick signals (e.g., bearish engulfing)
- Entry Level: 4300-4310
- Stop-Loss: 4330 (stop size: 20-30 pips)
- Take-Profit:
- TP1: 4218 (Risk-Reward Ratio ≈ 2.7:1)
- TP2: 4176 (Risk-Reward Ratio ≈ 4.1:1)
2. Long Strategy (Enter After Pullback)
- Entry Condition: Price drops to ~4218 with bullish candlestick signals (e.g., hammer)
- Entry Level: 4218
- Stop-Loss: 4200 (stop size: 18 pips)
- Take-Profit: 4280 (Risk-Reward Ratio ≈ 3.4:1)
III. Risk Management
- Max position size per trade: ≤2% of total capital
- Abandon short strategy if price breaks above Zone C high (4382); monitor trend continuation
GOOD LUCK!
LESS IS MORE!

12.17 Post- NFP, Gold Trading Analysis & Plan ON WedHello traders,
I. Nonfarm Payroll (NFP) Recap (Last Night)
The delayed combined US NFP data for October-November released last night showed a mixed picture. November added 64,000 jobs, beating the 50,000 forecast, but October’s figure was sharply revised downward to a **105,000 job loss**, signaling fading hiring momentum in the labor market.
The unemployment rate rose to 4.6% (a 3-year high), while average hourly earnings climbed just 0.1% month-over-month—the weakest gain since March 2024. These soft metrics eased inflation concerns and reinforced market expectations of Fed rate cuts in 2026. Gold initially spiked to 4334 on the news but pulled back amid profit-taking, yet it held firmly above 4300 and did not test the **1st support zone (4176-4218)**.
II. Market Recap & Current Status
- Trend Outlook: The daily chart remains in a bullish primary trend, with price consistently trading above EMA5/13.
- Short-Term Performance: Post-NFP pullback momentum was weak; the 4300 level held steady, and the key 1st support zone of 4176-4218 remained untouched, confirming intact bullish bias.
III. Core Trading Logic
1. Main Strategy: Follow the bullish trend and prioritize long opportunities (original short plan is canceled).
2. Key Catalyst: The US November CPI data (market expects 2.8% YoY) to be released in Thursday’s U.S. session will be the major driver for short-term gold volatility.
IV. Specific Trading Plan
Intraday Entry Opportunities
- Buy-the-Dip Level: Enter light long positions around 4300-4305, leaning on EMA5 support.
- Breakout Follow-Up: If gold breaks above the 4334 resistance zone, enter longs on a pullback to 4325-4330.
CPI Data Response Strategy will come tomorrow.
V. Risk Notes
- Avoid chasing moves during the CPI release to steer clear of post-announcement volatility.
- Use EMA5 as the defensive threshold for trend-following longs; exit temporarily if this level is broken.
GOOD LUCK!
LESS IS MORE!

Gold - The -50% correction is starting!🎯Gold ( OANDA:XAUUSD ) is starting a -50% correction:
🔎Analysis summary:
For the past 10 years, we have been witnessing an underlying bullrun on Gold. Just like we saw back in 2011, the 10 year bullrun was followed by a correction of -50%. Together with the retest of the ultimate resistance trendline, Gold is now clearly shifting bearish.
📝Levels to watch:
$4,500
SwingTraderPhil
SwingTrading.Simplified. | Investing.Simplified. | #LONGTERMVISION

XAUUSD | 1H | Market Structure UpdateGold remains in a high-timeframe bullish structure, but price is currently pausing within a key consolidation range after the impulsive move higher. This consolidation is forming just below the all-time high (ATH), suggesting the market is building orders rather than reversing.
Price has already swept prior sell-side liquidity, and the current range appears to be a re-accumulation phase. As long as price holds above the previous breakout base, bullish continuation remains the higher-probability scenario.
A clean breakout and close above the consolidation high is required to confirm strength and open the path toward a ATH expansion. Without that confirmation, price may continue ranging or perform a deeper retracement into demand before the next leg higher.
Bias: Bullish continuation
Confirmation: Strong close above consolidation resistance
Target: All-Time High and potential price discovery
Invalidation: Sustained acceptance below the consolidation support
Patience is key here — let the market show its hand before committing.

XAUUSD GOING TO TEST NEW HIGH?EXPLAINED EVERY THING IN VIDEO TRADE ACCORDINGLY.
XAUUSD is trading near 4306 so wait for small retracement to 4304-4300 look for buy stop below 4288 and target is 4330 and 4350

Gold Intraday SignalsGold maintained a high-range consolidation pattern today, with intense rivalry between bulls and bears. While the broader uptrend from previous sessions remains intact, the price has undergone a phased pullback under the impact of bearish factors, and short-term upward momentum has weakened.
On the resistance front, the key short-term resistance zone lies between $4,335 and $4,345, a level that has repelled multiple upward attempts. A decisive breakout above this zone would expose gold to the major resistance range of $4,350–$4,385, where $4,350 is a recent high-point pressure level, and the $4,380–$4,385 interval encompasses the historical peak.
For support levels, the immediate focus is on the $4,265–$4,270 support zone, a critical support line from the prior uptrend. A breakdown below this level could trigger a further decline toward the $4,245–$4,255 range, and a decisive breach of that floor may spark a new round of profit-taking.
In addition, the combined release of the U.S. October and November Nonfarm Payrolls report today is highly likely to influence Federal Reserve policy expectations, thereby dictating gold’s near-term trajectory. Close attention should be paid to the data outcome.
Trading Strategy:
Buy 4280 - 4285
SL 4270
TP 4310 - 4320 - 4330
Sell 4335 - 4345
SL 4350
TP 4320 - 4310 - 4300

Gold Trade Set Up Dec 16 2025Overall gold is still in a daily uptrend, has come down to test demand, bounce off it strongly and is now inverting a 1h FVG. So i will want to see some kind of pull back on the the 15m followed by internal 5m bullish engulfing to continue higher to PDH

XAUUSD 1H-Trading StrategiesGold on the 1H chart is holding a bullish structure after a clean breakout from the prior consolidation range.
Price is now attempting to stabilize above the breakout area and rebuild momentum after a sharp pullback wick, which often signals a liquidity sweep before continuation.
The next direction will be decided by how price reacts around the current reclaim zone and the prior swing high.

XAUUSD CHART H1 TARGET POINT 4320 BUYING CONTINUE42801. Price Action: The candlestick chart shows a price movement that has broken out of a previous range, indicating a potential shift in momentum. A red moving average line smooths the price trend.
2. Sell & Buy Levels:
- A Sell signal is marked at 4,197.835, suggesting a prior bearish trigger.
- A Buy signal appears at 4,198.425, indicating a reversal or entry point for a long position.
3. Target Point: The green box highlights an upside target at 4,221.876, representing the expected profit zone if the bullish move continues.
4. Support Zone: A red shaded area shows a demand/support range between 4,182.214 and 4,174.145. This zone acts as a safety level where buyers might step in if the price drops.
5. Trading Strategy Implication: The setup suggests entering a long position once the price confirms above the buy level (~4,198.425), aiming for the target at 4,221.876. The stop‑loss could be placed below the support zone (near 4,174.145) to manage risk.
6. Additional Note: The “1?” marker likely indicates a potential reversal or breakout point that traders should watch for confirmation before acting.
In short, the chart guides a bullish trade with a defined entry (4,198.425), target (4,221.876), and support‑risk zone (4,174–4,182).

XAUUSD is on SwingI'm waiting for these 2 levels to buying again
1st 4245-4240
2nd 4220-4230 area.
When this will come true?
We need any candle closing below 4275-4270 then market will respect the 4245 structural support area and
My eyes will see NEW ATH

XAU/USD 16 December 2025 Intraday AnalysisH4 Analysis:
-> Swing: Bullish.
-> Internal: Bullish.
Analysis and bias remains the same as analysis dated 20 October 2025.
Price has printed as per previous intraday expectation by printing a bearish CHoCH which indicates, but not confirms, bullish pullback phase initiation.
Price is currently trading within an established internal range, however, I will continue to monitor price with regards to depth of pullback.
Intraday expectation:
Price to continue bearish, react at either discount of 50% internal EQ, or H4 supply zone before targeting weak internal high priced at 4,380.990.
Note:
The Federal Reserve’s sustained dovish stance, coupled with ongoing geopolitical uncertainties, is likely to prolong heightened volatility in the gold market. Given this elevated risk environment, traders should exercise caution and recalibrate risk management strategies to navigate potential price fluctuations effectively.
Additionally, gold pricing remains sensitive to broader macroeconomic developments, including policy decisions under President Trump. Shifts in geopolitical strategy and economic directives could further amplify uncertainty, contributing to market repricing dynamics.
H4 Chart:
M15 Analysis:
-> Swing: Bullish.
-> Internal: Bullish.
Analysis and bias remains the same as yesterday's analysis dated 15 December 2025.
As mentioned in my analysis and intraday expectation dated 11 December that I will allow price to print pause and to confirm an internal high.
Price has printed a bearish CHoCH and reacted at almost precisely 50% internal EQ.
Intraday expectation:
Price to target weak internal high priced at 4,353.555.
Note:
Gold continues to exhibit elevated volatility as markets digest the Federal Reserve’s ongoing dovish tilt and persistent global geopolitical tensions.
With uncertainty remaining a dominant theme across global risk assets, traders should prioritise disciplined risk management, as abrupt price swings and liquidity pockets may become increasingly common.
Furthermore, recent tariff announcements from President Trump, particularly those directed at China, have added another layer of instability to the macro landscape. These policy developments have the potential to intensify market turbulence, heighten risk‑off flows, and trigger sharp intraday reversals or whipsaw‑like behaviour in gold.
M15 Chart:

Elite | XAUUSD | 4H – Weekly Market Structure Outlook New ATH |OANDA:XAUUSD
After rejecting from the ATH double-top region, price corrected deeply into higher-timeframe demand, where buyers regained control. The market respected trend support and printed a clean structural continuation, followed by consolidation and breakout. Current price is approaching a critical resistance band where reaction is expected before the next directional expansion.
Key Scenarios
✅ Bullish Case 🚀
If price holds above the recent breakout zone and shows acceptance:
🎯 Target 1: Previous ATH zone
🎯 Target 2: ATH extension
🎯 Target 3: New price discovery highs
❌ Bearish Case 📉
If price rejects strongly from resistance and breaks below the bullish structure:
🎯 Downside Target 1: Broken structure retest zone
🎯 Downside Target 2: Trend support / demand area
Current Levels to Watch
Resistance 🔴: ATH / Weekly supply zone
Support 🟢: Breakout base & ascending trend support
⚠️ Disclaimer: This analysis is for educational purposes only. It is not financial advice. Please conduct your own research before trading.

XAUUSD Structure Holding After Weekly 50% ReactionGold is currently consolidating after a strong bullish reaction from the weekly 50% retracement near 4262. This level acted as a clear support zone, where sell-side pressure was absorbed and price responded with decisive upside momentum. The move signaled a shift from consolidation into expansion, reinforcing 4262 as a key higher-timeframe value area.
On the daily and 4H timeframes, the broader structure remains bullish. The pullback into last week did not break higher-timeframe structure. Instead, it served as a reset before price resumed higher, a common characteristic of strong trending markets. The impulsive candles following the reaction suggest active buying rather than a temporary short-covering move.
Key Technical Levels
• 4262: Weekly 50% retracement and major structural support
• 4300–4320: Current consolidation and short-term balance zone
• 4353: December high and main upside liquidity target
• 4370–4380: Potential extension zone if December highs are cleared
After breaking out of an ascending channel on the 4H, price is now holding above previous resistance, which is a constructive sign. Consolidation at these levels typically indicates absorption of supply before the next directional move.
🔹 Plan A – Bullish Continuation (Primary Scenario)
As long as price remains supported above the 4,300–4,265 zone, the bullish framework remains intact.
• Sustained acceptance above 4,320 increases the probability of a move toward 4,353
• A decisive break above December highs may open extension toward 4,370–4,380, where higher-timeframe supply is expected
This scenario assumes the current consolidation is a continuation structure following the impulsive breakout.
🔹 Plan B – Deeper Corrective Rotation
If price fails to hold above 4,300 and shows acceptance below this level, a deeper retracement could develop.
• First downside reaction zone: 4,265
• Extended corrective target: 4262 (weekly 50%)
This scenario remains corrective in nature unless price loses 4262 decisively, which would signal a shift in higher-timeframe structure.

Gold XAUUSD Analysis Dec 16, 2025 | Fed Policy, Dollar WeaknessOANDA:XAUUSD GOLD ANALYSIS Gold Strength Persists as Policy Uncertainty and Global Tensions Rise (Dec 16, 2025)
Welcome back to Trade with DECRYPTERS 🔍📈
📊 Market Overview
Gold traded firmly bullish on December 16, 2025, holding within the $4,300–$4,350 zone and briefly testing levels near October’s record highs. Both spot and futures prices posted modest intraday gains while hovering near multi-month peaks.
The rally was supported by expectations of further Fed rate cuts in 2026, a cooling US labor market, and a weaker US dollar alongside softer Treasury yields. Persistent geopolitical tensions and steady central-bank buying added strong safe-haven demand. Overall, gold remains structurally bullish, extending its exceptional 2025 performance.
🔑 Key Fundamentals
🟨 Gold is consolidating around $4,300–$4,330, holding near multi-year highs after a 50–60% YTD rally.
🏦 The Federal Reserve cut rates again to 3.5–3.75%. Despite a relatively hawkish dot plot, markets continue to price further easing in 2026, supporting gold through lower real yields.
💵 The US Dollar Index remains weak at 98–99, boosting global gold demand and improving affordability for non-USD buyers.
📉 Treasury yields near 4.2% add mild pressure, but expectations of gradual Fed easing limit upside risks to yields.
🌍 Central-bank buying remains exceptionally strong at 634–750 tonnes YTD, led by Poland, China, Turkey, and others, driven by de-dollarization and geopolitical hedging.
🔥 Inflation is cooling but remains above target, allowing gold to benefit from real-yield compression and elevated risk aversion.
🌍 Geopolitics Impacting Gold
🌐 Middle East Tensions
Ongoing Iran–Israel and broader regional conflicts continue to push gold higher through fear-driven flows. Headlines regularly trigger 1–3% intraday surges, making geopolitics a key driver behind October’s record highs near $4,381.
⚔️ Russia–Ukraine War
Continued escalations and stalled negotiations keep risk premiums elevated. Energy volatility and sanctions reinforce gold’s role as a non-fiat hedge, with no clear resolution maintaining long-term support.
🇺🇸🇨🇳 US–China Trade Tensions
Tariff threats, technology export controls, and retaliatory measures increase uncertainty. Trump era restrictions played a major role in pushing gold above $4,300, and markets continue to price higher geopolitical volatility into gold.
🌎 Other Emerging Risks
Instability in regions such as South Korea and Syria, alongside renewed concerns over European debt, further strengthen safe-haven demand. Ongoing de-dollarization efforts encourage central banks to continue adding gold reserves.
⚖️ Risk-On Risk-Off Analysis
📉 Yields Overview
Gold trades around $4,280–$4,315, holding elevated levels despite consolidation.
The US 10-year yield sits near 4.16–4.20%, rising slightly after hawkish Fed remarks.
Real yields remain subdued due to cooling inflation, which continues to support gold. While higher yields create short-term headwinds, structural 2025 drivers have overridden traditional yield-gold correlations.
🔄 Key Relationships
📊 The US Dollar Index at 98.2–99.0 remains weak, strongly supporting gold’s year-to-date momentum.
📈 The S&P 500 near 6,800 reflects mild risk-on sentiment, yet gold continues to rise alongside equities due to defensive hedging demand.
📉 The VIX around 15–16 signals calm markets. Low volatility caps extreme safe-haven premiums but does not prevent gold from holding elevated levels.
🧠 Overall Sentiment
Markets remain mildly risk on with strong defensive undertones driven by geopolitics and central-bank accumulation. Gold is likely to hold elevated levels, with potential pullbacks toward $4,200 support if yields rise or the dollar firms. Structural tailwinds continue to favor upside toward $4,350–$4,400.
📰 Key Insights From Credible Sources
Market commentary increasingly links Trump’s tariffs, fiscal pressures, and policy uncertainty to a strongly bullish gold outlook. Analysts highlight how trade conflicts, de-dollarization, and rising deficits continue to support higher prices.
Eastern central banks are rapidly accumulating gold, reinforcing its role as neutral money amid global monetary shifts and geopolitical fragmentation.
Several reports speculate on potential gold revaluation under a future Trump administration in 2026, citing rising debt levels and structural weaknesses in the fiat system.
Gold has repeatedly surged following tariff announcements and trade-war escalations, while BRICS-related gold buying continues to boost long-term demand.
🏁 Conclusion
Gold remains firmly supported by a powerful mix of weak real yields, a soft dollar, and persistent geopolitical tensions, keeping prices elevated near multi-year highs. Central-bank accumulation and hedging demand reinforce structural bullish momentum despite occasional yield-driven pullbacks.
With expectations of further Fed easing in 2026 and unresolved global conflicts, upside risks outweigh downside corrections. Overall, gold’s outlook remains strongly bullish, with momentum targeting $4,350–$4,400, and potential extensions if volatility accelerates.
🙌 Support the Analysis
If this breakdown added value to your trading
👍 Drop a like
💬 Comment your key levels
📈 Share your charts with the community
Let’s grow together 🚀
Best Regards,
M. Moiz Khattak
Founder
TRADE WITH DECRYPTERS 🟡📊

4H ascending triangle pattern, be cautious when shorting.#XAUUSD OANDA:XAUUSD TVC:GOLD
The medium- to long-term bullish outlook remains unchanged, influenced by the continuous increase in gold holdings by central banks around the world. Gold prices are currently testing the short-term resistance level of 4345 again, and many people may short gold at this level once more. However, from a longer time frame perspective, the trend may have formed an ascending triangle structure. Once it breaks through 4345, the gold price may further test the previous high of 4370-4380, or even reach a new high. Therefore, avoid blind trading in the short term. A prudent trading strategy would still be to consider going long on gold after it retraces to the short-term support level of 4330-4320. Of course, if the price of gold rises sharply to near the previous high, you can also try shorting with a small position.
In summary, the current market requires a flexible approach, with buying on dips being the primary strategy and selling on rallies only as a secondary measure. The focus this week is tomorrow's NFP data.

XAU/USD: Sell on Bearish OB, Buy Deep at Bullish OB1. Context & Price Structure (M30)
• The price is in a downward correction after a strong previous increase.
• On the retracement zone, EQH + ChoCH decrease appears → signal of weakening buying flow, prioritize "retracement to sell" in the short term.
• The price is still pressed under the descending trendline, so the short-term bias remains downward until a clear break occurs.
• Support Zone 4,275 is the decisive point: if held, it will rebound technically, if broken, it opens the path to the lower demand zone.
2. Key Levels (according to the chart drawn)
• OB Bearish (Sell Zone): 4,308 – 4,312 (≈ 4,311.888) → supply zone + trendline confluence, prioritize watching for SELL when retracing.
• Support Zone: 4,272 – 4,276 (≈ 4,275.451) → central support zone, can create a rebound/retracement.
• Mid Support / Target: 4,247.624 → next target if 4,275 is broken.
• OB Bullish (Buy Zone): 4,223.400 – 4,205.983 → strong demand zone, expected to sweep and reverse.
3. Trading Plan (with clear conditions)
Scenario 1 – SELL on retracement at Bearish OB (main scenario)
• If the price retraces to 4,308 – 4,312 and a rejection reaction appears:
strong pin bar
downward engulfing
or ChoCH decreases again on M15/M30
• Then prioritize SELL according to the correction trend.
• TP1: 4,275
• TP2: 4,247
• TP3: 4,223 (approaching OB Bullish)
• Invalidation: M30 closes above 4,318 and holds above → stop SELL idea.
Scenario 2 – BUY deep at Bullish OB (important scenario to catch a large retracement)
• If the price breaks 4,275 with a clear M30 candle and slides down to 4,223 – 4,206.
• Wait for Liquidity Sweep + reversal signal:
pin bar at OB
upward engulfing
or ChoCH increases (M15/M30)
• When confirmed, prioritize BUY.
• TP1: 4,247
• TP2: 4,275
• TP3: 4,308
• Invalidation: M30 closes below 4,198 → stay out and observe.
4. Risk Management Notes
• Do not chase SELL when the price is close to 4,275 (support zone).
• Do not BUY early before the price hits Bullish OB and confirmation is received.
• If the price reclaims strongly above the trendline + 4,312, the bias will shift to "BUY pullback" instead of "Sell retracement."

Selena | XAUUSD 4H - Bullish Continuation Structure ATH SOONFOREXCOM:XAUUSD
The market absorbed prior selling pressure and transitioned into sustained higher highs and higher lows. Current price is trading above the previous consolidation range, suggesting continuation toward higher liquidity zones, while pullbacks remain corrective within trend.
Key Scenarios
✅ Bullish Case 🚀 →
🎯 4350 → 🎯 4420 → 🎯 4500
❌ Bearish Case 📉 → Breakdown below 4050
Current Levels to Watch
Resistance 🔴: 4350 – 4450
Support 🟢: 4180 / 4050
⚠️ Disclaimer: This analysis is for educational purposes only. Not financial advice.

XAUUSD (30-minute) – Technical OverviewThe chart shows price reacting to a strong resistance zone near the recent highs, where a clear double top has formed. This structure suggests weakening bullish momentum after repeated rejection from the same area.
Following the rejection, price moved lower and is now trading below the resistance zone and near a key horizontal level around 4283–4275. The ascending trendline that previously supported price is being tested, indicating a critical area for short-term structure.
If price sustains below the trendline, attention shifts toward the next lower support zone near 4232, marked by prior consolidation. Overall, the market is transitioning from an impulsive move to a corrective or consolidative phase, with structure clarity depending on how price behaves around the trendline and nearby support levels.

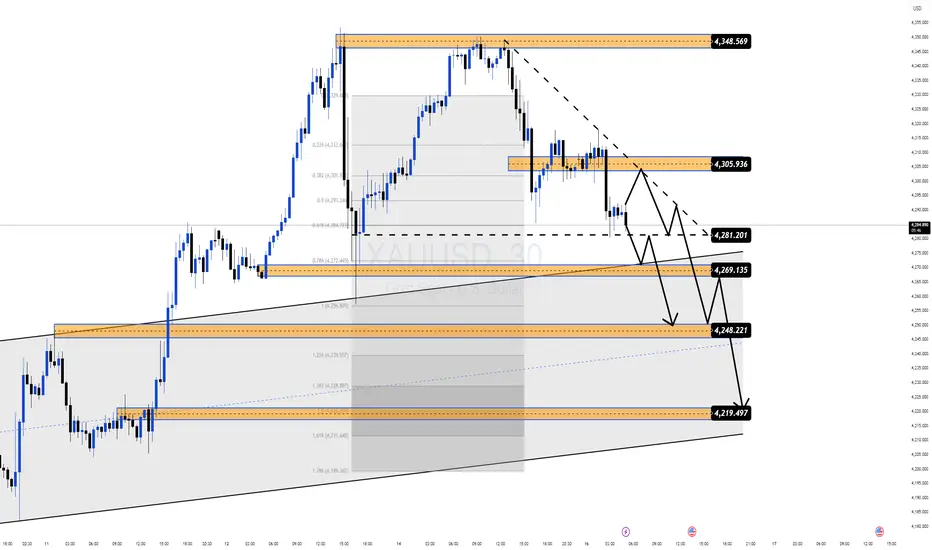
XAU/USD – Distribution at the Top, Sell on Rallies Market ContexAfter a strong bullish impulse, Gold is now showing clear signs of exhaustion near the upper liquidity zone. Price failed to sustain above the recent high and has started to rotate lower, suggesting a distribution phase rather than continuation.
From a macro perspective, although expectations around Fed policy remain mixed, short-term positioning looks crowded on the buy side, increasing the probability of a corrective move to rebalance liquidity.
Technical Structure (M30–H1)
Price rejected sharply from the 4,348 supply / liquidity zone
A lower high has formed under descending trendline resistance
Market is trading below key intraday structure, signaling bearish pressure
Current price action favors a sell-the-rally approach
Trading Plan – MMF Style
Primary Scenario – SELL Continuation
Preferred SELL zone: 4,300 – 4,306
Confirmation: bearish rejection / weak bullish momentum
Targets:
TP1: 4,281
TP2: 4,269
TP3: 4,248
Extended target: 4,219 (major demand + channel support)
Invalidation
A clean break and hold above 4,348 would invalidate the short-term bearish bias.
In that case, stand aside and wait for new structure confirmation.
MMF Perspective
At premium levels, risk favors patience over chasing buys.
The focus now is on capital protection and selling rallies, waiting for price to reach deeper demand zones before considering any new bullish setups.
Bias today: Bearish below 4,348 – Sell rallies, manage risk strictly.
XAUUSD M15 Outlook : Bullish SetupGreetings 👋
Gold Bullish Setup
There is a Bullish Engulfing Setup And Demand Zone To Buy Gold And Have A Order Block Bullish To Buy With Confidence
Target Will Be Buy Side Liquidity
