XAUUSD approaching buy zone!GOLD open with a gap, as past week it has broken out of the intial structure, with new market open has sown significant bullish price action. From daily price action, it is in long term uptrend. Current 15minute price is about to cross the daily support and 4h support which in turn could lead the price to bouce off and a good area for potential buy entry, however, would like to see the support been tested with longer ATR candle.
My SL in this entry would be 1.5ATR which is 91 pip in 15min which is well below the intraday support level.
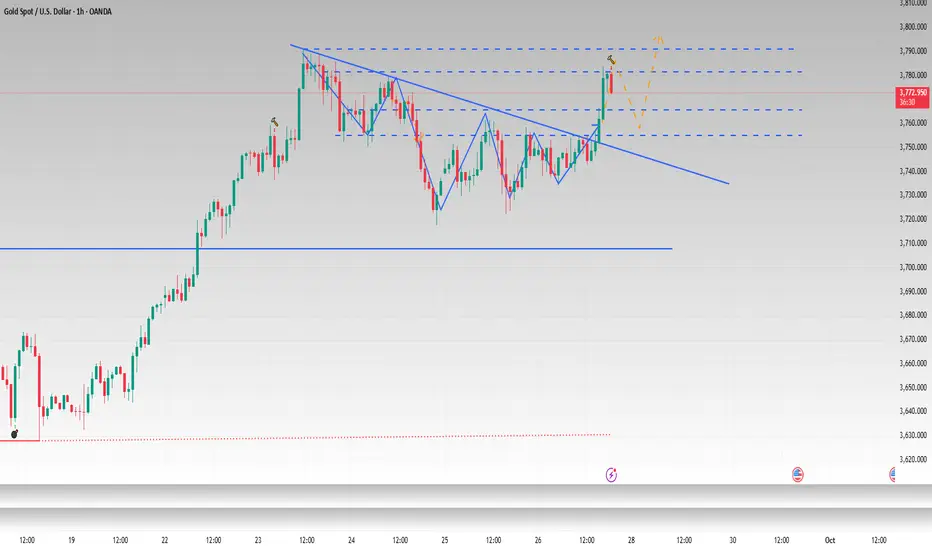
Xauusdupdates

Gold Trade Set Up Sep 28 2025Price broke structure to the downside on the 15m on friday so i will want to see a pullback into supply before a continuation down towards PDL/SSL
www.tradingview.com

Plan 28-sep-2025Related Information:!!!
Federal Reserve Governor Stephen Miran told Fox Business on Thursday that there is no clear evidence of tariff-driven inflation, but it appears to be holding back policymakers. The economy is more vulnerable to downside shocks because Fed policy is too tight, and that policy is restraining by 200 basis points, Miran added.
Separately, Chicago Fed Governor Austan Goolsbee noted that the labor market seems to be cooling, but inflation is rising, and relying on inflation being temporary makes him uneasy. Goolsbee said interest rates could come down a bit further if inflation moves toward 2%, but he is also cautious about cutting rates too soon, stressing that inflation must be brought back to the 2% target.
personal opinion:!!!
XAUUSD sideway 3750-3780, breakeven 3780 then 3800(ATH)

XAUUSD Analysis todayHello traders, this is a complete multiple timeframe analysis of this pair. We see could find significant trading opportunities as per analysis upon price action confirmation we may take this trade. Smash the like button if you find value in this analysis and drop a comment if you have any questions or let me know which pair to cover in my next analysis.

XAUUSD Weekly Scenarios⚙ Weekly Scenarios
Bullish Scenario:
The price holds above support at ~$3,660 and breaks resistance at ~$3,760–3,800.
Then, a rally to $3,900 and beyond is possible, especially with support from rate and geopolitical news.
Consolidation:
The price may move sideways between $3,660 and $3,760 until a strong signal (from news or volume) breaks the range.
Bearish Scenario:
A break below $3,660 with volume confirmation could lead to a correction to $3,600 or even lower.
In this case, it's important to watch whether lower support levels hold, otherwise a deeper pullback is possible.
🔎 Conclusion
The overall picture for the week is bullish, but with the risk of a pullback or consolidation due to overbought conditions and resistance.
Key: Watch for a reaction in the resistance zones of ~$3,760–3,800 and for support to hold at ~$3,660.
For traders: consider buying on dips near support zones and shorting (or taking profits) as the price approaches strong resistance if it fails to break through.

XAUUSD H1 OUTLOOK FOR NEXT WEEKI’ve Setup My Sniper Shot For A Sell From The Premium IFVG
Who’s With Me ?
Selling on IFVG And FVG Zones
Target Is Sell Side Liquidity
Good Luck Guys

XAUUSD H1 OUTLOOK I’ve Setup My Sniper Shot For A Sell From The Premium IFVG
Who’s With Me ?
Selling on IFVG And FVG Zones
Target Is Sell Side Liquidity
Good Luck Guys

XAUUSD | First Line of DefenseXAUUSD | Watching the First Support
On XAUUSD, I see the first major support around the blue box. That’s where I’ll be paying attention as price drifts lower.
When we get there, I’ll be watching the 1-hour CDV closely. A positive divergence would suggest buyers are absorbing and could set up a tactical bounce.
My track record speaks for itself: the win rate of my trades is listed below. Trading with me costs nothing. You can check my profile.
I keep my charts clean and simple because I believe clarity leads to better decisions.
My approach is built on years of experience and a solid track record. I don’t claim to know it all, but I’m confident in my ability to spot high-probability setups.
If you would like to learn how to use the heatmap, cumulative volume delta and volume footprint techniques that I use below to determine very accurate demand regions, you can send me a private message. I help anyone who wants it completely free of charge.
I have a long list of my proven technique below:
🎯 ZENUSDT.P: Patience & Profitability | %230 Reaction from the Sniper Entry
🐶 DOGEUSDT.P: Next Move
🎨 RENDERUSDT.P: Opportunity of the Month
💎 ETHUSDT.P: Where to Retrace
🟢 BNBUSDT.P: Potential Surge
📊 BTC Dominance: Reaction Zone
🌊 WAVESUSDT.P: Demand Zone Potential
🟣 UNIUSDT.P: Long-Term Trade
🔵 XRPUSDT.P: Entry Zones
🔗 LINKUSDT.P: Follow The River
📈 BTCUSDT.P: Two Key Demand Zones
🟩 POLUSDT: Bullish Momentum
🌟 PENDLEUSDT.P: Where Opportunity Meets Precision
🔥 BTCUSDT.P: Liquidation of Highly Leveraged Longs
🌊 SOLUSDT.P: SOL's Dip - Your Opportunity
🐸 1000PEPEUSDT.P: Prime Bounce Zone Unlocked
🚀 ETHUSDT.P: Set to Explode - Don't Miss This Game Changer
🤖 IQUSDT: Smart Plan
⚡️ PONDUSDT: A Trade Not Taken Is Better Than a Losing One
💼 STMXUSDT: 2 Buying Areas
🐢 TURBOUSDT: Buy Zones and Buyer Presence
🌍 ICPUSDT.P: Massive Upside Potential | Check the Trade Update For Seeing Results
🟠 IDEXUSDT: Spot Buy Area | %26 Profit if You Trade with MSB
📌 USUALUSDT: Buyers Are Active + %70 Profit in Total
🌟 FORTHUSDT: Sniper Entry +%26 Reaction
🐳 QKCUSDT: Sniper Entry +%57 Reaction
📊 BTC.D: Retest of Key Area Highly Likely

gold level 3440 tgt 3624 wait for buyingXauusd buy near 3440 , cmp 3530, new fresh entry near 3440 and tgt 3624

XAUUSD Delivered Excellent profits Thanks to those who followed, trusted me, and made profits 210 pips delivered
As I mentioned in today’s commentary session:
• I took buy trades if H4 candle closes above 3760., and I’m expecting the market to test the 3785 benchmark with an extension towards 3830.
My strategy was to buy the dips, and I’m very happy with the profits so far – .
My first target (3782) is achieved, Alhamdulillah.

Holding on to 3755, there will be new highsAfter gold broke through the triangle boundary, it meant that the short-term downward adjustment was over. After falling back to 3755, it rebounded again. Everything was in line with our expectations. The morning trend chart also confirmed our advanced trading vision.
In the short term, gold will rise rapidly. Don't chase the rise easily at high levels. It is possible that the main funds want to push up the price to sell. On the upside, pay attention to the suppression brought by the previous highs of 3780-3790. As gold prices rise, short-term resistance also turns into support. Judging from the hourly and 4H charts, the middle track support has also come to around 3755, and the MA5 moving average has also moved up to around 3755. Under multiple conditions, 3755 has become a solid short-term support level. If the support of 3765-3755 can be held, gold may hit a new high and reach 3800-3810. Therefore, if gold rises and reaches 3780-3790 in the evening, I may consider shorting gold with a light position. If gold retreats directly to the 3765-3755 range, we can consider going long on gold to target new highs.
Gold (XAU/USD at Critical Decision Zone - Breakout or Rejection?📊 XAU/USD (Gold) Analysis - Decision Point at 3750–3760
Quick Summary:
Hello, traders! I've been watching the FX:XAUUSD chart for a while now, it clearly observed that TVC:GOLD has been climbing in a well-defined bullish channel, with every dip quickly absorbed by buyers. That larger structure is still intact, reinforced by a sequence of consolidations and breakouts, each pushing price higher and respecting the channel structure.
Right now, however, price action is stalling inside a short-term descending flag pattern just below the 3750–3760 resistance zone which is a textbook bullish continuation pattern.
This level is a true pivot. It has rejected price twice already and lines up with key Fib retracement levels. The market is hesitating here but also strongly rejecting lower prices, as seen in the multiple rejection around the 38.2% fib levels. I believe this is a clear tension building phase for the next major move.
There are two paths i see:
Path A: A confirmed breakout would fuel another impulsive wave higher✅.
Path B: A failure could drag price back toward Fibonacci supports❌.
My base case leans bullish: continuation toward 3790–3820 if resistance gives way. But if rejection holds, we could see a retracement back into 3728 or even 3709–3690 before buyers step back in.
1. Market Structure
Main Trend: Price is moving inside a well-defined ascending channel.
Pattern: Repeated cycle of descending consolidation → breakout → continuation.
Current price is again consolidating in a small descending channel within the bigger bullish structure.
2. Key Levels
Order Block: Around 3752–3760 zone (highlighted in red).
Fib Levels:
0.236 retrace → ~3752 (current resistance)
0.382 → ~3728
0.5 → ~3709
0.618 → ~3690 (stronger support)
Upside Targets: 3790 → 3820 🎯 aligns with Fib extension.
3. RSI & Momentum
RSI at 54.5 — mid-zone, neither overbought nor oversold.
RSI is forming a small wedge/triangle , suggesting potential breakout soon (momentum building).
4. Volume Context
Previous breakouts backed by strong volume surges.
Current consolidation is on reduced volume , which is typical before expansion.
5. Scenarios
🟢Bullish Case
If price clears 3752–3760 order block, breakout confirmation could push towards 3790–3820 (channel top + Fib extension).
🔴Bearish Case
If price rejects order block, we could see pullbacks to 3728 → 3709 → 3690 (layered Fib supports + mid-channel).
A deeper rejection could test the lower channel ~3660–3680.
Patience is the real edge here. Wait for confirmation-discipline and timing always outlast impulse.

Gold May Retest 3800 — How to Trade It?Today, gold pulled back to the 20 area and formed a short-term bottom confirmation on the 30M chart with several long lower wicks.
Next, watch the 58 resistance. If price breaks and holds above, bulls will gain a clear advantage, with a likely move to test 3800.
During this move, the 72–77 zone may provide resistance, but strong bullish momentum is likely to break through it.
If gold reaches around 3800 and pulls back, this level will become a new support zone.

Gold Trade Set Sep 26 2025Price is trading within a 1h range but is still bearish until breaking 1h HH at 3761. So will be looking for sells from the most recent 15m supply/OB to target SSL
www.tradingview.com

Gold Pauses: PCE Inflation Report is the Next Battleground.Hello, investors!
Gold saw only a slight 0.1% gain, closing at $3,739.42/oz on September 25, after encountering resistance from better-than-expected US jobs data (weekly jobless claims dropped sharply). This news slightly pared back expectations for a Fed rate cut in October (down to 85%).
However, gold remains supported by dovish Fed comments and potential political instability (like Trump's proposed 100% drug tariff). The market's focus is now entirely on today’s (Sept 26) PCE Inflation Report.
Expert Warning: If PCE is hotter than expected, gold could face sharp, temporary downward pressure.
Technical Analysis & Strategy
Gold is currently consolidating within a triangle pattern and has yet to break the $375x resistance. While further selling pressure is possible before the PCE data, the long-term trend remains bullish.
Outlook: Prioritize Buy positions if the price stays above the Key Level $373x. If the news causes the price to break $373x, be ready to flip the strategy to Sell.
Key Resistance: $3755, $3768, $3778
Key Support: $3738, $3727, $3712
Suggested Trading Strategy (Strict Risk Management):
BUY SCALP
Zone: $3739 - $3737
SL: $3733
TP: $3742 - $3747 - $3752 - $3757 - $3767
BUY ZONE
Zone: $3704 - $3702
SL: $3694
TP: $3712 - $3722 - $3732 - $3742 - $3762
SELL ZONE
Zone: $3776 - $3778
SL: $3786
TP: $3768 - $3758 - $3748 - $3728 - $3708
The market is at a crossroads. What's your strategy today? 👇
#Gold #XAUUSD #PCE #Fed #Inflation #TradingView #ATH

XAUUSD Anlaysis todayHello traders, this is a complete multiple timeframe analysis of this pair. We see could find significant trading opportunities as per analysis upon price action confirmation we may take this trade. Smash the like button if you find value in this analysis and drop a comment if you have any questions or let me know which pair to cover in my next analysis.
