XLM/USDT — A Tense Standoff Between Bulls and Bears!XLM is currently sitting at a critical inflection point after a sharp mid-year rally, followed by a structured descending corrective channel. This setup signals that while bearish pressure remains dominant, quiet buying activity is emerging in the background.
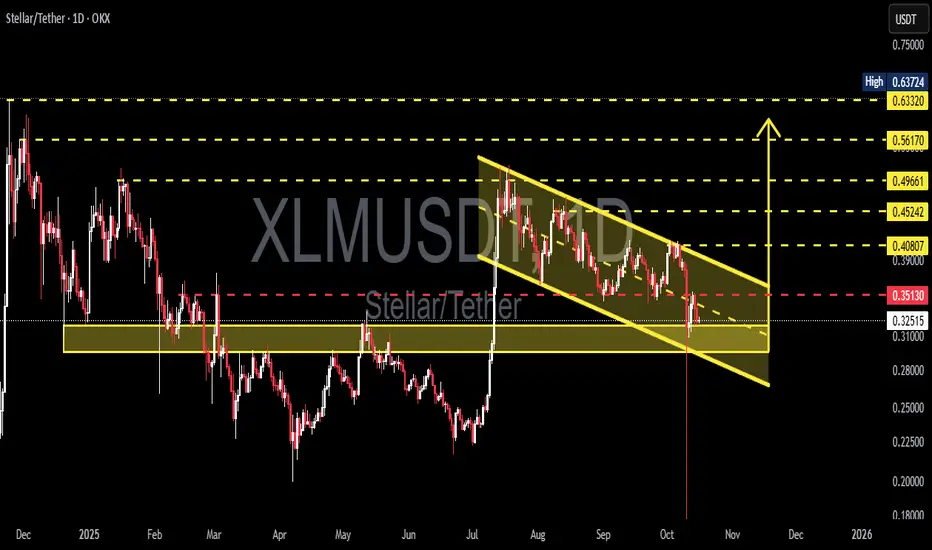
Price is now consolidating right above the major support block around 0.29 – 0.32 USDT (yellow zone) — the same area that sparked a massive vertical breakout back in July. This zone has once again become a battleground between buyers and sellers.
In recent weeks, every dip into this region has triggered quick buy reactions, suggesting potential accumulation by larger players. However, the upper boundary of the descending channel continues to act as dynamic resistance, keeping the market in a tense balance awaiting a decisive move.
---
Key Technical Structure
Pattern: Descending Parallel Channel (structured correction after impulse move)
Major Support Zone: 0.29 – 0.32 USDT
Crucial Resistance: 0.351 USDT
Upside Targets if Breakout: 0.408 / 0.452 / 0.497 / 0.561 / 0.633 USDT
Downside Targets if Breakdown: 0.235 and 0.21 USDT
---
Bullish Scenario — “The Silent Accumulation Play”
If XLM successfully defends the 0.29–0.32 support zone and breaks above 0.351 with convincing daily volume, it could signal the start of a trend reversal.
A breakout from this descending channel could ignite a local short squeeze, pushing price toward 0.408 – 0.497, and potentially up to 0.63 USDT if bullish momentum strengthens.
Such a move would confirm the end of the corrective phase and mark the beginning of a new impulsive wave for XLM.
> “As long as this support holds, the potential for a reversal remains quietly alive.”
---
Bearish Scenario — “Break the Floor”
Conversely, if the demand block at 0.29–0.32 fails to hold, XLM could enter another capitulation leg, targeting 0.235 – 0.21 USDT.
This would confirm the continuation of the downtrend, with the descending channel acting not as a correction, but as a bearish continuation pattern.
Losing this critical support would give full control to sellers and expose the price to thin liquidity areas not revisited since early 2025.
---
Strategic Conclusion
XLM is standing at a make-or-break zone.
The longer the price holds above the yellow block, the stronger the case for a potential reversal wave. But one decisive daily close below 0.29 would likely shift the entire market structure back into a dominant downtrend.
> This quiet phase is where the next big move is being decided.
Don’t react — anticipate.
---
Analyst Notes
Volume remains muted, signaling potential accumulation.
RSI shows a mild bullish divergence (early signs of momentum shift).
Price structure is still locked within the channel; direction will be confirmed only upon a daily breakout.
---
#XLM #Stellar #CryptoAnalysis #TechnicalOutlook #CryptoMarket #Altcoins #CryptoTrading #TechnicalAnalysis #BreakoutSetup #SupportZone
XLMUSDC

XLM/USDT Is Testing Its Last Line of Defense — Breakout ImminentOverview
XLM is currently sitting at a critical inflection point on the daily timeframe. The chart reveals a clear Descending Channel structure that has persisted since August — a sign of sustained selling pressure, but also a classic setup for a major bullish reversal if price breaks out decisively.
Right now, XLM is reacting from the key demand zone at $0.31–$0.28, which previously triggered a strong upward move. How price behaves here will likely determine the trend direction for the remainder of the year.
---
Pattern Explanation
Descending Channel (Yellow)
This pattern shows consistent lower highs and lower lows, indicating bearish control. However, each touch of the lower boundary has sparked a strong bounce, suggesting that buyers are gradually defending the lower levels.
Critical Demand Zone ($0.31–$0.28)
This zone has historically acted as a strong accumulation area. The recent long wick below this zone signals a liquidity sweep, often seen when institutional players absorb sell orders before pushing price upward.
Pivot Level $0.351
Acts as a psychological and mid-range pivot. A confirmed daily close above this level could trigger a short-term momentum shift in favor of the bulls.
---
Bullish Scenario
If XLM breaks and closes above the channel resistance and confirms a move above $0.351, it could mark the beginning of a trend reversal phase. Potential upside targets include:
Target 1: $0.408 — first local resistance after breakout.
Target 2: $0.452 – $0.497 — secondary resistance and trend validation zone.
Target 3: $0.562 – $0.633 — major resistance cluster and pre-expansion level.
Key confirmation: daily close above channel + volume breakout.
Additional signal: strong bullish candle (Marubozu or engulfing) with high volume.
---
Bearish Scenario
If price fails to hold above $0.31–$0.28 and closes below the channel support, the bearish continuation may extend further:
Target 1: $0.25 — next minor demand area.
Target 2: $0.18–$0.20 — final liquidity zone before potential macro reversal.
A breakdown below this zone may trigger panic selling, but could also represent the final capitulation phase before long-term accumulation begins.
---
Market Dynamics
The long lower wick seen recently indicates liquidity absorption by larger players (whales). This suggests that smart money might be accumulating positions while retail traders exit in fear.
If this pattern continues, XLM could be preparing for a macro reversal, similar to previous recovery structures seen in mid-2025.
---
Conclusion
XLM is currently at a decision zone:
A breakout above $0.351 would confirm a reversal setup and open room for a rally toward $0.40+.
A breakdown below $0.31 would confirm bearish continuation toward deeper liquidity levels.
Traders should wait for confirmation and volume before taking major positions. The $0.31–$0.28 zone remains the most attractive accumulation area, while a breakout above the channel could spark a trend shift with strong momentum.
---
#XLM #Stellar #CryptoAnalysis #TechnicalAnalysis #PriceAction #DescendingChannel #BreakoutSetup #AltcoinAnalysis #SupportAndResistance #MarketStructure
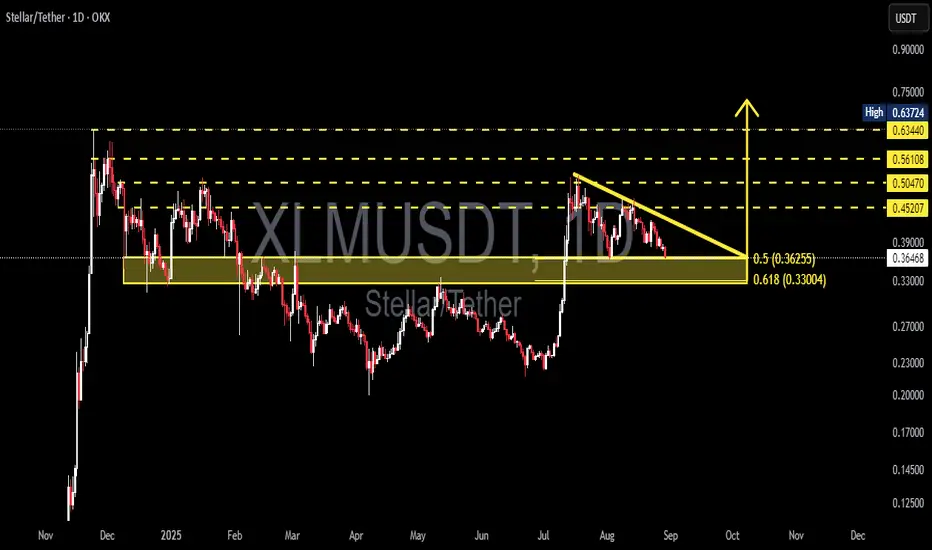
XLM/USDT — Critical Decision Zone at the Golden Confluence!XLM is currently trading at a make-or-break level. The daily chart shows the formation of a descending triangle, with sellers consistently pushing down the highs (lower highs) while buyers are defending a horizontal support zone between 0.3618 – 0.3295 USDT.
This zone acts as a “battle ground” due to several strong confluences:
Fibonacci 0.5 (0.3618) and 0.618 (0.3295) — the golden retracement area.
A historical demand zone (yellow box) that previously triggered strong rallies.
Multiple rejection wicks indicating buyers are still active around this level.
On the other hand, persistent lower highs reflect continuous seller pressure, shaping the descending triangle pattern which typically signals bearish continuation — unless a breakout occurs.
---
🔼 Bullish Scenario
If XLM manages to break above the descending trendline and daily close above 0.4052 USDT with strong volume, it will be a major bullish signal. Potential upside targets:
0.4520 USDT (first resistance / TP1)
0.5047 USDT (TP2)
0.5610 USDT (TP3)
0.634 – 0.637 USDT (psychological resistance, extended target)
Such a breakout could confirm the end of the accumulation phase and open the door for a stronger bullish trend.
---
🔽 Bearish Scenario
Conversely, if price fails to hold and we get a daily close below 0.3295 USDT, the descending triangle would be validated as a bearish continuation pattern. Downside targets include:
0.3295 USDT (first support at Fib 0.618)
0.2190 USDT (measured move projection of the triangle)
0.1997 USDT (historical low, last key support)
A breakdown below this golden pocket would suggest buyers are losing control and XLM may enter a deeper distribution phase.
---
📌 Pattern Summary
Descending Triangle → highlights dominant selling pressure, with buyers holding the base.
Golden Fibonacci Confluence + Demand Zone → makes 0.3618–0.3295 a critical decision zone.
Volume confirmation is key — without strong participation, both breakout and breakdown moves could be false.
---
🎯 Conclusion
XLM is at a crucial crossroads:
Breakout above 0.4052 → potential rally toward 0.452 – 0.505.
Breakdown below 0.3295 → triangle confirmation, targeting 0.22.
Traders should wait for daily close + volume confirmation before entering, and always apply strict risk management with stop-loss placement.
---
#XLM #XLMUSDT #Stellar #CryptoAnalysis #TechnicalAnalysis #Altcoins #CryptoTrading #DescendingTriangle #Fibonacci

Stellar (XLM) Market Outlook — September 02, 2025Sergio Richi Premium ✅
#Stellar CRYPTOCAP:XLM — Market Outlook — September 02, 2025.
Current price : $0.3620
Charts:
Let’s be real: Stellar isn’t just another alt. It’s got actual utility — fast cross-border payments, cheap fees, and big-name partners (Visa, PayPal, MoneyGram, even Telegram wallets). That’s not meme-coin hype, that’s infrastructure.
Why It Matters
➖ Protocol 23 Upgrade (September 3, 2025): A major network enhancement focusing on scalability for tokenization and RWA use cases, including improved smart contract performance and data handling. This is expected to boost institutional adoption and could drive XLM toward $1.27-$2.39 if bullish momentum holds.
➖ Archax Partnership (August 18, 2025): Collaboration with institutional-grade exchange Archax to accelerate RWA tokenization, including fractional real estate and yield-bearing assets.
➖ PayPal PYUSD Integration (July–August 2025 Impact): PayPal's stablecoin on Stellar triggered a 5% price surge earlier, with ongoing effects into August. PayPal's Digital Currencies SVP joining SDF further strengthens ties.
➖ Telegram Wallet Integration: Enables seamless XLM transfers within chats, boosting mass adoption.
➖ ZARC Stablecoin Launch (Ongoing 2025): TD Markets' South African Rand-pegged asset on Stellar, ideal for remittances.
➖ Visa Stablecoin Settlement Support: Visa added Stellar for settlements with PYUSD, USDG, and EURC, enhancing global payment rails.
➖ UNDP Partnership and SDG Accelerator: Stellar joins for pilots in climate finance and social protection.
➖ RWA and DeFi Milestones: Q2 2025 saw $4 billion in RWA payments, with tokenized assets rising from $15.2B to $24B. DeFi TVL growth across protocols signals real-world utility.
The Trade
XLM is sitting at $0.36 after a choppy summer. In my book, it’s coiling for the next leg of the global bull run.
🎯 Targets:
➡️ Take Profit 1: $1.27 (+250%)
➡️ Take Profit 2: $2.39 (+560%)
Final Take
Stellar’s building the rails while half the market’s still arguing about ETFs. At these levels, risk/reward screams long.

XLM/USDT — Descending Triangle at a Key Fibonacci Zone!🔎 Market Overview
Currently, XLM/USDT (Daily, OKX) is trading around 0.3645, testing the golden support zone between 0.3625 (0.5 Fib) and 0.3300 (0.618 Fib).
This area is highly significant because:
It has acted as a historical demand zone, repeatedly holding the price.
It aligns with the Fibonacci golden pocket (0.5 & 0.618 levels), often watched by institutional traders.
Price action forms a descending triangle, where sellers create consistent lower highs while buyers defend a horizontal floor.
In short, we are at a make-or-break decision point: will XLM break down further, or will buyers trigger a strong breakout against the classic bearish setup?
---
📐 Structure & Technical Context
Pattern: Descending Triangle → statistically bearish continuation, but strong support zones often trigger bullish fakeouts.
Lower Highs: indicate steady selling pressure.
Horizontal Support: strong cluster around 0.33 – 0.3625, coinciding with golden pocket Fib levels.
Key Resistances Above:
0.4520
0.5047
0.5610
0.6340 – 0.6370 (major supply zone).
A breakout above could flip the triangle into a bear trap and spark a mid-term rally.
---
🚀 Bullish Scenario
Main condition: price must break above the descending trendline with a convincing daily close + high volume.
Conservative entry: wait for breakout + retest (price breaks the trendline, then retests as support).
Upside Targets:
TP1 = 0.4520
TP2 = 0.5047
TP3 = 0.5610
TP4 = 0.6340 – 0.6370 (major resistance zone).
Invalidation: daily close below 0.33 (breakdown confirmed).
📊 Example Risk/Reward:
Entry = 0.3645
Stop = 0.33
TP1 = 0.4520
→ Risk = 0.0345 | Reward = 0.0875 → R:R ≈ 2.5 : 1
---
🩸 Bearish Scenario
If support breaks:
Trigger: daily close < 0.33 (0.618 Fib).
Downside Targets:
First = 0.27
Next = 0.23
Extended = 0.17 (historical swing low).
Strategy: short on breakdown + retest (support turned resistance).
Invalidation: price reclaims trendline & closes above 0.4520.
---
📊 Trading Plan Summary
The 0.33–0.3625 zone is the golden decision point:
Holding → potential bullish rally.
Breaking → deeper bearish continuation.
The descending triangle clearly shows where pressure is building.
Always manage risk tightly, as this pattern often creates false breakouts before the real move.
---
XLM is sitting at a critical crossroads. A descending triangle has formed exactly on the golden pocket Fibonacci (0.33–0.3625). A breakout could trigger upside targets at 0.45 / 0.50 / 0.56, while a breakdown could lead to 0.27 / 0.23. Wait for daily close + volume confirmation. This golden zone will decide XLM’s next big move.
#XLM #Stellar #XLMUSDT #CryptoAnalysis #Altcoin #DescendingTriangle #SupportResistance #Fibonacci #Breakout #BearishOrBullish #SwingTrade
XLM will be one of the big winners during the coming breakout!XLM, which has historically traded closely with XRP, will be one of the big winners during the upcoming breakout in May—potentially continuing into June, July, and even August.
Good luck, and always use a stop-loss!

XLM charts with April 'flash crash' thesis zones.Here's my latest XLM chart, which includes potential levels that could be hit, along with an alternative path for the 5th wave, assuming the bottom is already in on the chart.
- If wave 4 is already complete, then the wave 6 "flash crash" low would likely be higher than the chart shows.
- If wave 4 isn't complete, then the wave 6 "flash crash" would likely sweep that low, prior moving into the real breakout beginning in the month of May.
- The real breakout, the 7th wave, would likely take out the previous pattern high making a run for what could potentially become a new all-time high in XLM.
Keep in mind that the "flash crash" in April is a theory and may not come to fruition or could be off in timing. However, I do believe that the breakout will begin in May, even if the "flash crash" does not occur in mid to late April as I've theorized.
Good luck, and always use a stop loss!

XLM is going to put some smiles on people's faces very soon!The XLM chart appears to be showing some serious potential for growth. Currently trading within a descending wedge pattern and displaying a 5th wave internal wave count, XLM could outperform many people's expectations if the 5th wave plays out. Although many people tend to prefer XRP over XLM, I wouldn't count it out just yet, as—with recent price increases—it has potentially become more desirable compared to XRP due to its lower entry price range. As we know, many people don’t have a lot of extra cash just lying around nowadays.
Good luck, and always use a stop loss!

$3.00 + XLM by September is very likely! It's no mystery that XLM and XRP often trade like they are family. Much like an older brother, XRP generally paves the way for XLM—the younger sibling—and the two share a similar charting structure. However, since the "Trump election pump," although both have broken out, XLM has yet to break above the upper trendline of the current wedge pattern. This leads me to believe that we may soon see XLM surprise everyone. Instead of following, it may take the lead this time by breaking out of the wedge pattern, setting a new all-time high, and then entering price discovery along with its older brother, XRP. Together, they will likely lead the entire crypto market, as they are two of the ISO 20022-compliant tokens with the most potential for widespread adoption.
Keep an eye on XLM—I believe it will not only play catch-up but may even lead XRP and the broader crypto market in the next leg up.
Good luck, and always use a stop-loss!

Will there be one more liquidation candle for XLM?XLM closely follows XRP's price action. Many investors, traders, and speculators understand that this relationship can provide distinct advantages at times, depending on market circumstances. However, it appears that XLM may have one more liquidation event in mind before the next leg up. Although there is no guarantee that this will occur, I believe it is very likely, as the weak doji candle—currently at the $0.23 cent level—would allow another liquidation event to clear the last remaining remnants of sell-side liquidity currently resting below the previous liquidation candle. I could be wrong, but this is an area to keep your eyes on in the event that the price continues to move downward.
Good luck, and always use a stop-loss!

Stellar XLM price has finally reached TP1, where to next?Only 5 months (and for some, several years) and we finally waited for the price of CRYPTOCAP:XLM to rise.
1️⃣st target for 2024 from our previous idea has been reached, which is +150%.
Now, the main task of OKX:XLMUSDT buyers is to keep the price above $0.195
If this condition is met, the #Stellar price can go straight to fulfill the target 2️⃣, but already in 2025 it will be $0.64 - 0.65
_____________________
Did you like our analysis? Leave a comment, like, and follow to get more

$XLM STELLAR - .245 $USD Next TargetStellar now has Soroban powered smart contracts
PoW mining
Liquidity Protocols
Lending/Borrowing Protocols
Staking/ AMMs etc
Partnerships with
Franklin Templeton
MasterCard
MoneyGram
DTCC
Stripe via Bridge
and so much more
1×10^-27

XLM (Stellar) is looking very good in the short, and long term!XLM is creating a very nice-looking chart and could be preparing to appreciate significantly in the coming months or years. The longer-term aspect clearly shows that it’s trading towards the bottom of the current range and could be a very good buy at or below current levels.
Good luck, and always use a stop loss!

XLM: 2 to 1 REWARD VS. RISK, MULTI-TEIRED 30X TRADE SETUP. XLM is currently forming a nice handle in the 'Cup in a Cup' Cup & Handle pattern that I've identified. Now that the price action is near the lower trend line of the larger cup's handle, I'm comfortable putting on this trade setup.
Good luck!
Don't follow my trades; come up with your own. Don't be a follower; be a trailblazer!

XLM is exhibiting an extremely rare CUP WITHIN A CUP PATTERN!XLM has recently had an incredible run, breaking out of the current Cup & Handle pattern that I identified and showed to my followers. XLM has always closely followed XRP, but in the past few days, it has sharply broken away and has been charting its own course. Now, I’ve identified a CUP WITHIN A CUP pattern that is EXTREMELY RARE! These two patterns are working together to create a move that could make both investors and traders very, very happy in the coming weeks.
Don’t copy my trades; become a trailblazer, not a follower!
Good luck, and enjoy making a ton of money!

XLM is on the verge of a nice breakout!There’s an incredible Cup & Handle breakout about to occur with XLM. Keep in mind that this is the hourly chart, so this particular Cup & Handle pattern is better suited for short-term day trades and is not an indicator of a longer-term breakout.
Good luck, and always use a stop-loss!

Patterns built within the XLM charting structure mechanism.There are some very interesting patterns emerging within the XLM charting structure, which seem to be indicating a move to around .40 - .45 cents in the coming bull-run!
Good luck, and always use a stop-loss!

Another look at the XLM chart.The current XLM chart leaves plenty of room available for major gains over the next 6 months to a year. XLM generally runs with XRP.
Good luck, and always use a stop-loss!


An inverse head & shoulders pattern formed in XLM.Today was an incredible day for many cryptos, and not so much for others. But one thing you can be sure of is that XLM has been spending the past two weeks forming a perfect head & shoulders pattern on the 30 minute chart that, assuming it plays out bullishly, is almost near the take off point!
If price action breaks out of the dashed white line at the top of the wedge pattern, we could see a dramatic price increase in the coming weeks. This could also be a great sign that XLM could be well on its way to gaining ground, and starting a new bullish trend in the mid to long term.
Good luck, and always use a stop.

Stellar Lumens XLM formed bullish BAT for upto 25.50% moveHi dear friends, hope you are well and welcome to the new trade setup of XLM with US Dollar pair.
Recently we caught nice trade of XLM as below:
Now a daily time frame, XLM has formed a bullish BAT pattern for the next price reversal.
At the moment after the completion of final leg the priceline has slightly moved up, therefore, we can wait for some price correction to catch from the buying zone.
Buy between: $0.0901 to $0.0870
Sell between: $0.0995 to $0.1094
Stop loss: Below $0.0870
Possible profit ratio:
As per above targets there is a profit possibility of almost 25.50% and a loss possibility is upto 4%.
Note: Above idea is for educational purpose only. It is advised to diversify and strictly follow the stop loss, and don't get stuck with trade

XLM trying to breakout.XRP has been pushing in the past few hours. XLM looks like it's trying really hard to breakout of the pattern above. If XRP continues north, XLM may follow.

Subsequent downtrend continues...For the upcoming inflation report, a further drop in the cryptocurrency may well be...
