XLM/USD Bullish Market Pathway | Structured Trade Plan📈 XLM/USD — STELLAR LUMENS vs U.S. DOLLAR
🚀 Bullish Breakout Setup (Day / Swing Trade)
Setup Summary:
Bullish bias confirmed with 200 Simple Moving Average breakout + price structure support (momentum aligned with EMAs). Entry viable at any pullback near support zones for flexible risk entry.
🎯 Trade Plan
Entry:
💥 Open at favorable price levels during pullbacks while trend holds.
(Use demand zones + lower time-frame support for precision)
Targets:
✨ Primary: $0.25400
➡️ Price approaching this target aligns with broader XLM forecast ranges seen in current market predictions.
Profit scale in steps: 0.2360 → 0.2460 → 0.2540 for risk management.
Stop Loss (SL):
🔒 $0.22000 — defined weekly support based.
Manage SL dynamically as structure invalidates.
Risk Alert:
⚠️ YOU choose your SL/TP level — trade with personal risk tolerance.
🔁 Related Pairs to Watch (Correlation Plays)
BTC/USD Market leader — crypto risk appetite driven by Bitcoin movement influences XLM.
ETH/USD Broad altcoin sentiment follows ETH strength or weakness.
XRP/USD Payments/bridge asset sentiment may correlate with cross-border utility demand.
Correlation Insight:
When BTC & ETH strengthen, capital often rotates into mid-caps like XLM.
Divergence (BTC down but alt up) often signals specific altcoin setups.
📊 Key Technical Notes
✅ Simple MA breakout indicates bullish momentum continuation.
📉 RSI/MACD cycles trending into confirmation zones — watch for MACD cross & rising histogram.
Volume increase near support = strong buy interest.
🌍 Fundamental + Macroeconomic Factors (Live to London Time)
Macro Drivers Affecting Crypto Now:
🧠 U.S. job data & Fed outlook:
Recent U.S. payroll figures below expectations are influencing rate speculation and liquidity — easing bias can fuel risk assets like XLM.
📊 ETF flows & institutional demand:
Spot Bitcoin ETFs seeing renewed inflows — indicative of institutional risk appetite returning into crypto ecosystem.
🏛️ Central bank moves:
Talks of stablecoin protections and expanding crypto legitimacy in UK and U.S. regulatory landscape have macro implications for digital assets.
📈 Crypto market breadth:
BTC ~ $96k and broader market mixed strength suggests rotation between assets — XLM can benefit from altcoin pull focus.
📅 Upcoming Event Watchlist (London Time)
🔸 U.S. Federal Reserve comments – policy stance → High impact (affects risk sentiment)
🔸 U.S. CPI / PPI releases → Can shift liquidity & crypto flows
🔸 Bitcoin & crypto ETF flow reports → Big cue for directional shifts
(Times subject to official release schedule)
📌 Trade Psychology + Tips
💡 Scale out profits instead of single TP for volatility markets.
📉 Use structure breaks for SL adjustments.
📈 Liquidity sweep levels often trigger continuation plays in crypto.
😎 Final Vibe — Stay Sharp, Trade Smart!
Technical edge + macro awareness = elevated probability setups.
Remember, no trade is perfect — adapt as price reacts.
📌 Keep charts open — trends don’t wait!
Xlmusdtechnicalanalysis

XLM/USDT Waiting for Confirmation: Fake Bounce or Trend ReversalXLM/USDT on the 8-hour timeframe is still trading under a clear bearish trend. Price continues to form lower highs and lower lows, confirming strong selling pressure. However, recent price action shows consolidation near the lower range, which could act as a short-term reaction zone.
---
Pattern Explanation
The chart highlights the following key patterns:
1. Descending Trendline (Major Dynamic Resistance)
The yellow descending trendline acts as the main dynamic resistance
Price has been repeatedly rejected from this level
As long as price remains below this trendline, the overall bias stays bearish
2. Bearish Continuation Structure
Market structure remains intact with consistent lower highs
Any upward move so far appears corrective rather than a true reversal
This suggests the market is still in a distribution phase
---
Key Levels
Resistance Levels:
0.2370 – minor resistance / short-term reaction area
0.2600 – key resistance from previous breakdown
0.3000 – 0.3300 – strong supply zone
0.3500 – major resistance
Support Levels:
0.2230 – 0.2150 – current consolidation and local support
0.2030 – 0.1950 – strong support zone if further breakdown occurs
---
Bullish Scenario
The bullish scenario becomes valid if:
Price breaks and closes decisively above the descending trendline
Followed by a confirmed close above 0.2370
Ideally supported by increasing volume
Bullish Targets:
0.2600
0.3000
0.3300
A successful breakout would signal bearish structure invalidation and open the door for a medium-term trend reversal.
---
Bearish Scenario
The bearish scenario remains dominant if:
Price fails to break the descending trendline
Rejection occurs around the 0.2370 – trendline area
Price breaks below 0.2150 support
Bearish Targets:
0.2030
0.1950
This would confirm a bearish continuation toward lower demand zones.
---
Conclusion
XLM/USDT remains under strong bearish control, with the descending trendline acting as a critical level. Until a confirmed breakout occurs, price is more likely to continue its downtrend or consolidate. Traders should stay patient and wait for clear confirmation before taking positions.
---
#XLMUSDT #Stellar #CryptoAnalysis #TechnicalAnalysis #Downtrend #BearishMarket #Altcoins #CryptoTrading #MarketStructure #SupportResistance #Trendline

XLM – The bullish trend is stronger than ever! Updating targetsIn my previous XLM idea, I kept raising the invalidation level higher and higher, gradually bringing it closer to the current price. Eventually, that level was broken.
Many would have considered the plan officially invalidated at that point… but the overall bullish structure didn’t break at all. On the contrary, it only got stronger!
The fact that the price refused to go lower even after breaking the previous key level shows real strength and accumulation. This is exactly the kind of behavior we love to see in a healthy uptrend.
Therefore, I am raising my targets again:
🎯 Previous main target from the last idea: 0.27 (still very much in play)
🎯 New extended target: 0.3
❌New invalidation level (cancellation zone): 0.2505
As long as we stay above this zone, the bullish scenario remains fully intact and I expect continued upside.
The trend is alive and stronger than before. Let’s go, XLM! 🚀
(Chart is updated with new levels)

Stellar's(XLM) trajectoryConsidering the price hitting the supply zone (green area) and consuming the orders in that zone along with the reaction it has shown, now if the market also consumes the supply zone (orange area) and breaks through it, we expect the continuation of the upward movement to the next levels. BINANCE:XLMUSDT

XLM/USDT — Rebound from Golden Zone or Continue the Downtrend?The XLM market is regaining attention after revisiting the golden zone at 0.248 – 0.220, an area that has repeatedly served as a strong foundation for buyers in recent months. The price reaction in this zone shows clear signs of sell-side absorption, visible through the emergence of long lower wicks, indicating sellers are losing momentum while buyers are quietly stepping in.
The medium-term structure remains bearish, characterized by a series of lower highs and lower lows. However, a potential technical reversal could unfold if the price manages to close a 2D candle above 0.32. This level acts as the psychological barrier separating a possible trend reversal from a mere corrective bounce.
If buying momentum continues, the layered resistance zones at 0.348 – 0.405 – 0.450 – 0.490 – 0.560 will serve as major checkpoints on the road to recovery. A breakout and consolidation above 0.405 could mark the formation of a new bullish structure.
Conversely, failure to hold the 0.248–0.220 support zone and a confirmed 2D close below 0.22 would strengthen the bearish continuation scenario, with potential downside targets toward 0.18 or even 0.155, where major accumulation may reappear.
---
Bullish Scenario:
Strong rebound from the 0.248–0.220 zone, forming a new higher low.
Main confirmation: 2D close above 0.32.
Step-by-step targets:
1. 0.348 (structure confirmation)
2. 0.405 (mid-term resistance)
3. 0.450–0.490 (distribution zone)
4. 0.560 (final short-term bullish target)
> A sustainable bullish structure forms only if buyers can hold above 0.348–0.37 for multiple consecutive 2D candles.
---
Bearish Scenario:
Breakdown below 0.220 with strong volume confirms sellers’ dominance.
Next targets: 0.18 and 0.155, where liquidity hunts and possible re-accumulation could occur.
This scenario remains valid unless the price reclaims 0.248 after a breakdown (failed reclaim = bearish confirmation).
---
Pattern:
The current setup resembles a “Descending Range with Accumulation Base”, where price continues to make lower highs but forms a flat base structure around 0.248–0.220.
Such formations often mark the early phase of a trend reversal when accompanied by increasing volume and a false breakdown (liquidity sweep).
If a break of structure occurs above 0.32, this could evolve into a Double Bottom Reversal Pattern.
---
Conclusion:
XLM is at a critical moment — the historical golden support zone is being tested once again.
Buyers have a solid chance to initiate a strong reversal, but without a confirmed close above 0.32, it could still turn out to be a dead cat bounce.
Aggressive traders may look to accumulate within the 0.248–0.220 zone with a tight stop below 0.215, while conservative traders should wait for a breakout confirmation above 0.32 to validate a potential trend reversal.
---
#XLM #Stellar #XLMUSDT #CryptoAnalysis #TechnicalAnalysis #SupportZone #BullishReversal #CryptoTrading #Altcoins

XLM/USDT Momentum Watch – Breakout Could Happen Today!🌟 XLM/USDT: The Stellar Heist Blueprint | Kijun Breakout Play 💰
📊 Market Intelligence Report
Asset Under Surveillance: XLM/USDT (Stellar vs Tether)
Operation Type: Swing/Day Trade Hybrid Strategy
Market Sentiment: Bullish Pending Execution 🎯
🎭 The Setup (No Hollywood Fiction, Just Charts)
We're watching STELLAR like hawks eyeing their next meal. The technical setup is cleaner than a freshly pressed suit, and here's why:
🔍 The Technical Breakdown
The Signal: Kijun-sen (Base Line) moving average breakout incoming
Current Status: Asset coiling up, ready to make moves
💎 Entry Strategy - The "Gentleman's Approach"
Entry Zone: Any price level after confirmed breakout above $0.4100
⚠️ Wait for the breakout confirmation - patience pays, FOMO doesn't!
🛡️ Risk Management (AKA: The Exit Plan)
Stop Loss: $0.3800 ⛔
⚖️ Risk Disclaimer:
Listen up, sophisticated traders - I'm sharing MY stop loss level for educational purposes. This isn't financial advice carved in stone. YOU control your own risk tolerance. Adjust your SL based on your capital management strategy and risk appetite. This is YOUR money, YOUR rules, YOUR responsibility.
🎯 Profit Targets (The Escape Route)
Primary Target: $0.4600 🚀
Maximum Resistance Zone: $0.4700 🚧
📍 Why $0.4600?
$0.4700 acts as a fortress-level resistance
Historical price rejection zone (aka the trap door)
Overbought conditions likely at this level
RSI divergence probability increases
Smart Exit Strategy:
Scale out between $0.4600-$0.4700. Don't get greedy - the market rewards discipline, not hope.
⚖️ Profit Disclaimer:
These are MY take-profit levels based on technical analysis. You're the captain of your ship. Take profits when YOUR strategy says so. Secure gains at YOUR comfort level. Risk management > Perfect entries.
🔗 Correlated Pairs to Monitor
Keep these on your radar for confirmation signals:
XRP/USDT 💵 - Brother from another blockchain, similar payment protocol narrative
ADA/USDT 💵 - Altcoin correlation, risk-on sentiment gauge
BTC/USDT 💵 - The godfather, drives overall crypto market sentiment
ETH/USDT 💵 - Smart contract leader, altcoin cycle indicator
📊 Correlation Logic:
When XRP pumps, XLM usually follows (payment token brotherhood). BTC/ETH movements dictate overall market appetite. If BTC dumps, all bets are off - protect capital first!
🔑 Key Technical Points
✅ Kijun-sen breakout = momentum shift confirmation
✅ $0.4100 level = Previous resistance turning support
✅ Volume spike = Smart money accumulation phase
✅ Risk/Reward ratio = Approximately 1:2.6 (sweet spot!)
✅ Market structure = Higher lows forming (bullish bias)
⚠️ The Fine Print (Read This!)
🎩 Trading Style Disclaimer:
This analysis represents a "high-risk, high-reward" trading approach presented in an entertaining format. This is NOT financial advice. This is technical analysis shared for educational and entertainment purposes only.
🎲 Your Responsibility:
Do your own research (DYOR)
Never trade with money you can't afford to lose
Past performance ≠ future results
Markets are unpredictable - manage your risk accordingly
This is a speculative strategy - trade at your own risk
💼 Professional Reminder:
I'm sharing my analysis, not managing your portfolio. You are 100% responsible for your trading decisions, wins, and losses. When in doubt, consult a licensed financial advisor.
✨ If you find value in my analysis, a 👍 and 🚀 boost is much appreciated — it helps me share more setups with the community!
#XLM #XLMUSDT #Stellar #CryptoTrading #TechnicalAnalysis #SwingTrading #DayTrading #Altcoins #CryptoSignals #TradingStrategy #KijunBreakout #IchimokuCloud #CryptoTA #RiskManagement #TradingIdeas #USDT #PaymentTokens #CryptoMarket #TradingCommunity

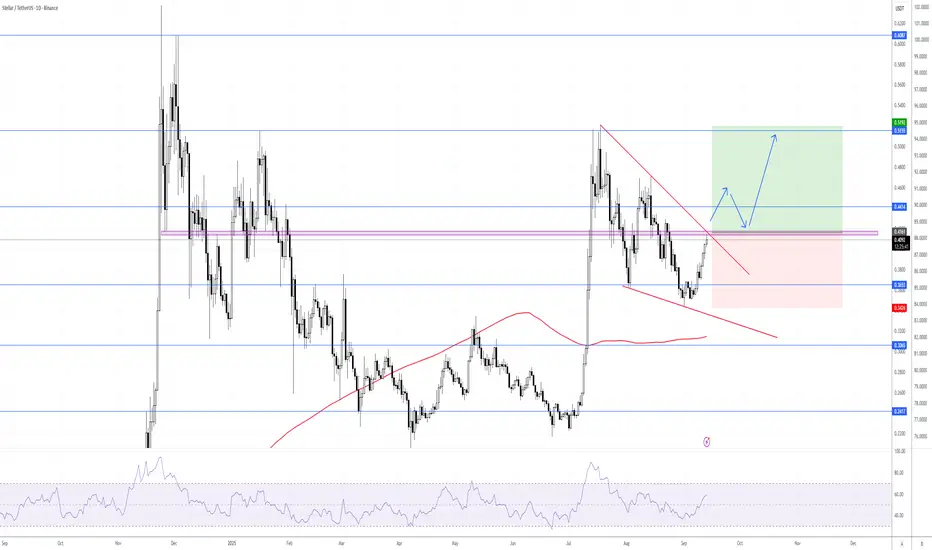
XLM/USDT — A Tense Standoff Between Bulls and Bears!XLM is currently sitting at a critical inflection point after a sharp mid-year rally, followed by a structured descending corrective channel. This setup signals that while bearish pressure remains dominant, quiet buying activity is emerging in the background.
Price is now consolidating right above the major support block around 0.29 – 0.32 USDT (yellow zone) — the same area that sparked a massive vertical breakout back in July. This zone has once again become a battleground between buyers and sellers.
In recent weeks, every dip into this region has triggered quick buy reactions, suggesting potential accumulation by larger players. However, the upper boundary of the descending channel continues to act as dynamic resistance, keeping the market in a tense balance awaiting a decisive move.
---
Key Technical Structure
Pattern: Descending Parallel Channel (structured correction after impulse move)
Major Support Zone: 0.29 – 0.32 USDT
Crucial Resistance: 0.351 USDT
Upside Targets if Breakout: 0.408 / 0.452 / 0.497 / 0.561 / 0.633 USDT
Downside Targets if Breakdown: 0.235 and 0.21 USDT
---
Bullish Scenario — “The Silent Accumulation Play”
If XLM successfully defends the 0.29–0.32 support zone and breaks above 0.351 with convincing daily volume, it could signal the start of a trend reversal.
A breakout from this descending channel could ignite a local short squeeze, pushing price toward 0.408 – 0.497, and potentially up to 0.63 USDT if bullish momentum strengthens.
Such a move would confirm the end of the corrective phase and mark the beginning of a new impulsive wave for XLM.
> “As long as this support holds, the potential for a reversal remains quietly alive.”
---
Bearish Scenario — “Break the Floor”
Conversely, if the demand block at 0.29–0.32 fails to hold, XLM could enter another capitulation leg, targeting 0.235 – 0.21 USDT.
This would confirm the continuation of the downtrend, with the descending channel acting not as a correction, but as a bearish continuation pattern.
Losing this critical support would give full control to sellers and expose the price to thin liquidity areas not revisited since early 2025.
---
Strategic Conclusion
XLM is standing at a make-or-break zone.
The longer the price holds above the yellow block, the stronger the case for a potential reversal wave. But one decisive daily close below 0.29 would likely shift the entire market structure back into a dominant downtrend.
> This quiet phase is where the next big move is being decided.
Don’t react — anticipate.
---
Analyst Notes
Volume remains muted, signaling potential accumulation.
RSI shows a mild bullish divergence (early signs of momentum shift).
Price structure is still locked within the channel; direction will be confirmed only upon a daily breakout.
---
#XLM #Stellar #CryptoAnalysis #TechnicalOutlook #CryptoMarket #Altcoins #CryptoTrading #TechnicalAnalysis #BreakoutSetup #SupportZone

XLM/USDT Is Testing Its Last Line of Defense — Breakout ImminentOverview
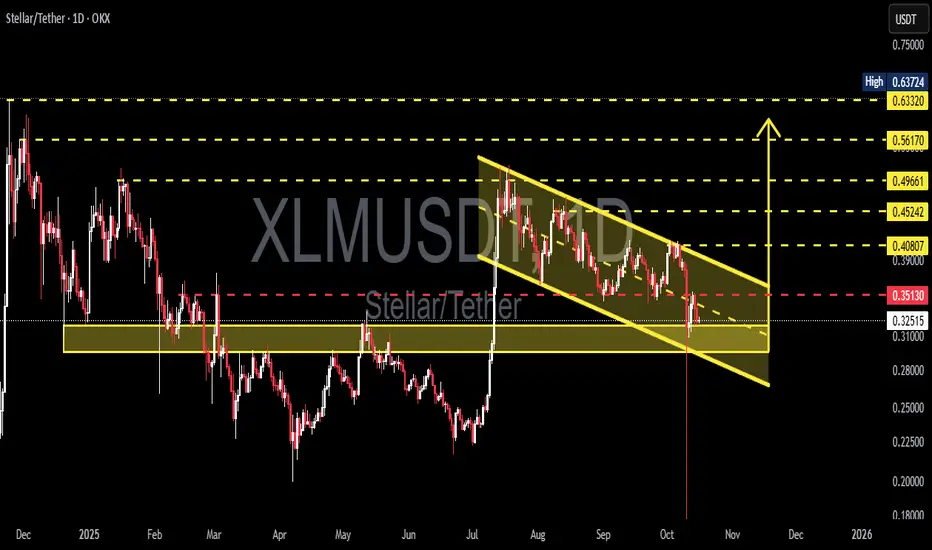
XLM is currently sitting at a critical inflection point on the daily timeframe. The chart reveals a clear Descending Channel structure that has persisted since August — a sign of sustained selling pressure, but also a classic setup for a major bullish reversal if price breaks out decisively.
Right now, XLM is reacting from the key demand zone at $0.31–$0.28, which previously triggered a strong upward move. How price behaves here will likely determine the trend direction for the remainder of the year.
---
Pattern Explanation
Descending Channel (Yellow)
This pattern shows consistent lower highs and lower lows, indicating bearish control. However, each touch of the lower boundary has sparked a strong bounce, suggesting that buyers are gradually defending the lower levels.
Critical Demand Zone ($0.31–$0.28)
This zone has historically acted as a strong accumulation area. The recent long wick below this zone signals a liquidity sweep, often seen when institutional players absorb sell orders before pushing price upward.
Pivot Level $0.351
Acts as a psychological and mid-range pivot. A confirmed daily close above this level could trigger a short-term momentum shift in favor of the bulls.
---
Bullish Scenario
If XLM breaks and closes above the channel resistance and confirms a move above $0.351, it could mark the beginning of a trend reversal phase. Potential upside targets include:
Target 1: $0.408 — first local resistance after breakout.
Target 2: $0.452 – $0.497 — secondary resistance and trend validation zone.
Target 3: $0.562 – $0.633 — major resistance cluster and pre-expansion level.
Key confirmation: daily close above channel + volume breakout.
Additional signal: strong bullish candle (Marubozu or engulfing) with high volume.
---
Bearish Scenario
If price fails to hold above $0.31–$0.28 and closes below the channel support, the bearish continuation may extend further:
Target 1: $0.25 — next minor demand area.
Target 2: $0.18–$0.20 — final liquidity zone before potential macro reversal.
A breakdown below this zone may trigger panic selling, but could also represent the final capitulation phase before long-term accumulation begins.
---
Market Dynamics
The long lower wick seen recently indicates liquidity absorption by larger players (whales). This suggests that smart money might be accumulating positions while retail traders exit in fear.
If this pattern continues, XLM could be preparing for a macro reversal, similar to previous recovery structures seen in mid-2025.
---
Conclusion
XLM is currently at a decision zone:
A breakout above $0.351 would confirm a reversal setup and open room for a rally toward $0.40+.
A breakdown below $0.31 would confirm bearish continuation toward deeper liquidity levels.
Traders should wait for confirmation and volume before taking major positions. The $0.31–$0.28 zone remains the most attractive accumulation area, while a breakout above the channel could spark a trend shift with strong momentum.
---
#XLM #Stellar #CryptoAnalysis #TechnicalAnalysis #PriceAction #DescendingChannel #BreakoutSetup #AltcoinAnalysis #SupportAndResistance #MarketStructure
Rebound in Motion: XLM Eyes Channel Top AgainCRYPTOCAP:XLM has bounced strongly from the lower trendline and re-entered the channel.
This move shows clear buyer strength and a potential shift in short-term momentum. As long as XLM holds within the channel, a retest of the upper boundary looks likely.

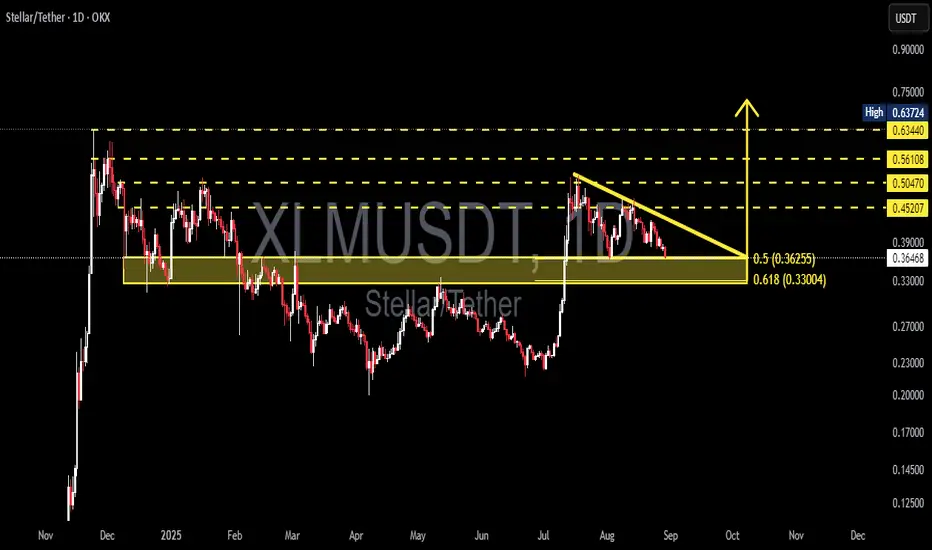
XLM/USDT — Critical Decision Zone at the Golden Confluence!XLM is currently trading at a make-or-break level. The daily chart shows the formation of a descending triangle, with sellers consistently pushing down the highs (lower highs) while buyers are defending a horizontal support zone between 0.3618 – 0.3295 USDT.
This zone acts as a “battle ground” due to several strong confluences:
Fibonacci 0.5 (0.3618) and 0.618 (0.3295) — the golden retracement area.
A historical demand zone (yellow box) that previously triggered strong rallies.
Multiple rejection wicks indicating buyers are still active around this level.
On the other hand, persistent lower highs reflect continuous seller pressure, shaping the descending triangle pattern which typically signals bearish continuation — unless a breakout occurs.
---
🔼 Bullish Scenario
If XLM manages to break above the descending trendline and daily close above 0.4052 USDT with strong volume, it will be a major bullish signal. Potential upside targets:
0.4520 USDT (first resistance / TP1)
0.5047 USDT (TP2)
0.5610 USDT (TP3)
0.634 – 0.637 USDT (psychological resistance, extended target)
Such a breakout could confirm the end of the accumulation phase and open the door for a stronger bullish trend.
---
🔽 Bearish Scenario
Conversely, if price fails to hold and we get a daily close below 0.3295 USDT, the descending triangle would be validated as a bearish continuation pattern. Downside targets include:
0.3295 USDT (first support at Fib 0.618)
0.2190 USDT (measured move projection of the triangle)
0.1997 USDT (historical low, last key support)
A breakdown below this golden pocket would suggest buyers are losing control and XLM may enter a deeper distribution phase.
---
📌 Pattern Summary
Descending Triangle → highlights dominant selling pressure, with buyers holding the base.
Golden Fibonacci Confluence + Demand Zone → makes 0.3618–0.3295 a critical decision zone.
Volume confirmation is key — without strong participation, both breakout and breakdown moves could be false.
---
🎯 Conclusion
XLM is at a crucial crossroads:
Breakout above 0.4052 → potential rally toward 0.452 – 0.505.
Breakdown below 0.3295 → triangle confirmation, targeting 0.22.
Traders should wait for daily close + volume confirmation before entering, and always apply strict risk management with stop-loss placement.
---
#XLM #XLMUSDT #Stellar #CryptoAnalysis #TechnicalAnalysis #Altcoins #CryptoTrading #DescendingTriangle #Fibonacci

Stellar Bullish FlagXLM/USDT formed a bullish falling wedge and is now approaching resistance. Breakout confirmation above 0.4161 opens the path to 0.5155, with potential extension to 0.6087. Wait for the breakout and the retest. Stop loss below 0.3425.
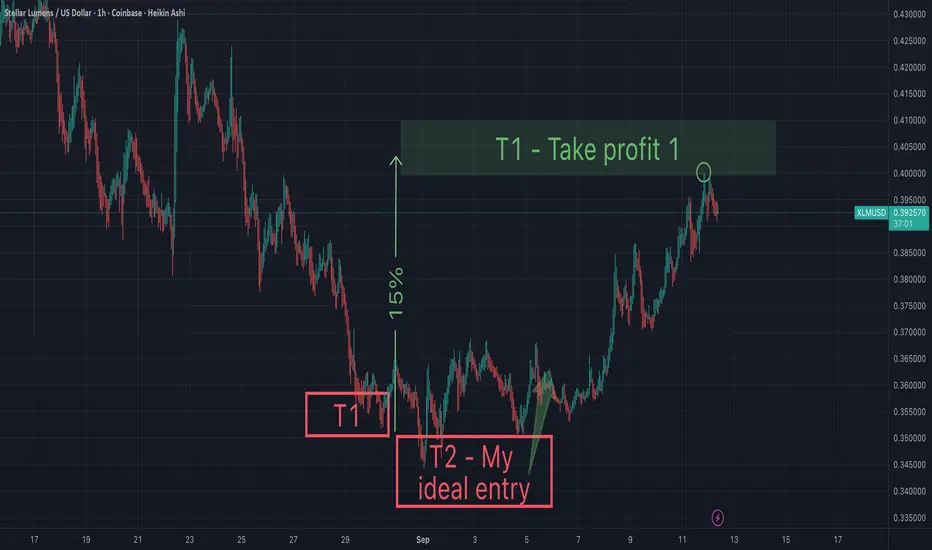
Xlm - Take profit targetI'm anticipating my take profit to be hit this weekend. I bought the bottom last Sunday, and I'm up 14%, so if my target hits, I'm up 20%. Xlm may continue up beyond my take profit target, but I don't want to be greedy. May the trends be with you.

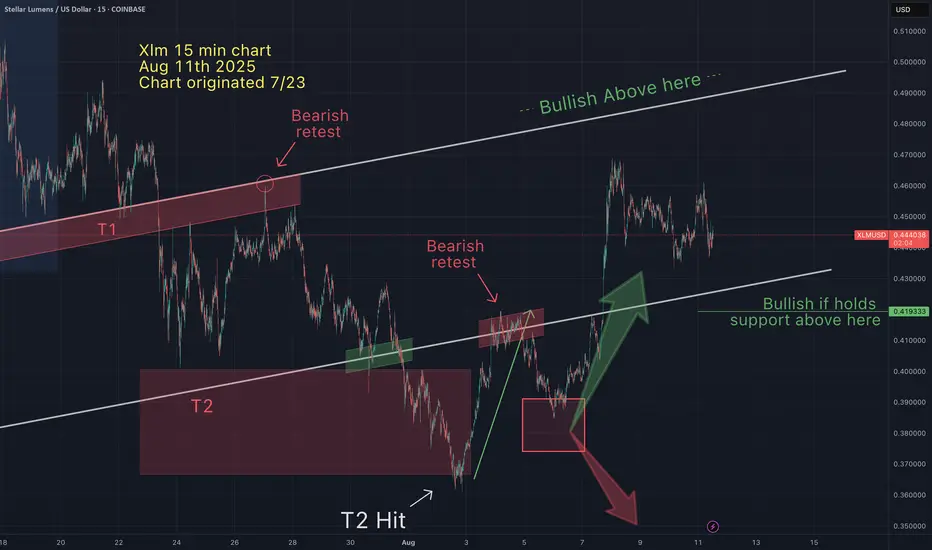
You will ask yourself, "how did he know Xlm would do that"?On Aug 30th I suggested that Xlm would drop lower into my T2, then bounce to my "take profit 1". I am grateful this played out perfectly.
Now the question remains, will we get a pullback or continue up to my T2? What are your thoughts? I'd like to hear from you and get a sense of sentiment.
The Black Hole Swallowing $XLMStellar Lumens is showing clear signs of a bearish structure despite recent volatility. The chart suggests that price action may attempt a relief rally toward the $0.47 zone, but this move looks more like a corrective upswing within a broader downtrend.
Unless CRYPTOCAP:XLM can establish strong support above that level, the probability remains high that it will resume its descent, with a decisive move back below $0.34 on the horizon. In short, the gravitational pull of the broader market trend appears stronger than any short-term bounce.
Patience and risk management are critical here..this is less of a breakout and more of a classic bull trap in the making.

Xlm - Support and resistance & take profitsXlm - Support and resistance & take profits. T1 was hit yesterday, but there is a strong possibility we go lower into T2 (my ideal buy zone- for a short term bounce to green T1).
May the trends be with you.

XLM/USDT — Descending Triangle at a Key Fibonacci Zone!🔎 Market Overview
Currently, XLM/USDT (Daily, OKX) is trading around 0.3645, testing the golden support zone between 0.3625 (0.5 Fib) and 0.3300 (0.618 Fib).
This area is highly significant because:
It has acted as a historical demand zone, repeatedly holding the price.
It aligns with the Fibonacci golden pocket (0.5 & 0.618 levels), often watched by institutional traders.
Price action forms a descending triangle, where sellers create consistent lower highs while buyers defend a horizontal floor.
In short, we are at a make-or-break decision point: will XLM break down further, or will buyers trigger a strong breakout against the classic bearish setup?
---
📐 Structure & Technical Context
Pattern: Descending Triangle → statistically bearish continuation, but strong support zones often trigger bullish fakeouts.
Lower Highs: indicate steady selling pressure.
Horizontal Support: strong cluster around 0.33 – 0.3625, coinciding with golden pocket Fib levels.
Key Resistances Above:
0.4520
0.5047
0.5610
0.6340 – 0.6370 (major supply zone).
A breakout above could flip the triangle into a bear trap and spark a mid-term rally.
---
🚀 Bullish Scenario
Main condition: price must break above the descending trendline with a convincing daily close + high volume.
Conservative entry: wait for breakout + retest (price breaks the trendline, then retests as support).
Upside Targets:
TP1 = 0.4520
TP2 = 0.5047
TP3 = 0.5610
TP4 = 0.6340 – 0.6370 (major resistance zone).
Invalidation: daily close below 0.33 (breakdown confirmed).
📊 Example Risk/Reward:
Entry = 0.3645
Stop = 0.33
TP1 = 0.4520
→ Risk = 0.0345 | Reward = 0.0875 → R:R ≈ 2.5 : 1
---
🩸 Bearish Scenario
If support breaks:
Trigger: daily close < 0.33 (0.618 Fib).
Downside Targets:
First = 0.27
Next = 0.23
Extended = 0.17 (historical swing low).
Strategy: short on breakdown + retest (support turned resistance).
Invalidation: price reclaims trendline & closes above 0.4520.
---
📊 Trading Plan Summary
The 0.33–0.3625 zone is the golden decision point:
Holding → potential bullish rally.
Breaking → deeper bearish continuation.
The descending triangle clearly shows where pressure is building.
Always manage risk tightly, as this pattern often creates false breakouts before the real move.
---
XLM is sitting at a critical crossroads. A descending triangle has formed exactly on the golden pocket Fibonacci (0.33–0.3625). A breakout could trigger upside targets at 0.45 / 0.50 / 0.56, while a breakdown could lead to 0.27 / 0.23. Wait for daily close + volume confirmation. This golden zone will decide XLM’s next big move.
#XLM #Stellar #XLMUSDT #CryptoAnalysis #Altcoin #DescendingTriangle #SupportResistance #Fibonacci #Breakout #BearishOrBullish #SwingTrade
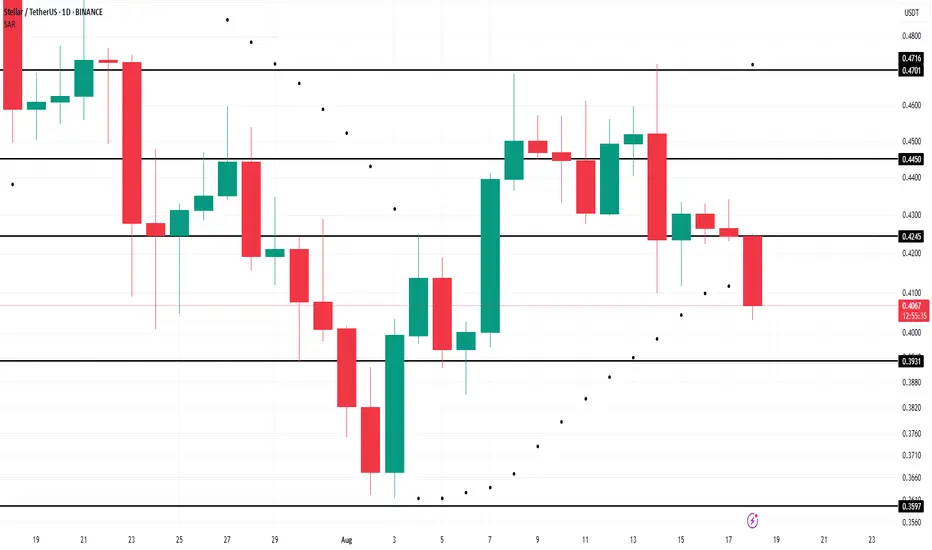
Stellar Falls To $0.40; But Parabolic SAR Flags Deeper DeclineAt the time of writing , BINANCE:XLMUSDT trades at $0.409 and faces a risk of slipping lower. Technical factors point to a potential drop toward $0.393 support, a level that may determine whether bearish control continues to strengthen in the coming sessions.
From a technical perspective, BINANCE:XLMUSDT momentum is leaning bearish . The Moving Average Convergence Divergence (MACD) indicator has confirmed a bearish crossover, signaling growing downside pressure. The crossover reflects weakening strength among buyers and indicates a market environment increasingly favorable for sellers.
Adding to the concern, the Parabolic SAR indicator is positioned above candlesticks, acting as resistance. This placement confirms a downtrend, suggesting BINANCE:XLMUSDT could face additional declines. If bearish sentiment dominates, the cryptocurrency might even test deeper support near $0.359, worsening investor confidence further.
However, if traders shift toward a bullish stance, Stellar has recovery potential. Reclaiming $0.424 as support could allow BINANCE:XLMUSDT to climb toward $0.445. Achieving this move would negate the bearish outlook, signaling renewed strength and stabilizing the asset after recent declines.
Xlm - More short term upside. Should we be medium term bearish?There is a high probability that Btc will go lower (see my Aug 16 Btc chart). Does that mean alts will too? I hope not, but I need to protect my gains. Being too bulish can get me in trouble, especially if I'm not taking profits.
Being aware of inflection points has proven to be extremely helpful in retaining my gains. If I'm wrong and the asset pumps, that's OK too. Because I have learned that losing out on "potential gains" (FOMO) is NOT the same as losing my capital.
May the trends be with you.

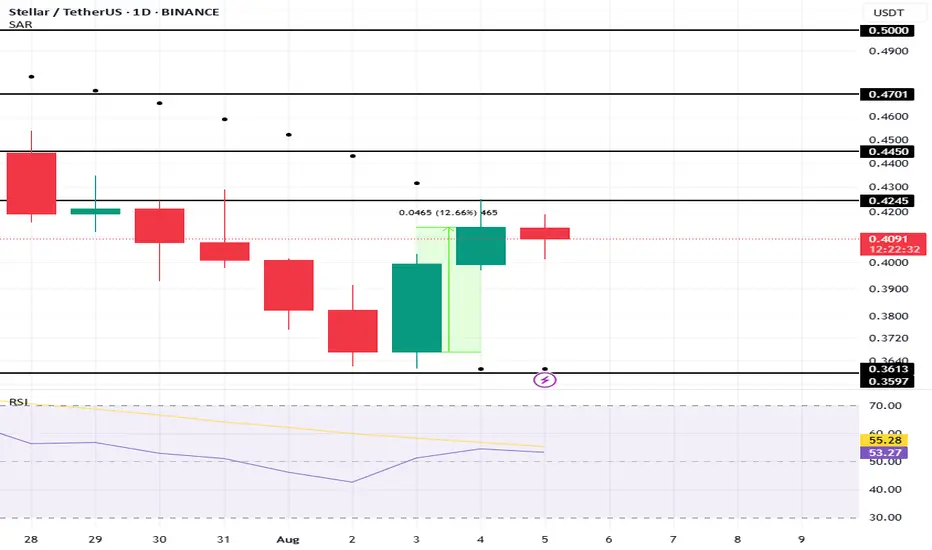
How did I know that Xlm would retrace...then bounce off $0.38?On Aug 5th I suggested that Xlm was apporaching an "inflection point", indicated by my green and red arrows converging at $0.38. See chart below from Aug 5th.
In mathematics an "inflection point" is a point in the curve at which a change in the direction of curvature occurs. These price charts are merely graphs, with coordinates and reoccuring patterns. Anticipating inflection points allow me to determine directionality. Knowing where direction may change allows me to either make quick profitable decisions and/or where to set appropriate stops (invalidation).
TA works!
Stellar (XML) Price Ends 2-Week Downtrend As Inflows SpikeBINANCE:XLMUSDT price is currently trading at $0.41 1, just under the resistance level of $0.424. Breaking this resistance will be key for XLM to recover the recent losses and continue its upward trajectory. The Parabolic SAR moving below the candlesticks after two weeks signals that the downtrend is coming to an end.
Ethereum’s technical indicators also suggest a return to bullish momentum. The Relative Strength Index (RSI) has moved back into the positive zone, above the neutral 50.0 mark, after briefly dipping into bearish territory. This reversal from the prior downtrend shows that BINANCE:XLMUSDT is regaining strength.
The RSI indicates that investor sentiment is improving . The brief period of bearishness was likely caused by broader market uncertainty and skepticism. However, with the RSI back in the positive range, the likelihood of further price increases has increased.
If Stellar can flip $0.424 into support , it could pave the way for a rise past $0.445 and possibly reach $0.470 . This would allow BINANCE:XLMUSDT to recover a significant portion of the losses it sustained over the past two weeks and continue its uptrend.
However, if broader market conditions fail to remain bullish and investor sentiment turns negative, BINANCE:XLMUSDT could face a decline. A failure to maintain support at $0.424 could lead XLM to drop to $0.393 , with further bearish momentum pushing the price to $0.359, invalidating the bullish outlook.
Stellar (XLM) Shoot Up 11%, Aims To Cross This Barrier
BINANCE:XLMUSDT price has increased by 11% over the last 24 hours , positioning it among the top-performing altcoins. Trading at $0.4077 , the altcoin remains under the resistance of $0.4245. This indicates potential for a breakout if broader market conditions stay favorable and support the bullish trend.
The 50-day exponential moving average (EMA) provides strong support, signaling that the broader market momentum is bullish. This support could propel BINANCE:XLMUSDT towards $0.4450 , with further gains potentially pushing it to $0.4701, confirming the continuation of its positive trajectory in the market if conditions remain favorable.
However, if market conditions worsen , especially with the upcoming August 7 announcements, XLM might fail to breach $0.4245 . In this case, the price could fall to $0.3597 , and losing this support would invalidate the bullish outlook for BINANCE:XLMUSDT , signaling potential downside risks in the coming days.

XLMUSDT – Accumulation Phase or the Start of a Major Breakout?🔍 Market Overview:
Stellar (XLM) against USDT is showing a technically significant structure. After breaking above a long-standing consolidation zone, price is now in a mild corrective phase, retesting previous resistance as new support. This setup suggests a critical decision point — will XLM confirm a bullish continuation, or was it a false breakout before further decline?
---
📌 Key Price Levels:
✅ Strong Demand Zone (Historical Support + Fibonacci Confluence)
XLM recently surged from the zone between $0.32972–$0.36213, which coincides with:
Fibonacci retracement levels: 0.5 (0.36213) & 0.618 (0.32972) from the recent swing low
A multi-tested support/resistance zone, now acting as a major demand area
This zone is currently the most critical support region for bulls to defend.
❌ Layered Resistance Zones (Bullish Targets Ahead)
If upward momentum resumes, watch these key resistance levels:
0.45207 → Nearest resistance
0.50470 → Structural resistance
0.56108 → Mid-range psychological barrier
0.60000 → Historical resistance zone
0.63440 → Medium-term technical target
0.63724 → Local swing high
---
📈 Bullish Scenario:
> "As long as price holds above the demand zone without printing lower lows, the bullish bias remains valid."
1. Bullish continuation confirmed with a daily close above $0.45207, ideally supported by strong volume.
2. A bullish continuation pattern (e.g., flag or pennant) may be forming.
3. Short-term targets extend to $0.50470–$0.56108, with a mid-term outlook toward $0.63+.
4. Macro sentiment or altcoin market momentum could act as a breakout catalyst.
---
📉 Bearish Scenario:
> "A breakdown below the demand zone could trigger a bearish trend reversal."
1. Failure to hold $0.42 could trigger a deeper pullback to $0.36–$0.33 zone.
2. A confirmed breakdown below $0.32972 (Fibo 0.618) invalidates bullish structure, possibly starting a new downtrend (Lower Lows).
3. Watch for potential bearish divergence if price gets rejected around $0.45–$0.50 area.
---
📐 Chart Pattern & Market Structure:
Currently showing a developing Higher High & Higher Low (HH-HL) structure — a sign of early trend reversal.
Price may be forming a Bullish Rectangle or Ascending Triangle, depending on future break direction.
This pullback appears to be a healthy retest, not a trend reversal (yet).
---
🧠 Strategy & Trader Insights:
Swing traders may look to enter near $0.36–$0.38, with tight stops below $0.32.
Breakout traders should wait for a clear breakout and close above $0.45207 before entering.
Avoid chasing trades in the middle of the range — wait for confirmation or rejection at key levels.
---
💬 Final Thoughts:
This is a high-potential setup for XLM, provided the current support structure holds. The demand zone is acting as a critical foundation for any bullish continuation. However, risk management is essential as the market approaches a key decision point.
#XLMUSDT #Stellar #CryptoAnalysis #AltcoinSeason #PriceAction #SupportResistance #TechnicalAnalysis #FibonacciLevels #BreakoutSetup

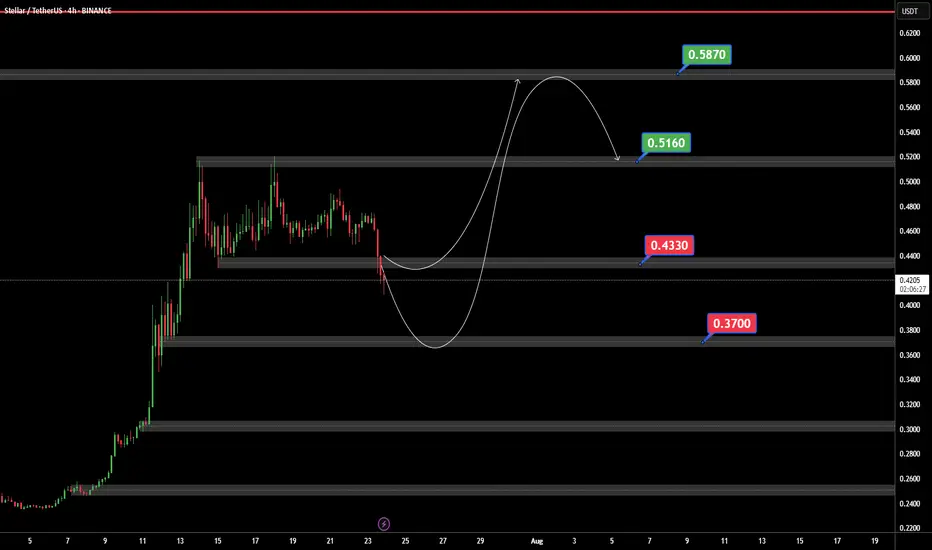
XLMUSDTIf BINANCE:XLMUSDT can support 0.4430 $ ready for jump to 0.5160 and best target in 0.5873 $.
But if XLM can price breaked 0.4330$ support we ready for a bear trend.