Will XRP Form a Death Cross or Repeat July 2025 Rally?At the time of writing, XRP trades at $2.55, holding slightly above the crucial $2.54 support level. The altcoin needs renewed bullish activity to break through resistance at $2.64, which would confirm upward momentum.
If the Death Cross materializes, XRP could face a short-term correction, possibly dropping toward $2.35 or lower. Such a decline might trigger short-lived selling as traders react to the technical setup.
Conversely, if investor maturity continues to grow, XRP could replicate its July 2025 breakout. A successful push above $2.64 could propel the token toward $2.75 and potentially $2.85. This would invalidate the bearish outlook and reigniting bullish sentiment
Xrpusdanalysis

XRP Whales’ $500 Million Accumulation Pushes Price Past $2.5At the time of writing, XRP trades at $2.65, attempting to establish $2.64 as a new support floor. The token has climbed more than 12% in the past week, marking one of its strongest short-term rallies in months.
If bullish sentiment continues, XRP could extend its rise toward the $2.75 resistance level. Investor support, particularly from whales, may help drive the asset closer to the $3.00 mark, signaling a broader recovery phase.
However, if XRP faces renewed selling or bearish market cues, it could retrace to $2.54 or even $2.35. Such a decline would invalidate the current bullish outlook and suggest short-term exhaustion among investors.

XRP: Holds Firm Ripple (XRP) managed a modest rebound following last week’s moderate sell-off. However, under our primary scenario, blue wave (iii) is expected to push prices lower once again, targeting a bottom above the turquoise long Target Zone between $1.03 and $0.38. After that, wave (iv) should prompt a corrective move to the upside before wave (v) completes the entire blue five-wave sequence within the turquoise zone, thereby concluding the larger turquoise wave B correction. Prices in this zone could present attractive long entry opportunities, as the ensuing wave C is likely to propel the altcoin above resistance at $4.09. At that level, the higher-degree magenta wave (Y) should also reach completion. If XRP breaks out directly above the $3.19 resistance, it will suggest that wave alt.B has already finished (with a 30% probability).

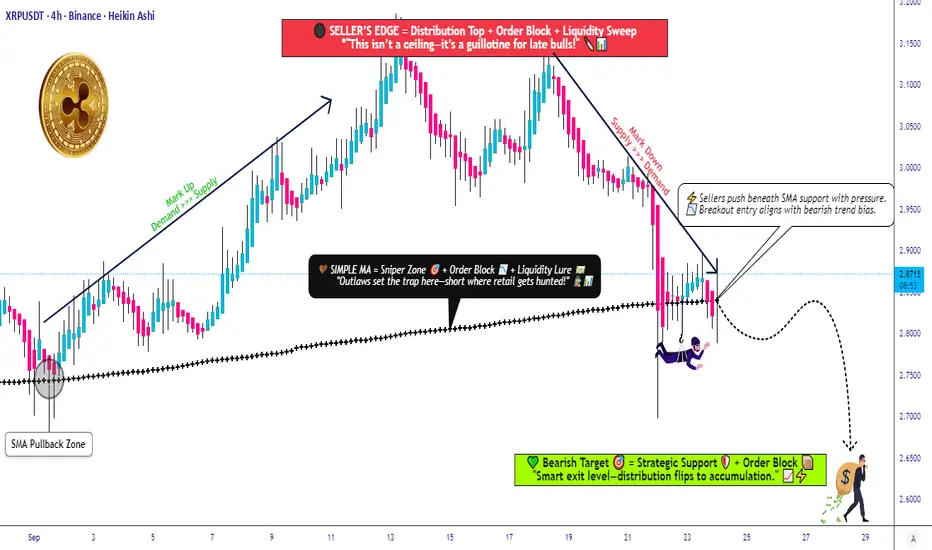
Ripple vs Tether: Key Technical Levels Every Trader Should WatchXRP/USDT | "RIPPLE vs TETHER" Market Wealth Strategy Map (Swing/Day Trade)
📊 Plan:
We’re eyeing a bearish confirmation if candles break below the 0.786 Fibonacci zone + SMA breakout @ 2.8300. At that point, sellers could gain momentum and dominate short positioning.
💡 Thief Strategy Highlight → Using a layered entry style (multiple limit orders). This method allows staggered entries rather than “all-in at once.”
🎯 Layered Short Entries (Sell Limits):
2.9300
2.9000
2.8800
2.8600
(You can expand layers based on your own strategy adjustment.)
🛑 Stop Loss (Thief SL):
Placed near 3.0000 — but ⚠️ please note: Risk management is personal. Thief OG’s — make your own choices. My SL is just an example.
✅ Target (Thief TP):
The “police barricade” (aka strong resistance zone with overbought pressure + possible trap) aligns around 2.6500. That’s where profit-taking may be wise before liquidity hunters catch us.
Again, this is flexible — adjust TP to your own risk/reward plan.
🔗 Related Pairs to Watch
$BTC/USDT → Major market leader, XRP often follows Bitcoin’s momentum.
$ETH/USDT → Correlation with altcoin sentiment; strong ETH moves ripple across XRP.
$ADA/USDT & $SOL/USDT → Competing Layer-1s, often mirror similar retail/institutional flows.
$XLM/USDT → Direct cousin of XRP, highly correlated in macro movements.
Watching these can help confirm broader market bias & correlation flows.
✨ “If you find value in my analysis, a 👍 and 🚀 boost is much appreciated — it helps me share more setups with the community!”
⚠️ Disclaimer: This is a Thief style trading strategy shared just for fun & community engagement. Not financial advice. Manage your own risk, make your own decisions.
#XRP #Ripple #CryptoTrading #SwingTrade #DayTrading #Fibonacci #TechnicalAnalysis #CryptoCommunity #TradingStrategy
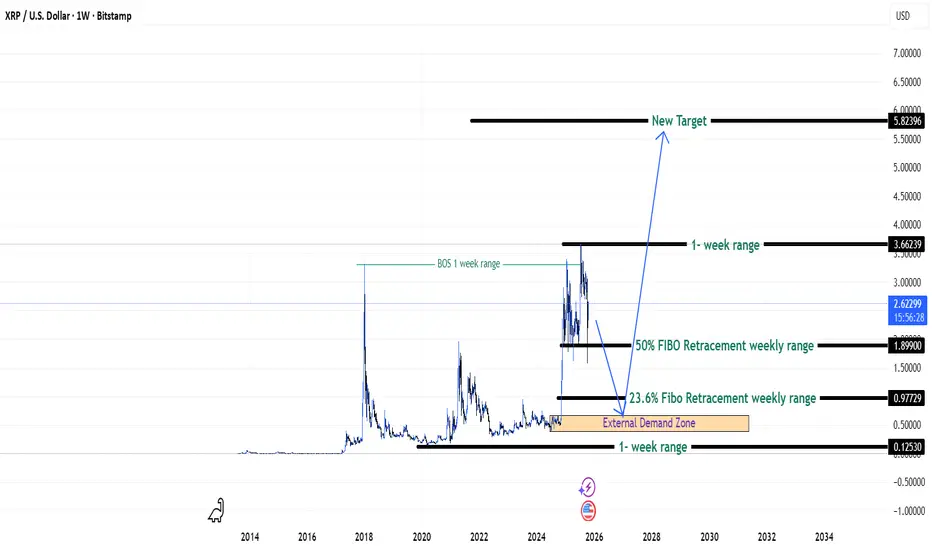
XRP Chasing New Highs - {26/10/2025}Educational Analysis says that XRPUSD or XRPUSDT (Crypto Pair) may give trend Trading opportunities from this range, according to my technical analysis.
Broker - Bitstamp
So, my analysis is based on a top-down approach from weekly to trend range to internal trend range.
So my analysis comprises of two structures: 1) Break of structure on weekly range and 2) Trading Range to fill the remaining fair value gap
Let's see what this Crypto Pair brings to the table for us in the future.
DISCLAIMER:-
This is not an entry signal. THIS IS FOR EDUCATIONAL PURPOSES ONLY.
I HAVE NO CONCERNS WITH YOUR PROFITS OR LOSS,
Happy Trading,
FX Pairs & Crypto Curreny Trade Analysis.
My Analysis is:-
Short term trend may be go to the external demand zone.
Long term trend breaks the new high after going from discount zone.
Ripple vs Tether — Can Bulls Escape the Resistance Trap?📌 TradingView Idea Description (XRP/USDT Thief Strategy)
Asset: XRP/USDT — “Ripple vs Tether”
Market: Crypto Wealth Strategy Map (Swing/Day Trade)
Bias: 🔵 Bullish Setup
🗺️ Trading Plan
Entry Style (Thief Layer Strategy):
Multiple buy-limit layered entries →
✅ 2.8000
✅ 2.8500
✅ 2.9000
✅ 2.9500
(Layers can be increased based on your own risk tolerance)
Stop Loss (Thief SL):
@ 2.7000 (personal setup — adjust as per your own risk appetite)
Target Zones:
🎯 Primary Target: 3.1500 → Key resistance zone + overbought condition + potential bull trap (take profits smartly).
🎯 Secondary Target: 3.3500 → Strong resistance cluster (“police barricade” zone) + overbought trap risk (partial/exit profits advised).
⚠️ Important Notes
👥 Dear Ladies & Gentlemen (Thief OGs):
I’m not recommending my exact stop loss or target — these are my personal levels.
Manage your own risk responsibly: “Make money, then take money at your own risk.”
This strategy is built around layered entries for flexibility in volatile markets.
🔍 Correlation & Related Pairs to Watch
Ripple (XRP) often shows sentiment correlation with broader altcoin momentum and BTC’s dominance. Key pairs worth monitoring for confirmation:
BINANCE:BTCUSDT → Bitcoin drives overall crypto market liquidity.
BINANCE:ETHUSDT → Strong ETH moves can influence Ripple flows.
BINANCE:XLMUSDT → Stellar often mirrors or diverges from XRP due to similarity in use cases.
BINANCE:ADAUSDT → Watch ADA for altcoin sentiment correlation.
Monitoring these pairs can give early signals of potential XRP strength or weakness.
✨ If you find value in my analysis, a 👍 and 🚀 boost is much appreciated — it helps me share more setups with the community!
📜 Disclaimer
This is a “Thief Style” Trading Strategy, shared for educational & entertainment purposes only.
Not financial advice. Trade responsibly — risk management is your best weapon.
#XRP #Ripple #Crypto #Altcoins #USDT #TradingStrategy #SwingTrade #DayTrade #LayeredEntries #ThiefStrategy

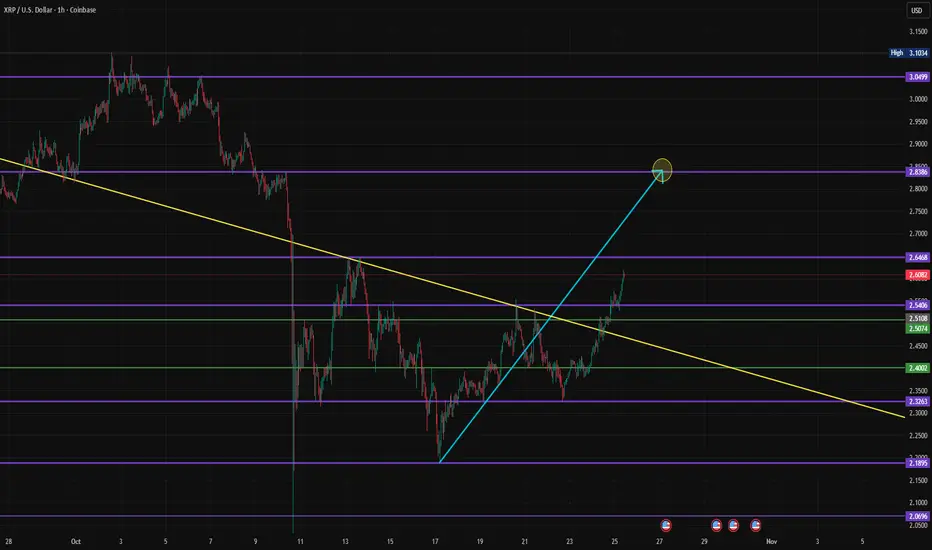
$XRPUSD - #Ripple- $2.80 RetestBITSTAMP:XRPUSD is about to break the next level of resistance - $2.54 - and has since continued its push on to $2.64 with a $2.80 Retest before we see resistance kicking in again.
More to see! @MyMIWallet
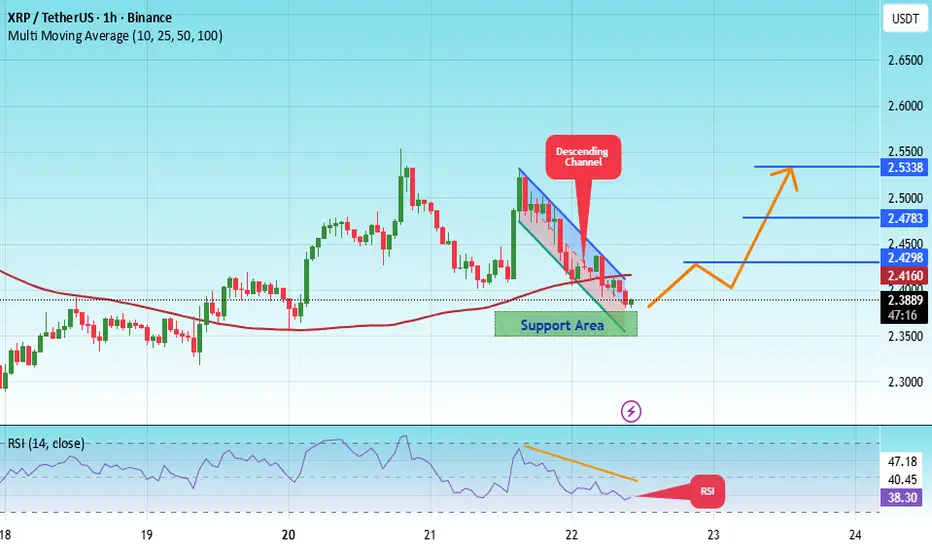
#XRP/USDT (1H) chart, here’s a full technical read:#XRP
The price is moving within a descending channel on the 1-hour frame, adhering well to it, and is heading for a strong breakout and retest.
We have a bearish trend on the RSI indicator that is about to be broken and retested, which supports the upward breakout.
There is a major support area in green at 2.36, representing a strong support point.
We are heading for consolidation above the 100 moving average.
Entry price: 2.38
First target: 2.41
Second target: 2.47
Third target: 2.53
Don't forget a simple matter: capital management.
When you reach the first target, save some money and then change your stop-loss order to an entry order.
For inquiries, please leave a comment.
Thank you.
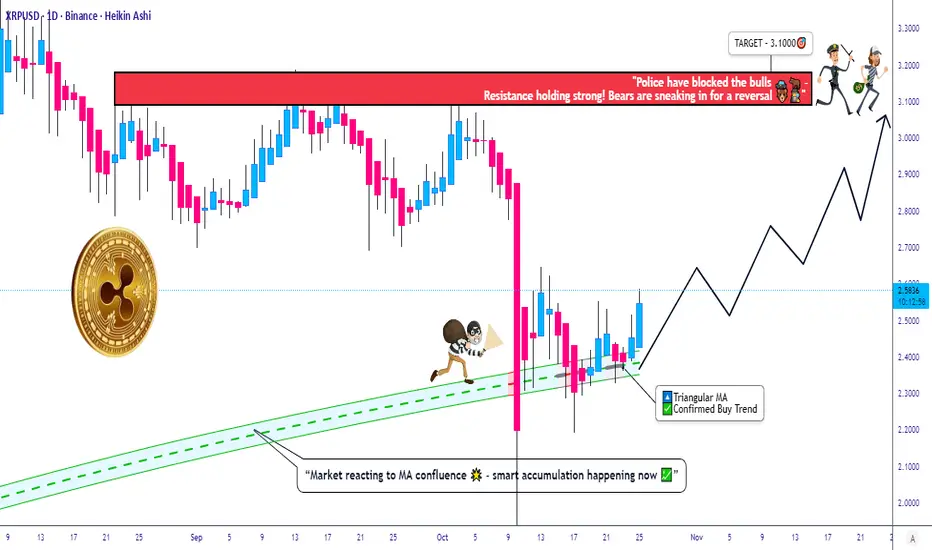
Is XRP Building for a Major Move? | Capital Flow Analysis🎯 XRP/USD: The Great Heist Setup | Swing Trade Blueprint 💰
📊 ASSET OVERVIEW
Pair: XRP/USD (Ripple vs. U.S. Dollar)
Market: Cryptocurrency
Trade Type: Swing Trade (Bullish Accumulation Play)
Chart Style: Capital Flow Blueprint with Triangular Moving Average Confirmation
🎭 THE HEIST PLAN
Ladies & Gentlemen, welcome to the ultimate Thief's Playbook! 🕵️
We've spotted a bullish accumulation pattern confirmed by our trusty Triangular Moving Average showing strong pullback support. The vault door is creaking open, and it's time to execute the perfect heist! 💎
Market Structure: XRP has been consolidating beautifully, building up energy like a coiled spring. The triangular MA convergence suggests institutional accumulation is underway. Translation? The big players are loading their bags while retail panics. Classic.
🎯 ENTRY STRATEGY: THE LAYERED HEIST
Here's where the "Thief Strategy" comes into play—we're not going all-in at once like amateurs. We're professionals. We layer our entries like a mastermind planning multiple escape routes! 🎪
Entry Method: Multiple Buy Limit Orders (Layering Strategy)
Recommended Entry Layers:
🎯 Layer 1: $2.3000 (First probe)
🎯 Layer 2: $2.4000 (Main accumulation zone)
🎯 Layer 3: $2.5000 (Final entry before liftoff)
Note: You can add more layers based on your bag size and risk appetite. The beauty of this strategy is flexibility—if price dips, you average down; if it rips, you're already in! Feel free to adjust these levels to suit your own master plan.
🛡️ STOP LOSS: THE EMERGENCY EXIT
Thief's SL: $2.2000
Listen up, OG Thieves! 👑 This is my stop loss based on technical invalidation below the accumulation zone. However, I'm NOT your financial advisor (I'm just a dude with charts and dreams). You set your own risk management. If you want to be more conservative or aggressive, that's YOUR heist to plan. Remember: scared money don't make money, but reckless money don't KEEP money! 💯
Why $2.2000? Breaking below this level invalidates the bullish structure and triangular MA support. At that point, we abort mission and live to steal another day! 🚪
💰 TAKE PROFIT: THE ESCAPE ROUTE
Primary Target: $3.1000 🚨
Here's the deal: At $3.1000, we hit what I call the "Police Barricade Zone"—a confluence of:
⚠️ Strong historical resistance
⚠️ Overbought conditions on multiple timeframes
⚠️ Potential bull trap territory
Exit Strategy: Scale out as you approach the target. Take some profits along the way! Maybe 33% at $2.8000, another 33% at $2.9500, and let the rest ride to $3.1000 with a trailing stop.
Note to Thief OG's: Again, this is my target based on technical analysis and risk/reward. You're the mastermind of your own operation! If you want to take profits earlier or swing for higher targets, that's your prerogative. Your money, your rules, your risk! 🎲
🔗 RELATED PAIRS TO WATCH (Correlation Analysis)
Keep your eyes on these accomplices—they often move together! 🕵️♂️
1. BITSTAMP:BTCUSD (Bitcoin) 📈
The godfather of crypto. When BTC pumps, altcoins like XRP usually follow. Currently hovering around all-time high zones—if BTC consolidates healthily, expect altseason momentum.
2. BITSTAMP:ETHUSD (Ethereum) ⚡
The second-in-command. ETH's strength or weakness often dictates altcoin sentiment. Watch the $2,500-$2,700 zone for continuation signals.
3. BINANCE:XRPBTC (XRP vs. Bitcoin Pair) 🔄
This tells us if XRP is outperforming or underperforming BTC. Currently showing relative strength—a bullish sign for XRP/USD longs.
4. TVC:DXY (U.S. Dollar Index) 💵
Inverse correlation alert! When DXY weakens, crypto typically strengthens. Keep an eye on the 104-106 resistance zone on DXY.
Key Correlation Point: If BTC holds structure and DXY rolls over, XRP could see explosive upside as capital rotates into high-beta altcoins. The macro backdrop matters! 🌍
🧠 KEY TECHNICAL HIGHLIGHTS
✅ Triangular MA Convergence: Bullish alignment across multiple timeframes
✅ Accumulation Zone: Smart money quietly loading between $2.30-$2.50
✅ Volume Profile: Strong support cluster in our entry zone
✅ Market Structure: Higher lows forming—textbook bullish continuation
✅ Risk/Reward: Approximately 3:1 RR ratio (solid!)
🎬 FINAL WORDS
The setup is clean, the plan is laid out, and the vault is waiting. Will XRP execute the perfect heist to $3.10? Only time will tell! Remember: patience beats panic, and risk management beats revenge trading!
Stay sharp, stay disciplined, and may the charts be ever in your favor! 🎰
✨ If you find value in my analysis, a 👍 and 🚀 boost is much appreciated — it helps me share more setups with the community!
#XRP #XRPUSD #Ripple #CryptoTrading #SwingTrade #TechnicalAnalysis #CryptoSetup #Altcoins #BullishSetup #ThiefStrategy #LayeredEntry #RiskManagement #CryptoSignals #TradingView #ChartAnalysis #XRPArmy #CryptoTA #SwingTrading #PriceAction #SupportAndResistance
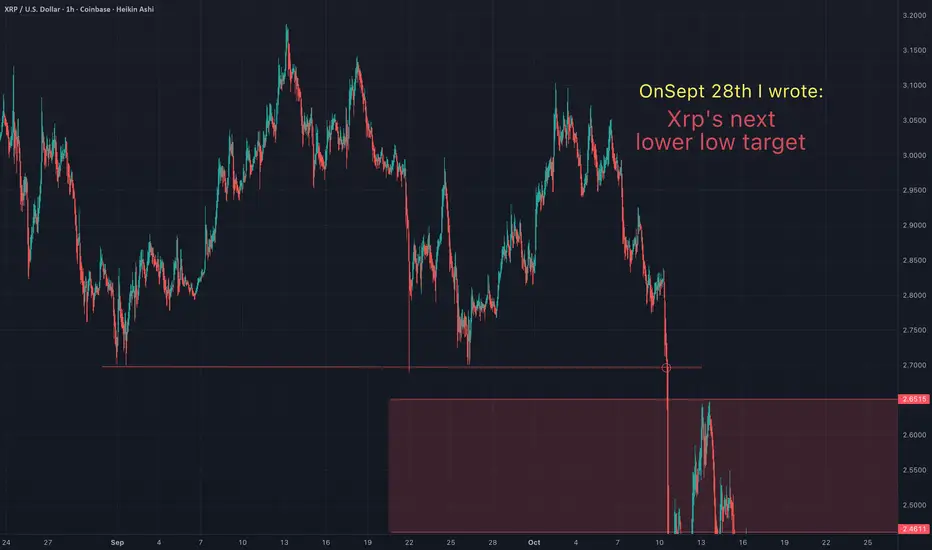
You will ask yourself "how did he know Xrp would do that"?On Sept 28th I suggested that Xrp was headed for a lower low. Congrats to all of you that took that trade and are in profit. The "3 Red Week Down Rule" played out as anticipated. TA works!
May the trends be with you.
Xrp - This chart is only bullish!💰Xrp ( CRYPTO:XRPUSD ) is pointing higher:
🔎Analysis summary:
Yes, Xrp has been consolidating for the entire year of 2025. But looking at obvious market structure, Xrp is preparing for another move higher. And even if we see a -50% correction, the path of least resistance remains towards the upside. This bullrun is clearly not over.
📝Levels to watch:
$2,0, $3,0
SwingTraderPhil
SwingTrading.Simplified. | Investing.Simplified. | #LONGTERMVISION

$XRP Gearing for $5 Move The price of CRYPTOCAP:XRP is down 0.21% today however, should the asset break the ceiling of the symmetrical triangle, the $5 resistant seems feasible with investors and VC's migrating to utility tokens positioning for the so-called "Uptober".
Albeit all the bullish thesis, the Open Interest of CRYPTOCAP:XRP on all exchanges is down 2.15% losing roughly $1.3B.

DeGRAM | XRPUSD protected the support line📊 Technical Analysis
● XRP/USD defended the 2.35 support zone after a false breakdown, forming a base along dynamic support. The price structure suggests consolidation within a minor channel, preparing for a potential rebound.
● A break above 2.65 would confirm bullish continuation toward 2.85–3.00, aligning with the dynamic resistance zone.
💡 Fundamental Analysis
● Ripple sentiment improves as market optimism returns following SEC-related clarity and rising transaction volumes.
✨ Summary
● Long bias above 2.35; targets 2.85–3.00. Technical base formation and renewed market confidence support medium-term recovery.
-------------------
Share your opinion in the comments and support the idea with a like. Thanks for your support!

XRP Selling Hits 3 Year High As Whales Dump $5 Billion In 4 DaysAt the time of writing, XRP trades at $2.44, hovering just below the $2.45 support level. If bearish momentum persists and investor confidence weakens further, the altcoin could slide to $2.35 or even $2.27 in the coming days.
This would make recovery increasingly challenging for XRP, which needs to climb back toward $2.85 to reclaim its recent losses. Sustained selling activity, particularly from large holders, could delay this process and push prices lower.
However, if selling pressure eases and investors begin accumulating once again, XRP could rebound. A push above $2.54 and $2.64 could pave the way toward $2.75, signaling renewed market optimism and invalidating the bearish outlook.

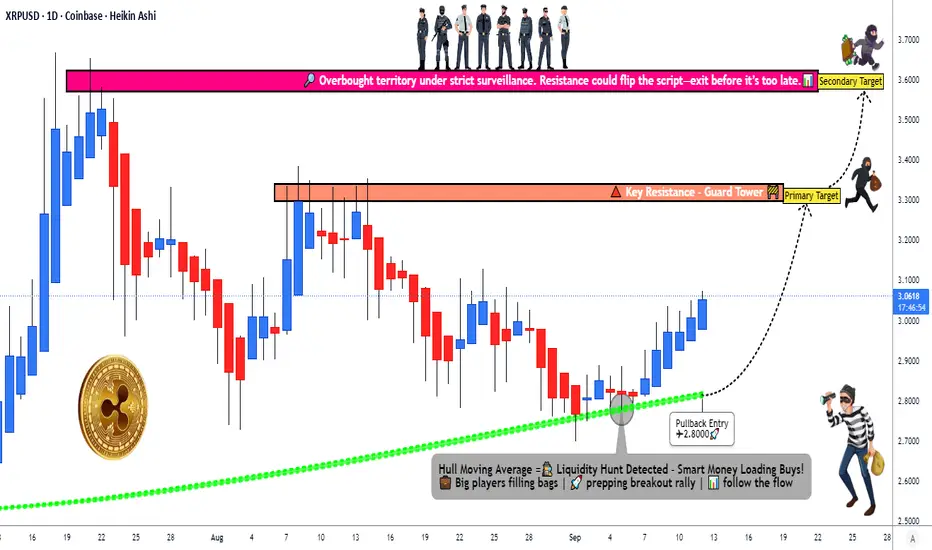
XRP/USD Analysis | Smart Entry, Risk, and Exit Plan🚨 XRP/USD: The Great Crypto Heist Plan (Swing/Day Trade) 🤑💰
Asset: XRP/USD (Ripple vs. U.S. Dollar)
Vibe: Bullish Bandit Mode
😎Plan: Steal the profits with a slick swing/day trade setup using the Thief Layering Strategy! The Hull Moving Average (HMA) is flashing green 📈, signaling a buy trend, and institutional players are sneaking in. Time to execute the heist! 🕵️♂️
📜 The Heist Plan: Key Details
🎯 Entry (The Sneaky Break-In):Deploy the Thief Layering Strategy with multiple buy limit orders to maximize your loot:
🪜 Layer 1: $2.9000
🪜 Layer 2: $2.9500
🪜 Layer 3: $3.0000
🪜 Layer 4: $3.0500
Pro Tip: Stack more layers based on your risk appetite and market conditions. Be the slickest thief in the crypto game! 😏
🛑 Stop Loss (The Getaway Car):Set your escape plan at $2.8000 after the breakout confirms. Dear Ladies & Gentlemen (Thief OGs), tweak your SL based on your strategy and risk tolerance. This is your heist, so protect your loot! 🚗💨
Note: I’m not your financial consigliere—set your SL wisely to avoid getting caught! ⚠️
🎉 Targets (The Big Score):Watch out for the police barricade (resistance + overbought zones + traps)! 🕴️
💰 Primary Target: $3.3000 — Grab your profits and slip away.
💎 Secondary Target: $3.6000 — For the bold thieves aiming for the jackpot!
Note: Don’t get greedy, Thief OGs! These are my suggested TPs, but take profits at your own risk and style. 💸
🔍 Related Pairs to Watch 👀
📊 BTC/USD: Bitcoin often leads the crypto market. If BTC pumps, XRP might follow the bullish vibe.
🦄 ETH/USD: Ethereum’s moves can influence altcoins like XRP. Watch for similar bullish signals.
🧩 ADA/USD: Cardano’s price action often correlates with XRP due to similar market dynamics.
Why Watch These?These pairs can act as your lookout crew. If BTC or ETH shows strength, it could boost XRP’s breakout potential. Conversely, if they tank, be ready to pivot your getaway plan! 🚨
🧠 Key Points & Correlations
📈 Hull Moving Average (HMA): The HMA is our trusty lookout, confirming the bullish trend with its smooth, low-lag signals.
💼 Institutional Flow: Big players are entering, adding fuel to XRP’s upward momentum. Follow the smart money!
🌊 Market Correlation: XRP often dances in sync with BTC and ETH. A rising tide in crypto could lift XRP to our targets faster.
⚖️ Risk Management: The Thief Layering Strategy spreads your entries to reduce risk, but always adjust SL/TP based on your own heist style.
🚨 Risk Disclaimer
Dear Thief OGs, this is a high-stakes crypto heist! I’m sharing my setup, but you’re the mastermind of your trades. Set your SL and TP based on your risk tolerance, and never bet the farm. Trade smart, stay sharp, and escape with profits! 😎
✨ “If you find value in my analysis, a 👍 and 🚀 boost is much appreciated — it helps me share more setups with the community!”
#XRPUSD #CryptoTrading #SwingTrading #DayTrading #ThiefStrategy #Bullish
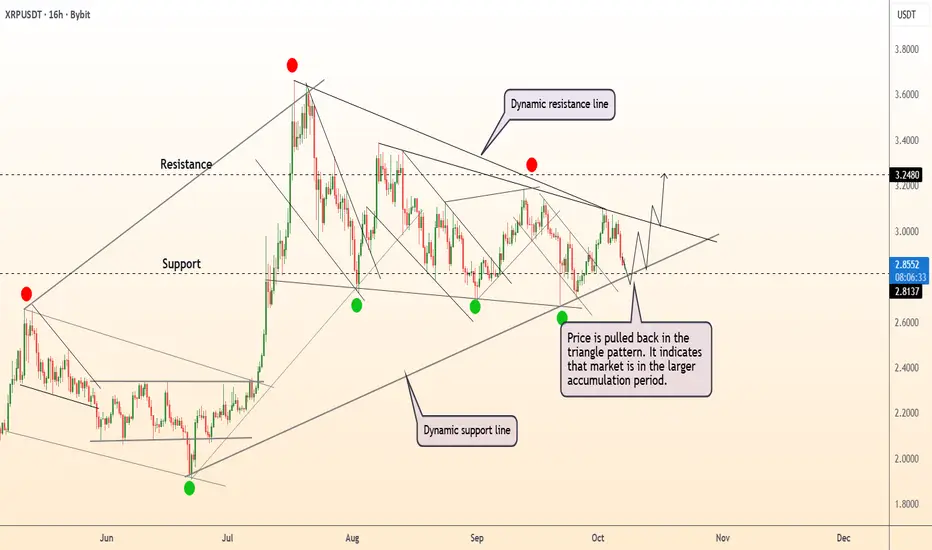
DeGRAM | XRPUSD is testing the support level📊 Technical Analysis
● XRP/USD is consolidating within a symmetrical triangle, showing a sequence of higher lows near the dynamic support line — a sign of steady accumulation. A breakout above $2.85–$2.90 would confirm bullish continuation toward the $3.25 resistance.
● The overall structure indicates a contracting phase within a larger bullish setup, with price respecting the long-term rising trendline since May.
💡 Fundamental Analysis
● Ripple’s ongoing expansion into cross-border settlements and improving market sentiment for altcoins support accumulation before potential breakout.
✨ Summary
● Accumulation inside triangle; breakout above $2.90 could target $3.25. Structure and fundamentals favor mid-term bullish momentum.
-------------------
Share your opinion in the comments and support the idea with a like. Thanks for your support!
#XRP/USDT looking extremely bullish#XRP
The price is moving within a descending channel on the 1-hour frame, adhering well to it, and is heading for a strong breakout and retest.
We have a bearish trend on the RSI indicator that is about to be broken and retested, which supports the upward breakout.
There is a major support area in green at 2.93, representing a strong support point.
We are heading for consolidation above the 100 moving average.
Entry price: 2.96
First target: 3.02
Second target: 3.06
Third target: 3.10
Don't forget a simple matter: capital management.
When you reach the first target, save some money and then change your stop-loss order to an entry order.
For inquiries, please leave a comment.
Thank you.

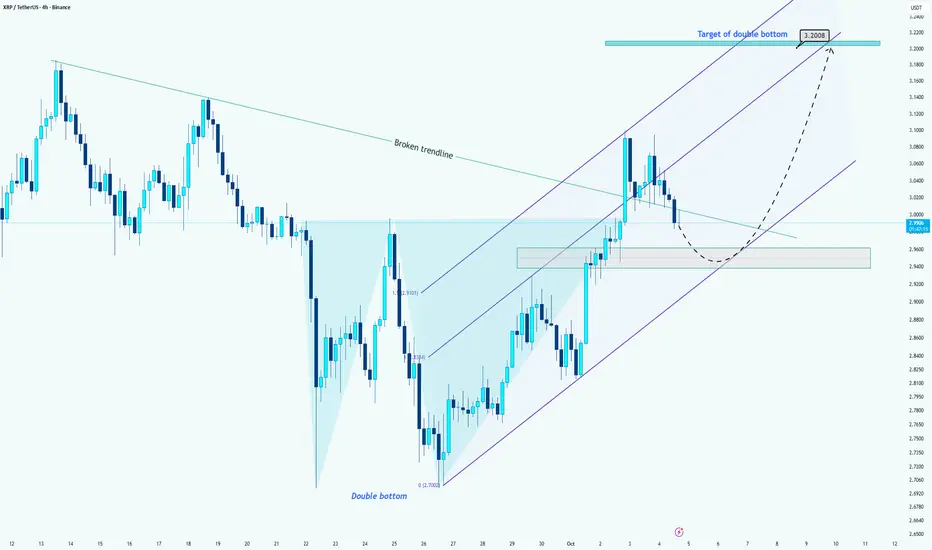
XRP/USDT –> Double Bottom Formation Confirmed!Hi guys!
After breaking above the descending trendline, XRP has confirmed a double bottom pattern around the 2.70 area.
Currently, the price is moving inside an ascending channel, but after facing resistance near 3.10, it has entered a correction phase. The 2.94–2.96 area now acts as a key support zone, aligning with both the previous neckline and the channel’s midline.
If this support holds, we can expect the price to bounce upward and resume its bullish momentum toward the 3.20 area, which represents the target of the double bottom.
However, if the 2.94 support breaks down, we might see a deeper correction toward the lower channel boundary before any continuation move.
🎯 Targets:
First target: 3.20 USDT (double bottom projection)
Extended target: 3.30 USDT (upper channel resistance)
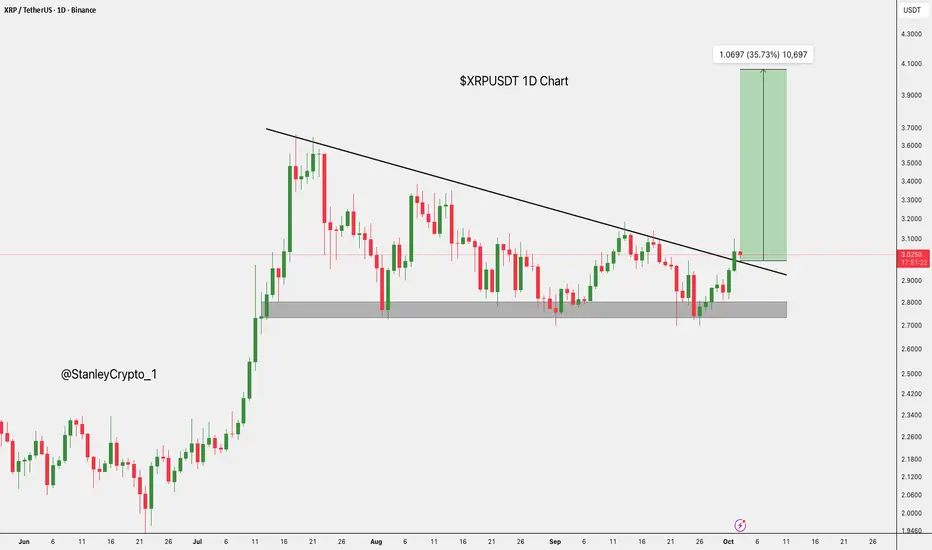
$XRP Breaks Out: 35% Upside Potential Ahead.CRYPTOCAP:XRP has broken above the downtrend, with strong support between $2.70 and $2.85.
If the breakout holds, it could target $4.10, a 35% upside.
Watch for a retest of the breakout zone to confirm further gains.
DYOR, NFA
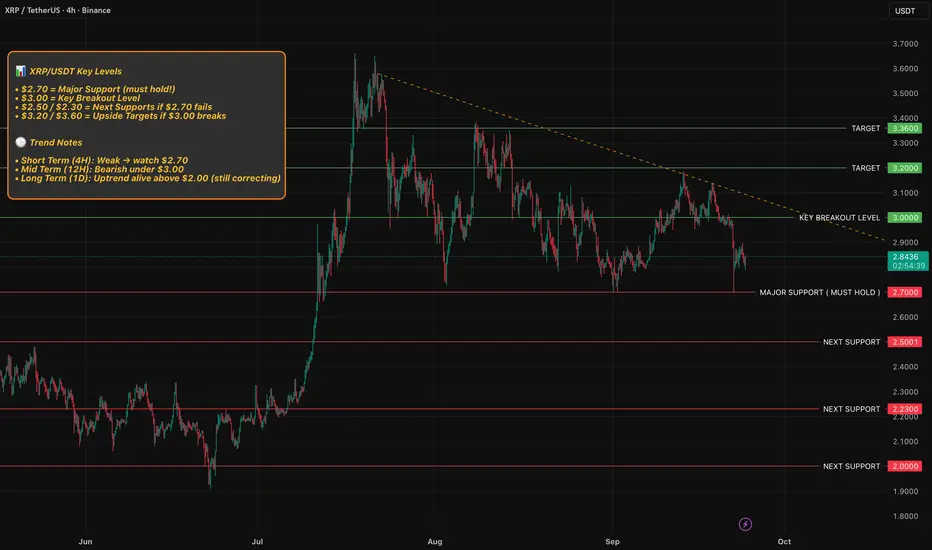
XRP is at a MAJOR decision point !
📊 XRP/USDT Key Levels
• $2.70 = Major Support (must hold!)
• $3.00 = Key Breakout Level
• $2.50 / $2.30 = Next Supports if $2.70 fails
• $3.20 / $3.60 = Upside Targets if $3.00 breaks
🕒 Trend Notes
• Short Term (4H): Weak → watch $2.70
• Mid Term (12H): Bearish under $3.00
• Long Term (1D): Uptrend alive above $2.00 (still correcting)
Thank you for reading my idea, let me know your thoughts and please support by leaving a simple comment as this helps me stay motivated and keep going.
XRP Intraday long IdeaJournal Entry #8
The chart has shown a bullish divergence and currently at its breakup/down point.
im looking for opportunities to long :)
hello UPtober?

BUY AND HOLDHello friends
You see that after the good rise we had, the price has entered a correction and it is a good opportunity to buy in a stepwise manner in the price correction with capital and risk management and move with it to the specified goals.
Ripple is a currency whose holders have a good expertise in disappointing short-term traders.
Note that the holding period is at least 3 months, so be patient and observe capital management.
*Trade safely with us*

XRP ETF Approved, But Price Hurts—Will Big Players Act?At the time of writing, XRP trades at $2.84, just under the $2.85 resistance. A flip of this barrier into support would likely signal the beginning of a reversal, strengthening bullish sentiment. Traders are closely watching this zone for confirmation.
If support from LTHs holds, XRP could climb toward $2.94 in the short term. Breaching this level would pave the way for a further rise to $3.02, signaling broader recovery potential and invalidating near-term bearish concerns.
However, if market conditions worsen or LTHs shift their strategy to selling, XRP could lose momentum. The altcoin risks sliding toward $2.75 or even deeper to $2.64, putting bullish expectations in jeopardy and prolonging the consolidation phase.
