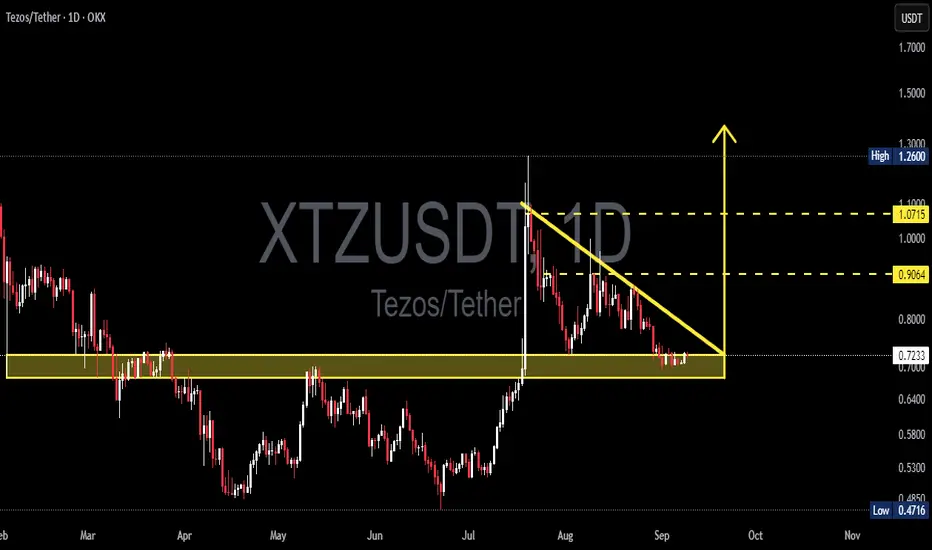
XTZ/USDT — Descending Triangle at a Critical Zone!Tezos (XTZ/USDT) is currently trading at a decision point. The chart shows a clear Descending Triangle pattern formed since late August, with price consolidating right above the major support zone at 0.64 – 0.74 USDT.
This structure is generally considered bearish, as consistent lower highs indicate selling pressure against a static demand zone. However, a confirmed breakout above the downtrend line could flip the pattern into a bullish reversal trigger.
---
🔑 Key Levels
Current Price: 0.7234 USDT
Major Support Zone: 0.64 – 0.74 USDT
Dynamic Resistance (downtrend line): ~0.78 – 0.82 USDT
Bullish Targets: 0.9064 → 1.0715 → 1.2600 USDT
Bearish Targets: 0.4716 (previous low), with a potential measured move down to ~0.37 USDT
---
🐂 Bullish Scenario (Reversal Potential)
Breakout above 0.78 – 0.82 with strong volume confirmation signals a bullish reversal.
First upside target at 0.9064, then 1.0715, and potentially 1.2600 if momentum continues.
Strategy: Buy on breakout or take aggressive entries near support with tight stops below 0.64.
Reward-to-Risk (R:R) ratio ≈ 2:1 if targeting 0.90.
---
🐻 Bearish Scenario (Breakdown Risk)
Breakdown below 0.64 – 0.70 with strong volume would confirm the descending triangle as bearish.
Downside targets: 0.4716 (structural support) and potentially 0.37 USDT (measured move).
Strategy: Short/hedge after confirmed breakdown and failed retest.
Potential R:R > 2.4:1 toward 0.37.
---
📌 Pattern Context
The Descending Triangle reflects market indecision: persistent sellers vs. defending buyers.
Such setups often end with a strong move, making this area a crucial inflection zone.
Volume will be the key confirmation factor — without it, false breakouts are highly likely.
XTZ is essentially in a “wait-and-see” equilibrium before its next decisive trend.
---
⚖️ Conclusion
XTZ is standing at a major turning point:
Bullish case: breakout could lift price toward 0.90 – 1.07.
Bearish case: breakdown may trigger a drop to 0.47 – 0.37.
Traders should wait for a daily close + volume confirmation before committing. This is a high-opportunity setup once direction is confirmed.
---
#XTZ #Tezos #XTZUSDT #Crypto #Altcoins #TechnicalAnalysis #PriceAction #ChartPatterns #SwingTrading
Xtzusdtsignal
XTZUSDT Fibonacci Retest and Rebound Potential: Is Tezos Ready?Detailed Analysis of XTZ/USDT Chart (Daily Timeframe):
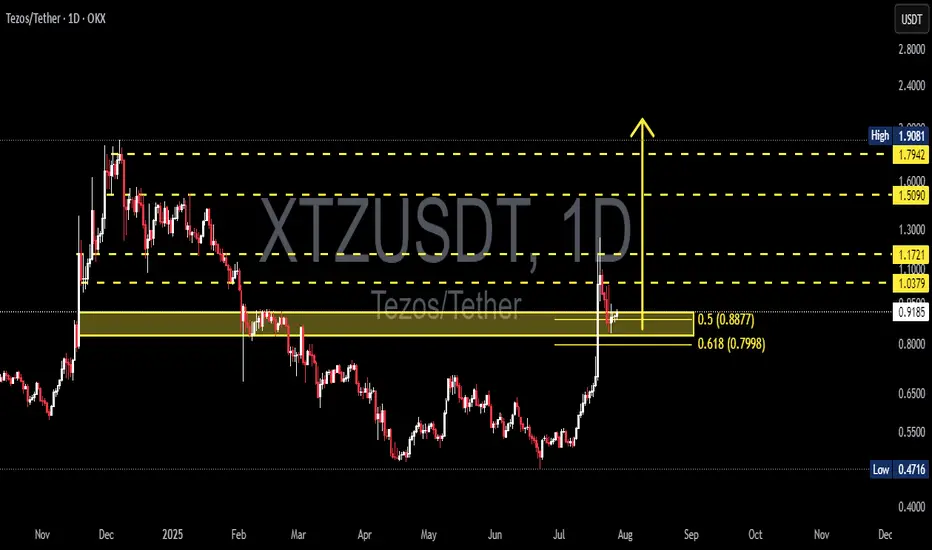
The XTZUSDT pair (Tezos vs USDT) has shown strong momentum following a breakout above previous support zones, with a sharp rally toward $1.17 before retracing.
Currently, the price is testing the Fibonacci Retracement levels, specifically the 0.5 ($0.8877) and 0.618 ($0.7998) zones — which also align with a key previous demand zone. This zone is critical for determining the next directional move.
---
🟢 Bullish Scenario:
If the price holds above the $0.80–$0.88 zone (Fibonacci support area), this could confirm a valid breakout retest.
Potential upside targets include:
$1.0379 (minor resistance)
$1.1721 (recent local high)
Further targets: $1.5090 – $1.7942, and potentially the major high at $1.9081.
This structure may form a bullish continuation pattern, especially if supported by volume.
---
🔴 Bearish Scenario:
A breakdown below $0.7998 may trigger further selling pressure toward $0.70 – $0.65.
A deeper retracement could take price back into the previous accumulation zone between $0.55 – $0.50.
Failure to hold the Fibonacci levels may confirm a bull trap, invalidating the recent breakout.
---
📌 Pattern Insights:
The current price action resembles a Bullish Flag / Retest Structure.
The 0.5–0.618 Fibonacci levels serve as a key confluence area for potential trend continuation.
This is a common setup before a major upside move — if the support holds.
---
Conclusion: XTZ is at a decisive moment. As long as the price stays above $0.80, the bullish trend remains intact. However, a drop below could shift momentum back to the bears. Traders should watch this zone closely for confirmation.
#XTZUSDT #Tezos #CryptoAnalysis #AltcoinSeason #FibonacciRetracement #BreakoutRetest #TechnicalAnalysis #CryptoTrading #BullishScenario #BearishScenario
XTZ/USDT Ready for a Massive Breakout After Prolonged Downtrend!Technical Analysis (1D Timeframe):
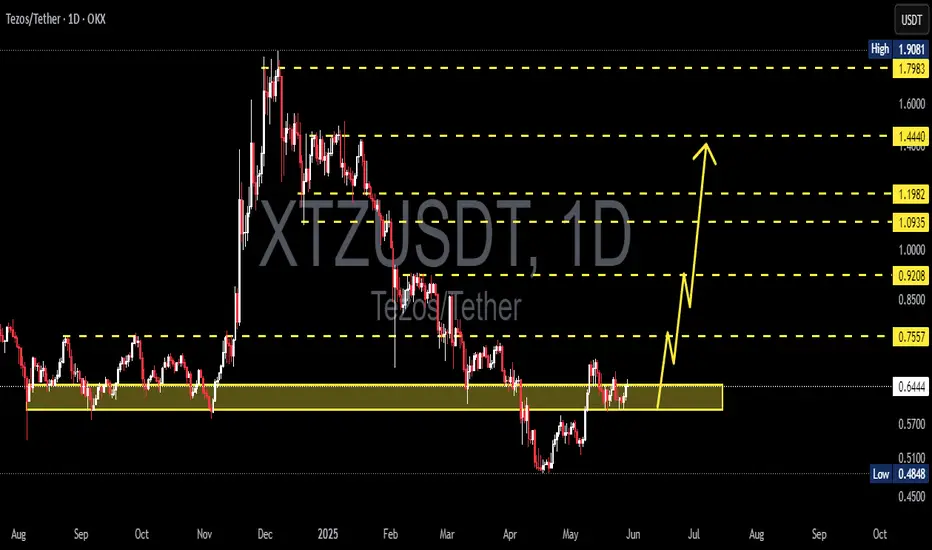
The XTZ/USDT pair is forming a well-defined descending triangle pattern, with sustained selling pressure since late 2024. However, the price action is now signaling a potential breakout as it approaches the apex of the triangle, supported by a strong accumulation zone around $0.4720–$0.5247.
🔍 Analysis Details:
Descending Trendline Resistance: Price has repeatedly failed to break above the descending resistance line since December 2024. It is now testing the edge of the triangle, which typically precedes a significant breakout.
Strong Support Zone: The consolidation zone between $0.4720 and $0.5247 has acted as a key accumulation area, successfully holding off bearish momentum.
Potential Breakout: A breakout above the triangle resistance, especially with confirmation above $0.5797, could trigger a strong bullish rally toward the next resistance levels.
🎯 Target Resistances (Upon Confirmed Breakout):
1. $0.5797 – Initial breakout confirmation
2. $0.6326 – Minor resistance
3. $0.7281 – Significant resistance from previous structure
4. $0.9145 – Medium-term bullish target
5. $1.0445 – Strong resistance zone
6. $1.2022 – Final breakout target
⚠️ Note:
A valid breakout requires a daily candle close above the descending trendline, ideally supported by volume confirmation. A pullback to the breakout zone may occur and could offer a second entry opportunity.
#XTZ #Tezos #XTZUSDT #CryptoBreakout #DescendingTriangle #AltcoinAnalysis #TechnicalAnalysis #CryptoSignals #TrendReversal #BullishSetup

XTZUSDT 1D AnalysisXTZ ~ 1D Analysis
#XTZ Buy gradually from here if you still have confidence in this coin with a short term target of at least 10%+ and long term $2+
XTZUSDT 1D AnalysisXTZ ~ 1D Analysis
#XTZ Buy after successfully penetrating this resistant line with a short -term target of at least 10%+.

XTZUSDT 1WXTZ ~ 1W Analysis
#XTZ Buy gradually from here with a short -term target of at least 20%+
Reason, This is the lowest support for now which is continuously maintained.

XTZUSDT 1WXTZ ~ 1W Analysis
#XTZ This is the lowest support block for now. buy gradually from here with a minimum target of 20%+

XTZUSDT 1WXTZ Update ~ 1W
#XTZ Still maintains its Bullish structure from here. Buy in stages from here. With a target of at least 20%+ from here.

XTZUSDTXTZ ~ 1W
#XTZ Do you still have Conviction on this coin? If yes, this support Block would be a very good buy for now. at least for 20%++

XTZUSDTXTZ ~ 1W
#XTZ Do you have Conviction on this Coin , If yes, this is the right time to start accumulating here. at least for the short term at least 20%+

XTZUSDT 1WXTZ ~ 1W
#XTZ We expect a double bottom from this and a short term rise of at least 20%+, Or if this fails, COINBASE:XTZUSD will bottom further.

profit limit around 1.0755. base of unconfirmed pattern at dailyThere are several famous currencies, one of them is full of secrets.
In the daily time, considering that it could not confirmed some pattern, so in this time, it will move towards the ascendant and around tenken Sen, so that Ichimoku will determine the task. But the attraction is that we have a correction in the wake of the rising wave, which will be the profit limit around 1.0755 at 4H time.

XTZUSDT Analysis (LOCAL VISION)Hello friends.
Please support my work by clicking the LIKE button👍(If you liked). Also i will appreciate for ur activity. Thank you!
Everything on the chart.
Entry: market and lower
Target zone: 1.8 - 2
after first target reached move ur stop to breakeven
Stop: ~1.2 (depending of ur risk). ALWAYS follow ur RM .
Risk/Reward: 1 to 3
risk is justified
Good luck everyone!
Follow me on TRADINGView, if you don't want to miss my next analysis or signals.
It's not financial advice.
Dont Forget, always make your own research before to trade my ideas!
Open to any questions and suggestions.

XTZUSDT Analysis (LOCAL VISION)Hello friends.
Please support my work by clicking the LIKE button👍(If you liked). Also i will appreciate for ur activity. Thank you!
Everything on the chart.
Entry: market and lower
Target: 2 - 2.2 - 2.4
after first target reached move ur stop to breakeven
Stop: ~1.35 (depending of ur risk). ALWAYS follow ur RM .
Risk/Reward: 1 to 3
risk is justified
Good luck everyone!
Follow me on TRADINGView, if you don't want to miss my next analysis or signals.
It's not financial advice.
Dont Forget, always make your own research before to trade my ideas!
Open to any questions and suggestions.

XTZ/USDT TRADE SETUP! READY TO PUMP 150% LONGHi guys, This is CryptoMojo, One of the most active trading view authors and fastest-growing communities.
Do consider following me for the latest updates and Long /Short calls on almost every exchange.
I post short mid and long-term trade setups too.
Let’s get to the chart!
I have tried my best to bring the best possible outcome in this chart, Do not consider it as financial advice.
IOST is about to breaking out from a descending triangle in daily time frame.
Entry range:- $3.5 to $3.4
SL:- $2.7
This chart is likely to help you in making better trade decisions, if it did do consider upvoting this chart.
Would also love to know your charts and views in the comment section.
Thank you

XTZUSDT Analysis (LOCAL VISION)Hello friends.
Please support my work by clicking the LIKE button👍(If you liked). Also i will appreciate for ur activity. Thank you!
Everything on the chart.
Since we have received a beautiful upward impulse and are now in a correction to it, there is no doubt that we will update the local top.
2 options on the chart, I tend more towards the yellow option, but if bitcoin shows a complication with the 40k test, then xtz will also adjust to the ~3.5$ and only then will show growth.
Entry: market and lower
Target: 4.5 - 4.9 - 5.3
Stop: (depending of ur risk). ALWAYS follow ur RM .
risk is justified
Good luck everyone!
Follow me on TRADINGView, if you don't want to miss my next analysis or signals.
It's not financial advice.
Dont Forget, always make your own research before to trade my ideas!
Open to any questions and suggestions.

XTZUSDT Analysis (LOCAL VISION)Hello friends.
Please support my work by clicking the LIKE button👍(If you liked).Thank you!
Everything on the chart.
Nothing has changed from my last idea.
Entry: market and lower
Target: 6.4 and 7.4
after first target reached move ur stop to breakeven
Stop: ~3.7(depending of ur risk). ALWAYS follow ur RM .
Risk/Reward: 1 to 3
risk is justified
Good luck everyone!
Follow me on TRADINGView, if you don't want to miss my next analysis or signals.
It's not financial advice.
Dont Forget, always make your own research before to trade my ideas!
Open to any questions and suggestions.

XTZUSDT AnalysisHello friends.
Please support my work by clicking the LIKE button(If you liked).Thank you!
Everything on the chart.
open pos: market and lower
target: 6.4 and 7.4
after first target reached move ur stop to breakeven
stop: under 4(depending of ur risk). ALWAYS follow ur RM .
riwk/reward: 1 to 3
risk is justified
Good luck everyone!
Follow me on TRADINGView, if you don't want to miss my next analysis or signals.
It's not financial advice.
Dont Forget, always make your own research before to trade my ideas!

XTZUSDT AnalysisHello friends.
Please support my work by clicking the LIKE button(If you liked).Thank you!
Everything on the chart.
open pos: market and lower
target: 7.5 - 9.5 - 11.5
after first target reached move ur stop to breakeven
stop: ~im w/o stop (depending of ur risk). ALWAYS follow ur RM .
risk/reward 1 to 5
risk is justified
Good luck everyone!
Follow me on TRADINGView, if you don't want to miss my next analysis or signals.
It's not financial advice.
Dont Forget, always make your own research before to trade my ideas!
Open to your questions or suggestions.

XTZXTZ (USDT)
buy at the green line
and take your profit at TP (18%)
stop lose : if the candle closes under red line
Good luck .........

XTZUSDT AnalysisHello friends.
Please support my work by clicking the LIKE button(If you liked).Thank you!
Everything on the chart.
open pos: market and lower
target: 8 - 9.5 - 11
after first target reached move ur stop to breakeven
stop: ~5(depending of ur risk). ALWAYS follow ur RM .
risk/reward 1 to 3
Good luck everyone!
Follow me on TRADINGView, if you don't want to miss my next analysis or signals.
It's not financial advice.
Dont Forget, always make your own research before to trade my ideas!
Will be very APPRECIATE FOR UR DONAT/coins :)
Open to your questions or suggestions(Looking for investors!).

XTZUSDT AnalysisHello friends.
Please support my work by clicking the LIKE button(If you liked).Thank you!
Everything on the chart.
open pos: 7.5-7.9
target: 9.3 - 10.4 - 11.5
after first target reached move ur stop to breakeven
stop: ~6.1 (depending of ur risk). ALWAYS follow ur RM .
risk/reward 1 to 2
Good luck everyone!
Follow me on TRADINGView, if you don't want to miss my next analysis or signals.
It's not financial advice.
Dont Forget, always make your own research before to trade my ideas!
Will be very appreciate for ur donat/coins :)
Open to your questions or suggestions(Looking for investors!).

