ZEC peakedZcash had a very good run but all good times come to an end.
It is breaking down. I dont want to be a buyer here or even higher.
All Info in the Chart.
No trading advice - my opinion
Zec

ZECUSDT – Bullish Flag Pattern: Consolidation Before Breakout?Overview
After a powerful rally that pushed ZEC from around $100 to nearly $300, the market has entered a healthy consolidation phase — forming a clean Bullish Flag Pattern on the 4H timeframe.
This pattern often represents a pause within a strong uptrend, where smart money accumulates positions quietly before the next major breakout.
As long as price remains within this downward-sloping channel (yellow zone), the structure still reflects controlled consolidation inside a broader bullish context.
---
Pattern Identification
Primary Pattern: Bullish Flag
Characteristics: A downward-sloping parallel channel following a sharp upward impulse
Technical Implication: Typically signals a continuation pattern, suggesting that the uptrend is not yet over
Confirmation: A 4H candle close above the upper boundary of the flag, supported by rising volume
---
Key Technical Levels
Upper Flag Resistance: $289 – $298
→ A breakout and 4H close above this zone confirms bullish continuation
Mid-Zone Support: $271
→ Serves as a balance level within the consolidation range
Lower Flag Support: $261
→ Acts as invalidation for the flag; a breakdown below could trigger short-term correction
---
Bullish Scenario
If ZEC breaks out above the flag and closes firmly above $298, the next leg of the rally could begin.
Confirmation: 4H close > $298 with strong bullish volume
Target 1: $320 – $340
Target 2 (Measured Move): $480 – $490, based on the length of the previous flagpole
Invalidation: 4H close back below $261
💡 Bullish Flags often lead to explosive continuation moves — once confirmed, momentum can accelerate rapidly.
---
Bearish Scenario
If price fails to hold support and breaks down below $261, it could shift into a short-term correction phase.
Confirmation: 4H close < $261
Target 1: $220 (previous demand area)
Target 2: $190
Invalidation: Close back above $289 cancels the bearish bias
---
Conclusion
ZEC is currently in a calm but critical stage — consolidating after a major impulse, with a textbook Bullish Flag forming at the top of the move.
A confirmed breakout above $289 – $298 would strongly suggest that the next bullish leg is about to unfold.
Patience and confirmation are key: true breakouts are often preceded by quiet compression like this one.
---
#ZEC #ZECUSDT #BullishFlag #CryptoAnalysis #TechnicalAnalysis #ZECBreakout #PriceAction #CryptoTrading #MarketStructure #SwingTrade #ChartPattern

ZEC: intraday tradingWithin a day, you can trade from local zones. The indicator shows the direction of priority trades well.

Further market dynamicsTo date, the market has fully fulfilled its targets at the 3500 retest against the background of brent leaving below 64. Further, until the second half of Sunday, the probability of purchases up to the 4500 retest prevails. An important guideline for further dynamics will be the opening level of the new week and the second half of the month. If these periods open at least above 4,100, the probability of a flat and maintaining the market with the possibility of a breakout next month will remain. With weak purchase dynamics, there is a chance of opening the second half of the month below 4,100. In this case, in any case, we will see purchases before the end of the month for a pullback on the monthly candle, but then the market will consolidate around 3500. The available technical signals currently outweigh the bullish scenario. In this case, individual coins will turn the current month into a bullish one with significant interruptions.
The main contenders for this month's move are MITO VIC BMT HOOK, which are highly unlikely to be contenders for the monitoring tag and are more suitable for medium-term investments. It is also possible to consider scalping in the short term CHESS FIO COS QUICK DATA, which have reached supports and can show a deeper drawdown only when the ether falls below 3500. A signal has been left for a move to the ADX, however, there is a possibility of a deeper drawdown to 0.075-85 before the reversal.

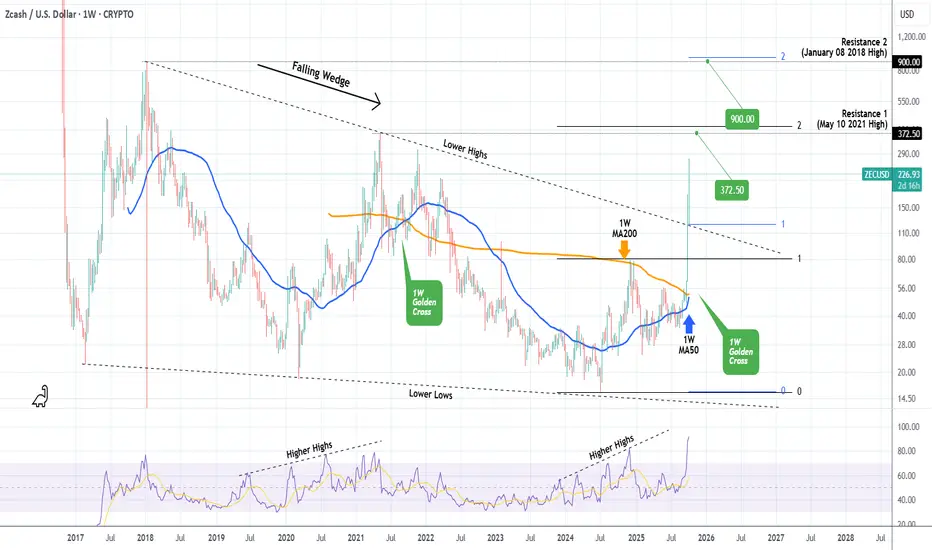
ZCASH Eyes $372.50 but might surprise us with an even higher TopZcash (ZECUSD) has been essentially trading within a multi-year Falling Wedge since the February 20 2017 Low, which effectively broke last week. This week continued equally impressively with the price currently at $239, having increased by almost +1000% since the February 2025 Low.
This Falling Wedge bullish break-out it technically targeting the 2.0 Fibonacci extension from the December 02 202 High. This falls marginally above the $372.50 Resistance (1), which is the May 10 2021 High of the previous Cycle. We expect this to get hit soon and most likely price the Top of the current Bull Cycle.
However, there is an optimistic scenario, which may push the Cycle Top to Resistance 2 (January 08 2018 High, the top of the first Cycle) at $900, which is the 2.0 Fibonacci extension (blue levels) from the Falling Wedge's break-out point. But that is assuming ZEC closes a full 1W candle above Resistance 1.
-------------------------------------------------------------------------------
** Please LIKE 👍, FOLLOW ✅, SHARE 🙌 and COMMENT ✍ if you enjoy this idea! Also share your ideas and charts in the comments section below! This is best way to keep it relevant, support us, keep the content here free and allow the idea to reach as many people as possible. **
-------------------------------------------------------------------------------
💸💸💸💸💸💸
👇 👇 👇 👇 👇 👇
Short ZEC at $173.76 I drew this line years ago at $173.76. I doubt late buyers are going to get rewarded buying ZEC after such a big week. ZEC has been around since 2016 and the fundementals have not changed significactly. What makes you think ZEC is going to make new highs? People say they love privacy but in reality, never use it. The people who actually need privacy for illegal things use XMR. You won't find any of them using ZEC. Sentitment is also very high. There's never been so much talk about ZEC.
However I'm bullish on alts in general, and I think we could eventually see $800 ZEC this cycle, but shorting this nearly decade long resistence is worth the risk/reward.

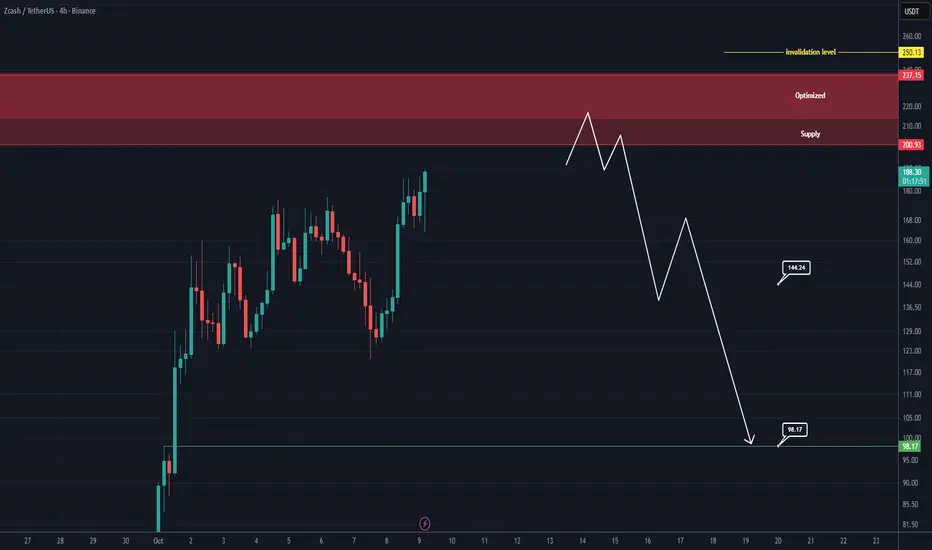
ZEC Analysis (4H)This coin has grown significantly and is now approaching a very strong resistance zone.
The supply zone contains an optimized sub-zone that we’ve labeled as optimized. The closer the candles are to this area, the safer it is to take a sell/short position without a trigger However, if you are risk-averse, wait for the candles to touch this zone, observe the price reaction, and only enter the position after receiving proper confirmation and a trigger signal.
The main targets are marked on the chart.
A daily candle close above the invalidation level will invalidate this analysis.
For risk management, please don't forget stop loss and capital management
When we reach the first target, save some profit and then change the stop to entry
Comment if you have any questions
Thank You
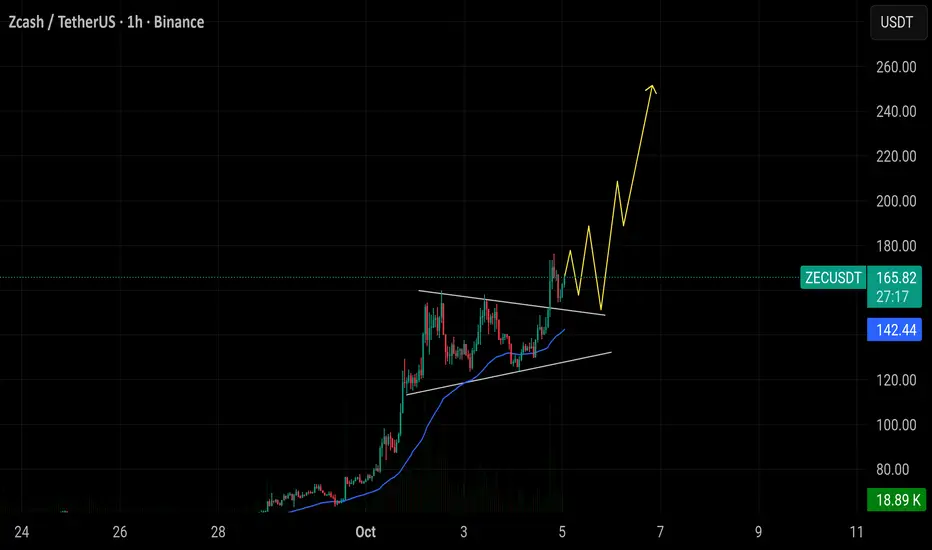
#ZECUSDT - Another leg up is aheadWe all saw a massive bullish in zec in previous days out of 260% instant bullish... and now it's in consolidation
it shows a symmetrical triangle pattern in hourly chart with 2 attempts of breakout ... third one must be work
the next station at ( 250 - 280$)
best Regards:
Ceciliones🎯

AVL BREAKOUT ZONE WILL GET THIS TOKEN TO UP $0,50 - BEST 2025AVL/USDT — Setting Up for a Major Breakout Toward $0.50 🚀
AVL continues to show strong technical structure after completing both A and B increase phases, now consolidating near the breakout zone around $0.30.
✅ Breakout zone approaching: Price action is tightening within a key range, preparing for a potential impulsive move upward.
✅ Open space above $0.30: Once AVL confirms a breakout, there’s minimal resistance all the way to the $0.50 target, suggesting a possible sharp rally.
✅ Cycle continuation: Historical patterns show AVL tends to build momentum in stages — the current setup suggests the start of the next expansion leg.
Technical Outlook:
As long as AVL holds above $0.20, the bullish structure remains valid. A confirmed move above $0.30 could trigger a strong breakout run toward the $0.50 open space zone — a potential gain of nearly 100% from current levels.
📊 Bias: Strongly Bullish
🎯 Targets: $0.30 → $0.42 → $0.50
⚠️ Invalidation: Below $0.19

Zcash Breaks 2018 Downtrend: Confirming a Multi-Year Bull Run Zcash has just broken a trendline that had been in place since 2018. Even though the movement of the last few days might seem exaggeratedly wide, in reality, it's just the confirmation of the start of a bullish trend that will likely last for years. From both a technical and fundamental analysis perspective, it's one of the 5 most interesting coins in absolute terms. It has been undervalued for years due to fears of delisting and FUD, but institutional investors have bet heavily on it while retail investors were discouraged. That said, I wouldn't enter a position at this price, but possibly around $80-100. Personally, I've accumulated for years below $40, but on this confirmation, I'd definitely add capital. The next important resistance is the last reversal point from the previous cycle, so around $300. Dips around $100 are to be bought if they are granted. Thanks to everyone for the attention.

ZEC - BEARISH STRUCTURE --> UNSAFE AREA FOR BULLS#ZEC- price analysis: Cautious with long, NO FOMO.
Prices is up 250%+ in few days, because of hype on "privacy tokens' if i'm right!
Neutral zone monthly.
Key levels weekly have been hit.
🚨Double top daily
🚨H4 bearish divergence
🚨H4 Rising wedge structure
In my opinion, prices is gonna correct deeper toward 125$ or 115$ support next.
Upper big levels:
157 - 165 - 170$
To sum up:
Really unstable area for long subject to a bearish correction.
Bullish momentum faded + bearish structure visibile H1 view.
Cautious under those resistance levels.
Invalidation: H4 candle close above 170$

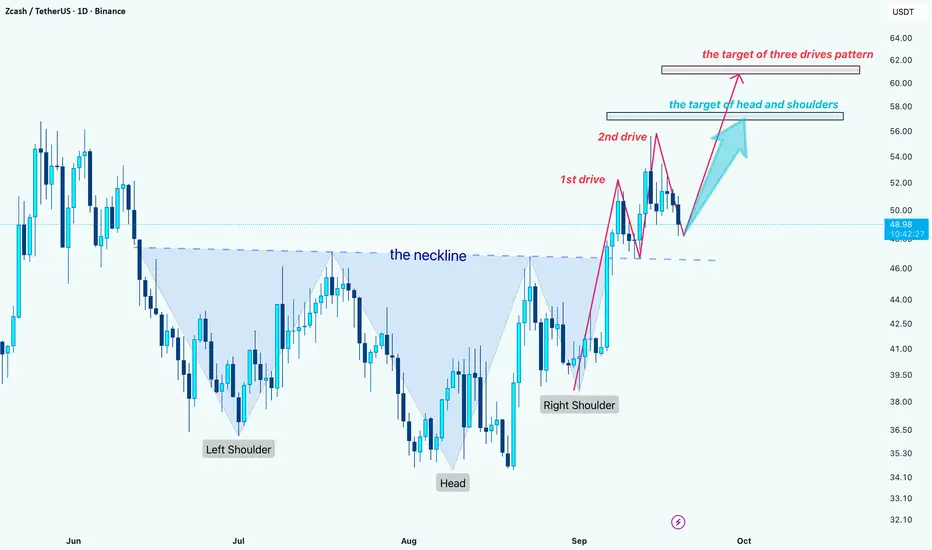
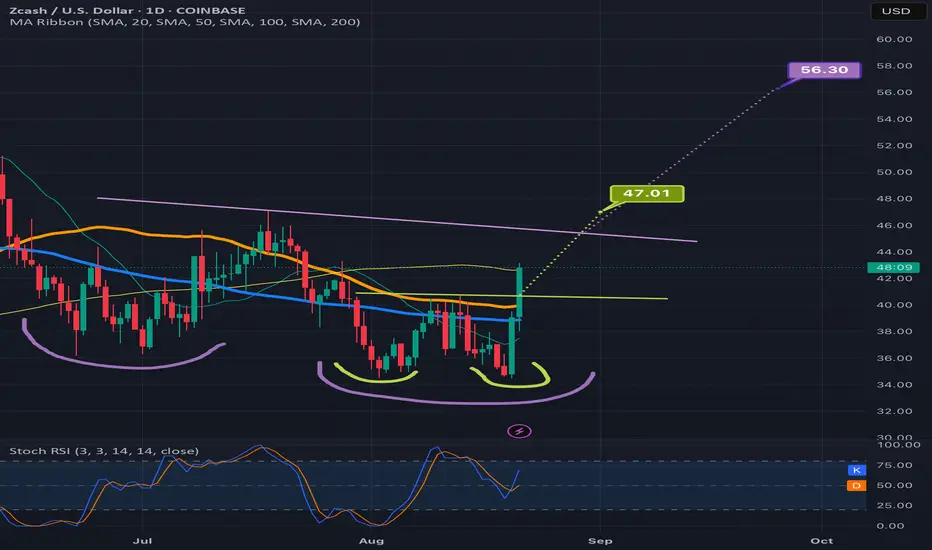
ZEC: Bullish Breakout with $57 and $61 Targets AheadHello guys!
ZEC is showing some interesting technical setups right now:
First, the chart has completed a Head & Shoulders reversal and successfully broken above the neckline. Based on this structure, the next potential upside target sits around $57.
On a lower level, the price is also shaping a Three Drives pattern. If this plays out, the extension could take ZEC higher toward the $61 zone.
Overall, the technical picture looks bullish as long as the price holds above the neckline. A breakout confirmation with momentum could push ZEC step by step toward those targets.
$ZEC/USDT has broken out of its wedge pattern and is currently $ZEC/USDT has broken out of its wedge pattern and is currently trading near 164. If price holds above 150, momentum could continue toward the 200–240 zone. The lower trendline support around 130 remains the key level to maintain the overall bullish structure.
ZEC wedgie ideaA wedgie is the act of forcibly pulling someone's crypto up their buttocks. It can be a form of bullying a victim or a prank among friends. There are various types of wedgies, such as an "atomic wedgie," where the crypto is pulled over the victim's head, or a "hanging wedgie," where the person is suspended by their crypto coin.

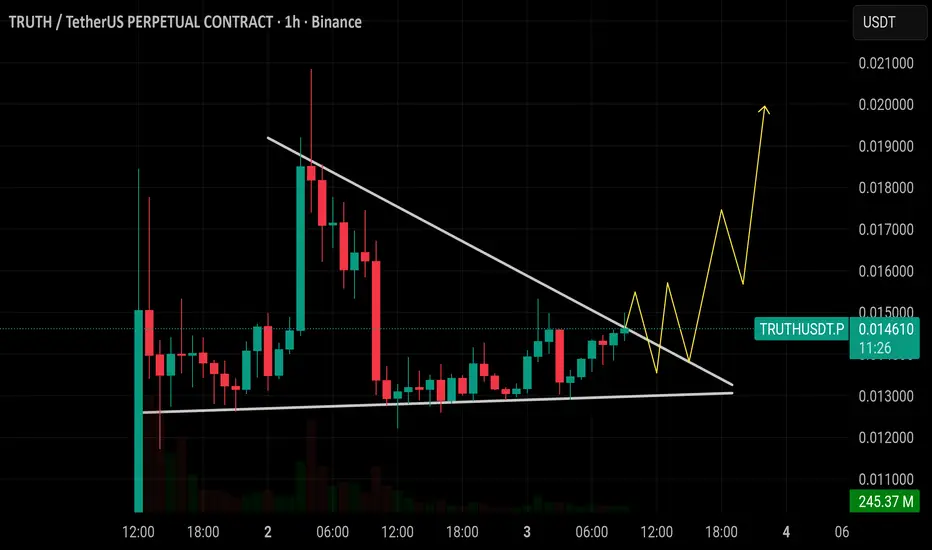
$TRUTH is breaking out from a falling wedge pattern around 0.014$TRUTH is breaking out from a falling wedge pattern around 0.0147. If momentum holds, price can push toward 0.0160 first and then extend toward 0.0200. Losing 0.0130 support would invalidate this bullish setup.
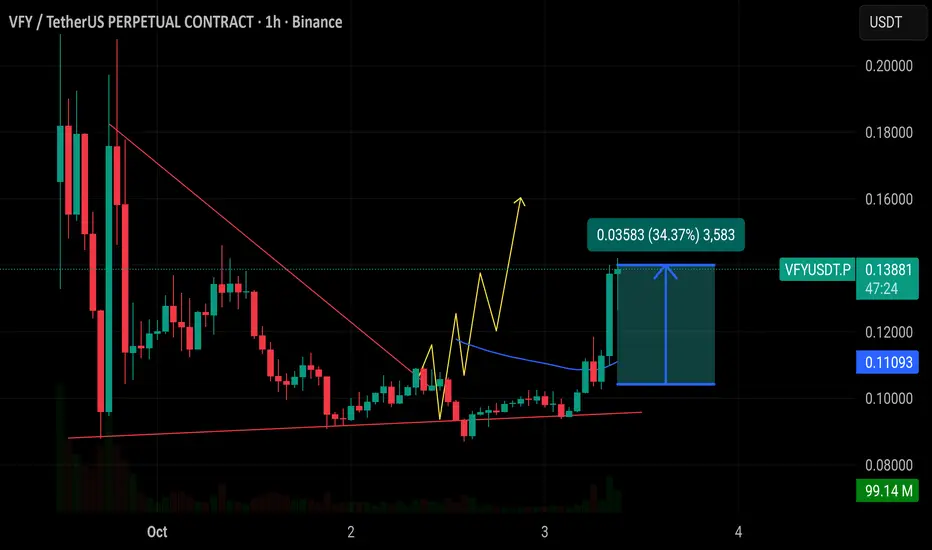
$VFY just pumped 34% after breaking out of the wedge pattern.ASX:VFY just pumped 34% after breaking out of the wedge pattern. Strong move above resistance confirms the breakout. Price is now holding above 0.13, with support around 0.11. If momentum continues, next target zone is 0.16–0.18. Volume also rising chart remains bullish ✅
Zcash working on filling out right shoulder for next breakout Zcash appears to be forming a special inverse head and shoulders pattern I like to refer to as the sweet dreams or sleepy head inverse head and shoulders as the trendline you draw to highlight the head and shoulders take on a smile face with its eyelids closed. I anticipate even though I already drew the hypothetical length of the right shoulder fairly s that there’s a chance it could break above the neckline after forming an even shorter right shoulder based on some of the recent tiny right shoulders we’ve seen fro the likes of digibyte, atom, cardano and others. Always a chance since it’s left shoulder was tiny that the right one could buck the trend and form a regular sized right shoulder too, either way I’m confident with market conditions how they currently are theat probability favors this pattern breaking out and up eventually. *not financial advce*

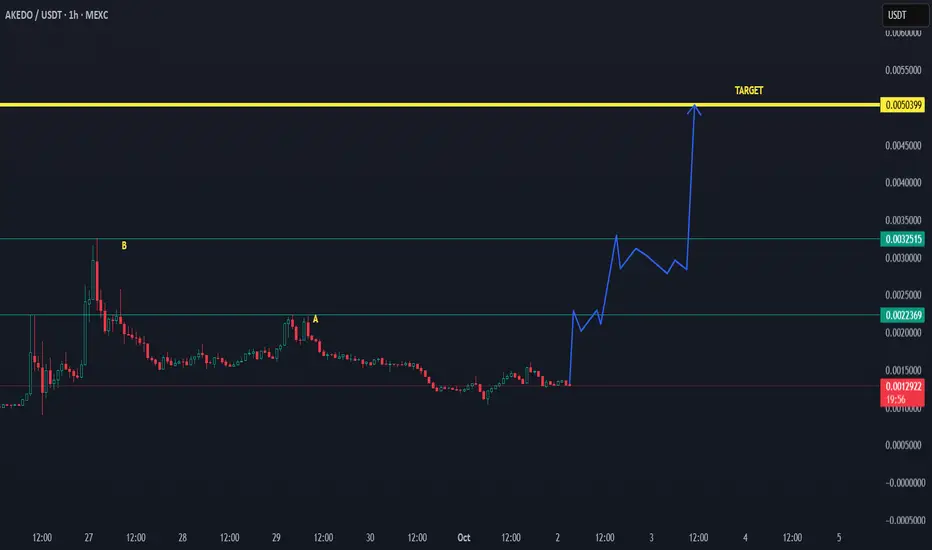
AKE/USDT STARTING TO MAKE A HISTORY.. UPDATE 02-10-2025📊AKEDO/USDT Trading Update
Price has been consolidating after a long decline, forming a potential cycle bottom.
The chart shows step-by-step breakout levels:
First resistance at 0.00223 USDT
Next confirmation level at 0.00325 USDT
If momentum continues and these levels flip into support, the structure supports a push toward the main target of $0.005.
✅ Outlook: As long as price stays stable and buyers hold the base, the chance of a strong breakout remains high. The pattern suggests a possible cycle rally with over 3x upside potential.
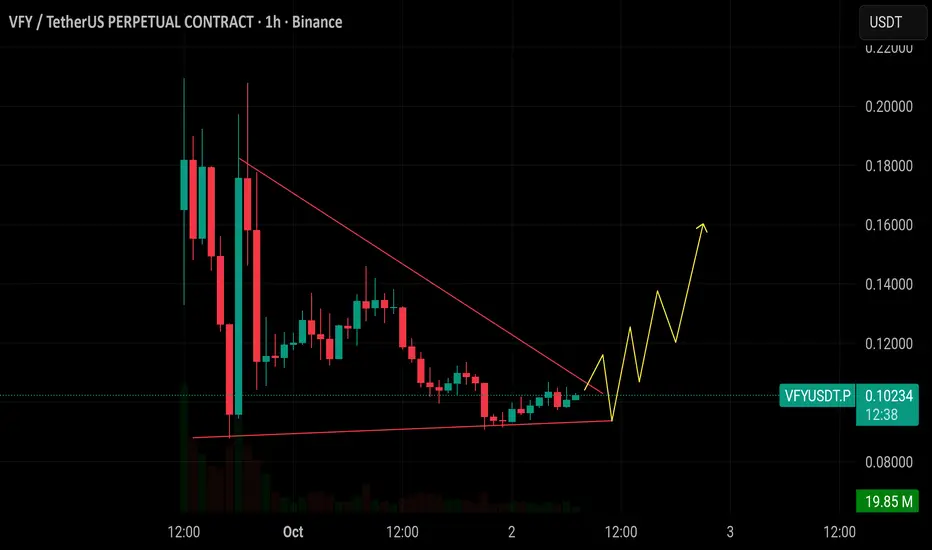
$VFY is forming a bullish wedge. Support is around 0.092. #btcASX:VFY is forming a bullish wedge. Support is around 0.092. A breakout above 0.11 could trigger a sharp move. Watch for rising volume spike may come soon. If confirmed, targets are 0.14 to 0.16. Chart looks ready for upside. ✅
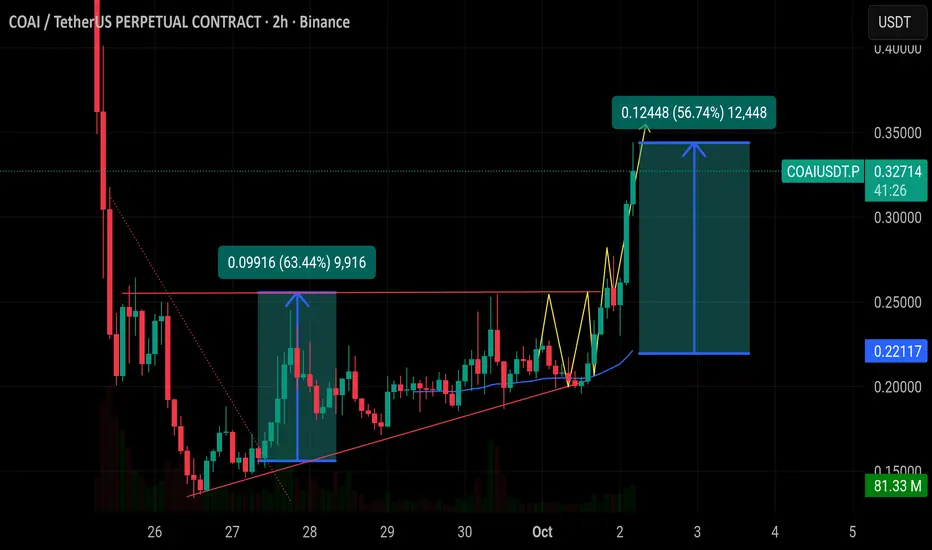
$COAI is pump 57% It broke out of a triangle pattern. $COAI is pump 57% It broke out of a triangle pattern. Now holding above the0.30 level. Support is around 0.25 for now. If this holds, next target is0.40. Trend is bullish with strong momentum. 🚀
#ZEC/USDT Breakout Confirmed - Bullish Rally Loading!#ZEC
The price is moving within a descending channel on the 1-hour frame, adhering well to it, and is heading for a strong breakout and retest.
We have a bearish trend on the RSI indicator that is about to be broken and retested, which supports the upward breakout.
There is a major support area in green at 48.26, representing a strong support point.
For inquiries, please leave a comment.
We are in a consolidation trend above the 100 Moving Average.
Entry price: 52.70
First target: 53.70
Second target: 54.90
Third target: 56.85
Don't forget a simple matter: capital management.
When you reach the first target, save some money and then change your stop-loss order to an entry order.
For inquiries, please leave a comment.
Thank you.

Zcash may be ready to trigger a double double bottomPrice is firmly above the smaller lime green neckline at the moment and likely to trigger the breakout, the ful target of which would send price action above the neckline of the larger double bottom pattern. *not financial adviice*
ZEC Market Update📊 SEED_DONKEYDAN_MARKET_CAP:ZEC Market Update
SEED_DONKEYDAN_MARKET_CAP:ZEC has successfully broken out of the red resistance zone 🔴✅
It is now approaching the first target at the blue line level 🎯
