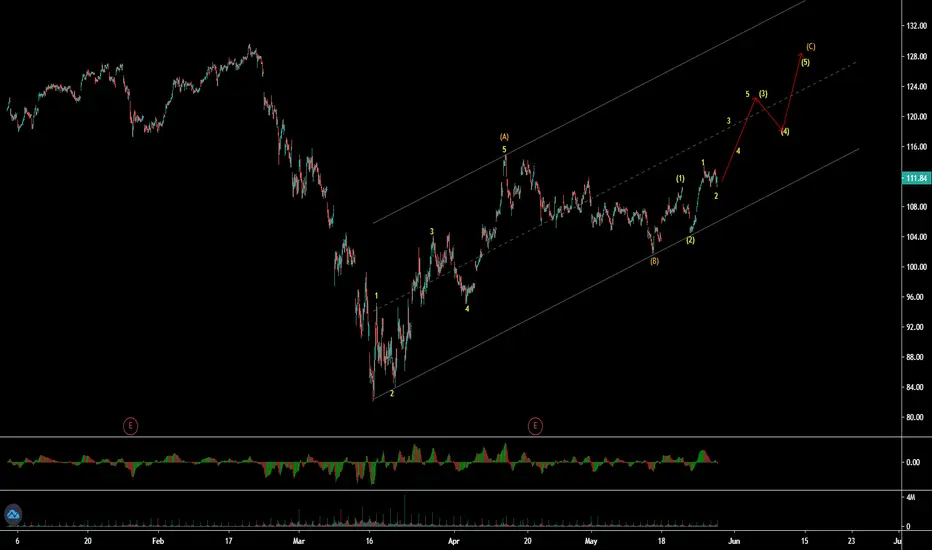
Wave 2/Bearish Gartley/AB=CD Harmonic Pattern/TRZ !!!First, I have to say that we passed Running Flat correction , even we passed Main Wave 1 .
Now, we are on Main Wave 2 ( Zig zag corrective & AB=CD Harmonic Pattern ), probably end of micro wave b of Main wave 2.
I can see another Bearish Gartley on wave 2, and maybe this is end of micro wave b of Main wave 2 (You can open SHORT position if you see sign of revers on TRZ&PRZ).
End of wave 2 can be around 56125$ until 51500$ , we need time to know that where is end of Main wave 2 ?!(You can open LONG position on end of Main wave 2 )
Please spend time for chart.( I spent lot :) )
Please follow your strategy , this is just my idea , and I will be glad to see your ideas on this post.
Please do not forget 'like' button :), Thanks and Trade safe.
Good luck.
Zigzagpattern

how to apply fib channels and auto fib channels studyThe Fibonacci Channel is a technical analysis tool that is used to estimate support and resistance levels based on the Fibonacci numbers. It is a variation of the Fibonacci retracement tool, except with the channel the lines run diagonally rather than horizontally.
The tool is used to aid in identifying where support and resistance may develop in the future. If the uptrend is expected to continue, the 100%, 161.8%, and other higher levels are potential price targets. The same concept applies to downtrends if a downtrend is expected to continue
In an uptrend, the zero-line is like a normal trendline, helping to assess the overall trend direction. If the price falls below it, it may need to be adjusted based on more recent price action, or it could signal that the uptrend is over and that the price is breaking lower. Similarly in a downtrend, the zero-line also acts like a trendline. When the price is below it, it helps confirm the downtrend. If the price moves above it, the indicator may need to be redrawn or the price is moving higher out of its downtrend
Difference Between Fibonacci Channels and Andrew's Pitchfork
Both these indicators attempt to predict future support and resistance levels based on price levels from the past. Fibonacci channels attempt to do this with percentages of a selected price move. Those percentages are then projected out into the future. Andrew's Pitchfork is simpler in some ways as the angled lines are based on three price levels selected the trader and then extended out into the future.
Step By Step Applying Fibonacci Channels
Auto Fib Channels ʙʏ DGT ☼☾
LINK to Auto Fib Channels ʙʏ DGT ☼☾

eurusd short The following text contains the reasons for the falEurusd It is declining until it creates a positive divergence.
Also, when wave b is shallow from 1, it is not possible for wave 2 to be shallow
its Harmonic Eliot Waves
So the reasons for the fall:
1- Creating bullish divergence in 4-hour timeframe.
2-Harmonic Eliot Waves says we need a deeper correction
3-Classically, the uptrend occurred with the weekly resistance and also the uptrend line was broken. Therefore, the most reliable support that can prevent the fall is the weekly support, in the range 1.18800-1.18500
4-The last candle of the day cast a long shadow on its high resistance , Which indicates a failed test to climb as well as a failure to start the ascent
If you agree with me and it was useful to you, do not forget to like and support. Good luck

Crab pattern on 1 H. Bearish forming. GBP weaker bias (mid-term)Short trade on 1 hour timeframe.
Crab pattern formed and forming a bearish momentum.
Zig zag peak point is reached and forming another bearish line.
RSI already in the downward momentum.
Trade will be taken at the break of the orange horizontal line.
Trade details:
Entry: 1.38180 (The brake of the horizontal line)
TP: 1.37420
SL: 1.39265
We currently still waiting for the TP.
*If you like this trade, please like and share this trade so we could help others gain profit as well*
Stay tuned for the update.

Three Drives End Game: Three Bears' Correction: Papa Incoming!Chart says all. June gave us a Baby Bear; Sep/Oct the Mama; and Big Daddy Papa Bear is waking up soon IMO.
Expect Strong support around 3400. This is a guess; as the bubble expands, price correction magnitude increases.
Geometric modeling projections shown estimated length and price based on extension from Baby > Mama > Papa.
Third Drive near completion IMO; 72 days' projection based on extrapolated duration of last two corrections > ~13 Jan.
3861 price is a guess, just a squeak above Fri 1/8 close... probly close to rollover atm, VIX stays up at ATH...
Soon... a few days, weeks at most IMO. NB: See RSI weakening, MFI diminishing... volume diverging as well...
This is nothing more than an educated WAG, not investing advice; trade at your own risk, GLTA!

ZM $240 PT by mid JanZoom gona hit bottom around $240 Mid Jan based on time frame. Im not too good with fib time zones but the waves are accurate.
Get puts for march


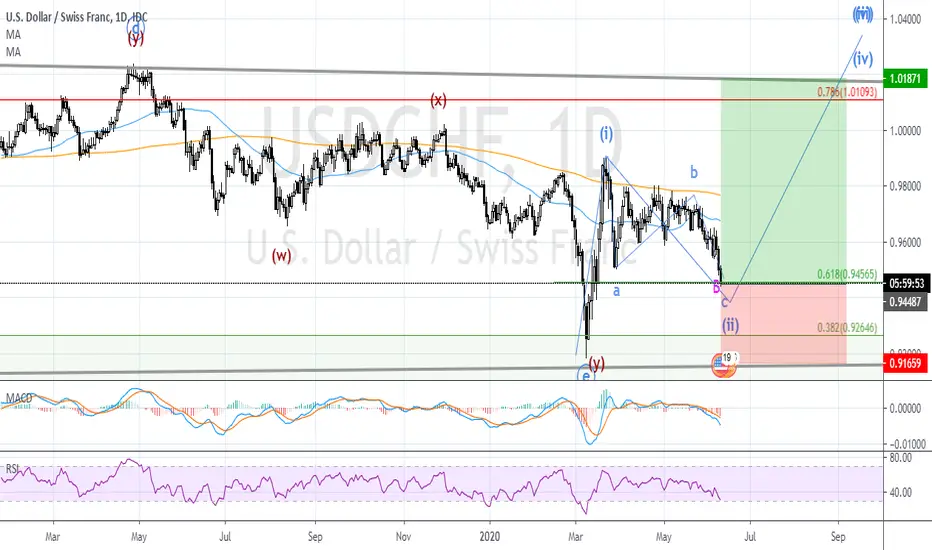
Correction completedAfter a zigzag correction, there was a big turn last Friday. I expect to see further rising, but I will wait for a little falling correction.
Maybe a multi-year sideways correction is over and new high will come but do not run forward, so wave 2 correction is needed.
Here is the time for dollar coming back?!

LEADING DIAGONAL POSSIBLE BREAK OUTA Long position can be traded in the market, as the 5th wave tends to complete the zigzag pattern formation. If we count numbers of zigzags formed, it can be clearly seen the 3-3-3-3-3 Diagonal formation is almost complete. This signifying the possible break out to the 1.628 position.
Please kindly check the chart for details.
Kindly like, follow and comment if you find Idea useful and relevant.

WORK BUY opp i have been following this since the gap, last week GS downgrade $work to $30 , i believe it was strange downgrade for the stock like intentionally they want the price to be around the $30ish to kill all options traders, it's great company and it's work from home stock!
technically speaking the stock set on very strong support the yellow trend line since April, in the other hand $32 area very tough, if the stock break $32 smoothly then it will fly to close the gap, if the stock breakdown $29.50 then the stock will go down to $25..
WLong

GOLD Is Watching US Market DataGold ZigZag Trend Will continue as long as the US market is green With FED decision against COVID corona.
Today US Market Were Somewhat Green
But Tomorrow what happens?


DAX Elliot correction wave - 5:3:5 zig zagHello world,
another idea regarding DAX / Germany 30. Working out quite alright already.
Unfortunately forgot to press "publish". Still a valid guess though.

INDIA MART - Important levels for positional trading/investingINDIA MART - Important levels for positional trading/investing

After the reversal'Dive in the deep' related idea I expected to see a huge falling. It has happened.
Now here is the first momentum of a correction. Maybe a good Elliott Zigzag. The Fibonacci support zone should work well and I would like to see a clear correction pattern. Waiting for these signs

Be prepered for the next objective In the Getting weaker related idea I visualized my trading so I am not an independent analyst at the moment.
A rising correction is ongoing at the moment in a Zigzag pattern. I would like to see it will get stuck around the .382 Fibonacci level and the next round will be down. The fifth round target could be around 30 - 32 besides that not trade above 37.80.
Important
Always use stop order, cutting losses, this is one of the essential elements of your risk management and if you would like to be an independent investor then you must be the master of risk management.
Disclaimer
Reserved the right to make changes the content on this analysis at any time without notice and is provided for the sole purpose of assisting traders to make independent investment decisions.

Getting weaker and weakerOver the top, there had been an impulse falling and a Zigzag correction(maybe this is lower high). Let see a strong momentum downward which go through easily the rising channel. I would not like to see oil on a new high! There is a risky trading plan and more conservative after the channel breaking.
Let see the next move.
Disclaimer
We reserve the right to make changes the content on this analysis at any time without notice and is provided for the sole purpose of assisting traders to make independent investment decisions.

Just on the Fibonacci retracement levelAfter an impulsive rise which had taken over the previous high, there is three waves Zigzag correction just on the .618 Fibonacci retracement level. I like this combination and there is a swing trade plan on the chart.
You should know we are just a few hours before the FED rate decision!!! Consider this circumstance when making a trading decision
Disclaimer
We reserve the right to make changes the content on this analysis at any time without notice and is provided for the sole purpose of assisting traders to make independent investment decisions.
There is something you should know!Tomorrow is about the FED, but it seems USD is getting come back. It has done a three waves Zigzag correction. The wave C seems complete and the Fibonacci level(.786) has been reached, so the next coming wave should be UPward. If it will be than this new wave will be spread through the forex market.

Adidas did it!A clear three waves structure, failed breakout from the channel. It is an A-B-C Zigzag after the Covid bottom. The rising is final? New low will come? We will see but everything will be decided around 220 - 200.

PPG industries (PPG - NYSE) sell for C wave downPPG industries (PPG - NYSE) looks like forming ABC simple zigzag. It seems like wave C down is already started. Sell with stops above 98.80 level for target below 70.

Incredibly weakAfter the coronavirus diving, the Spanish market was able to ridiculously weak rise. Not able to reach the 0.382 Fibonacci level in the last 50 days!
The rising from march low has a corrective 3 waves style like zigzag in Elliott wave theory. The bears are in control, just had a nap.
The rising could continue for a while, but 7500 is a strong resistance I expect.
So I would like to see the next coming downside pressure to new lows in the wave C or wave 3. The minimum next target is at slightly below 5000(wave C objective) or more 4000(wave 3 objective).

SAP SE (SAP - Xetra) - ABC wave patternSAP SE (SAP - Xetra) is in ABC zigzag up move in 60 min time frame. Currently price is in 3rd wave of C wave up. Overall the stock is in strong up trend and in weekly it may in 5th wave, which means the up move in 60 min will be impulse. Next movement will decide what will gonna be impulse or ABC.