AUDCAD higher bullish for expect
OANDA:AUDCAD we are have break of long PA, currently price in zone and we have ASCENDING TRIANGL, from here expecting higher bullish push.
SUP zone: 0.92800
RES zone: 0.94000
Zonetrading

EURJPY higher fall for expect
OANDA:EURJPY after BOJ in week before, expecting higher bearish fall here.
SUP zone: 184.100
RES zone: 182.400, 181.800

GBPCAD bearish view
OANDA:GBPCAD price bouncing on top line of PA, its break zone, its break trend line under zone, GBP events today are make him weaker, from here higher bearish expecting.
SUP zone: 1.86000
RES zone: 1.84000, 1.83000

EURJPY higher bearish expected
OANDA:EURJPY price break zone, under zone we have BEARISH PENNANT (white doted) which looks breaked, from here higher bearish expectations having.
SUP zone: 183.400
RES zone: 181.500, 180.700

AUDCHF new bullish expecting
OANDA:AUDCHF price is bounce on trend line, its come back in zone, we have low risk on this trade and good prob. for higher bullish.
SUP zone: 0.53400
RES zone: 0.54100, 0.54350

NZDCHF higher bullish expectations
OANDA:NZDCHF price in long zone and ROUNDING BOTTOM pattern visible, here bullish view having.
SUP zone: 0.45950
RES zone: 0.46750, 0.47000

CHFJPY revers here expected
OANDA:CHFJPY long time bullish we having, this point taking for revers point. We have long zone and on zone we having TRIANGL pattern.
SUP zone: 198.100
RES zone: 195.600, 194.800

CADJPY bearish expectations
OANDA:CADJPY first analysis we are have SL reached, here second view. Price in zone, bouncing on sup. zone, trend line breaked, from here expecting higher bearish.
SUP zone: 114.000
RES zone: 113.000, 112.600

CADCHF bearish view
OANDA:CADCHF zone visible, currently price in PA, here bearish view for new week having.
SUP zone: 0.57730
RES zone: 0.57000

Oil prices continued their upward trend, reaching 62.After the price broke the 58.6-58.88 price zone and closed above it, due to a price surge following a period of overlap and manipulation, a large, clear candlestick formed on the hourly and four-hour timeframes. This candlestick created a fair value gap on the four-hour chart, from which the price is expected to rise, targeting 60.3, 61.2, and 62.

GBPCAD higher bullish expected
OANDA:GBPCAD strong bullish push/break, here for this week only bullish continuation.
SUP zone: 1.85200
RES zone: 1.87500

XAUUSD WXAUUSD is in an uptrend and may retest the marked area. After that, the trend is likely to continue. Key levels are important to monitor to see how the market reacts from this point.

EURNZD continuation or revers
OANDA:EURNZD what's next, at this point we can expect changes, or still one more bullish push.
Personally expectations are bearish for this week, believe will update more on this trade.
SUP zone: 2.06000
RES zone: 2.03000, 2.02000

USDJPY Sell SetupTechnical Context
Break of Structure → Price broke last week’s low at 155.64, extending down to 154.70, confirming bearish momentum.
Supply Zone Retest → Price is now retesting the 155.40–155.70 supply zone on the 1H chart, offering a potential short entry area.
🎯 Trade Plan 🎯
Entry : 155.50 (below supply zone, 1H)
Stop Loss : 155.72 (above supply zone, 1H)
Target : 154.95 (above demand zone, 1H)
Risk–Reward: ~3.5x
⚠️ Disclaimer ⚠️This journal entry is for educational and documentation purposes only. It does not constitute financial advice or a recommendation to trade. All trading involves risk, and past performance does not guarantee future results. Always conduct your own analysis and consult with a licensed financial professional before making trading decisions.

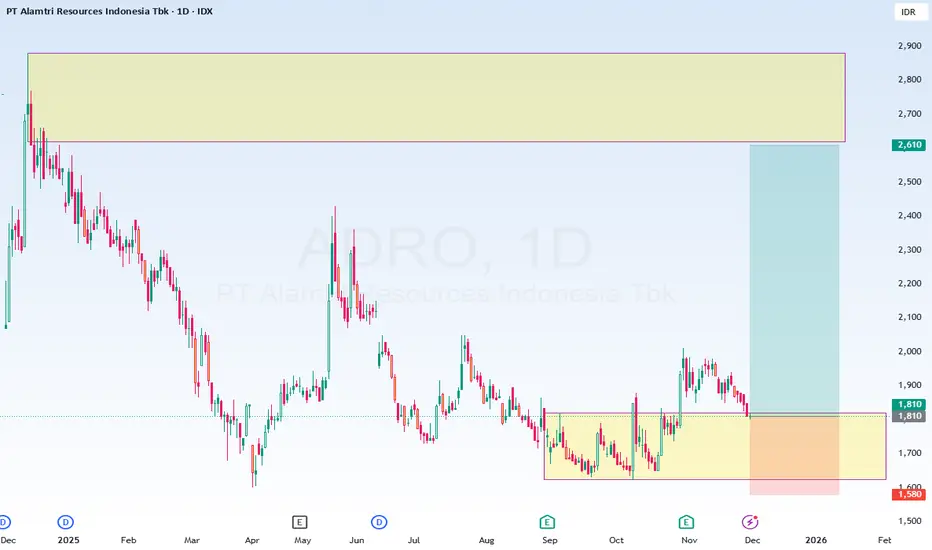
ADRO Trade Setup – Bullish BiasADRO is showing early bullish signs, including a structural break (CoC) on the Daily Timeframe, a retracement into supply, and support from a daily base zone. The planned entry at 1810 offers a favorable risk–reward profile, with stops safely below structure and targets aligned just under the next supply zone.
Technical Context
1. Change of Character (CoC) → On the daily timeframe, price broke the previous high at 1880, signaling a potential shift in market structure toward bullish momentum.
2. Retracement to Supply Zone → Price has pulled back into the September monthly supply zone, offering a possible area of reaction.
3. Previous Base Zone (Daily) → Current price action is also sitting on a daily base zone, reinforcing confluence for a potential bullish continuation.
Trade Plan
Entry 1810
Stop Loss 1580
Target 2600
Risk (pts) 230
Reward (pts) 790
R:R Ratio 3.4x
USDCHF strong bullish expectations
OANDA:USDCHF price moving in RECTANGLE, its break zone after yesterday's FOMC, currently how looks we will have CHF weaker for next period.
SUP zone: 0.79700
RES zone: 0.80800, 0.81200

#BankNifty 10th October Friday - #CatchAndRead Bank nifty 10th October Friday - zigzag untadaa - #CatchAndRead
Follow my Yt channel... Link in dp


NZDCAD still bullish view
OANDA:NZDCAD we are have strong bullish push, currently price in consolidation zone, still here for next periods we can expect bullish.
SUP zone: 0.82100
RES zone: 0.83100, 0.83500
EURGBP after ECB bearish push expecting
OANDA:EURGBP price break zone, its make few bounces on sup zone (0.86550) which taking for legit, after todays ECB here expecting short bearish push.
SUP zone: 0.86550
RES zone: 0.86200, 0.86050

GBPJPY still bullish expectations
OANDA:GBPJPY price is make bullish push, then we are have BULLISH FLAG created, in this week price is making zig-zag moves in zone, today its make break, which taking for bullish confirmation.
SUP zone: 199.400
RES zone: 200.600, 201.400

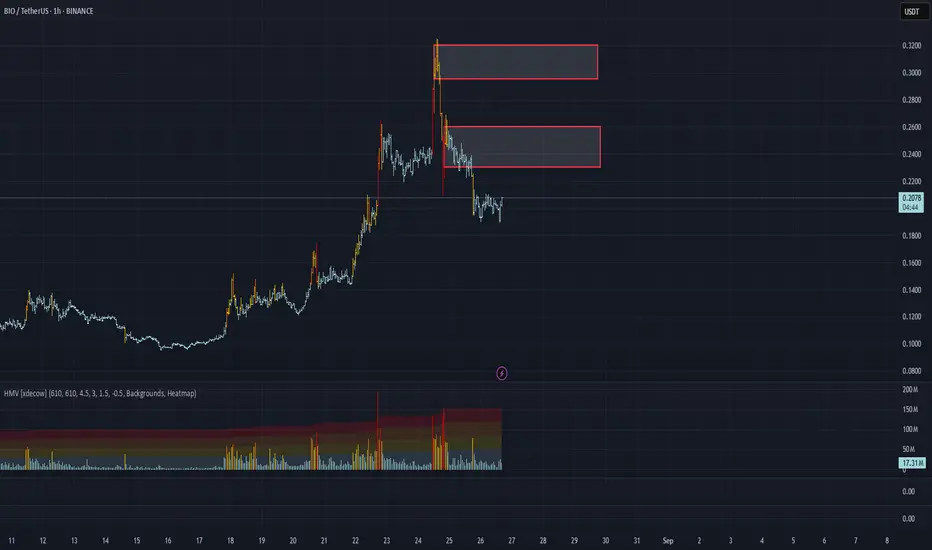
BIO/USDT Analysis. Short Setup
This asset has shown a trend break. Above the current price, there are volume zones that have already received positioning. If one of them is tested and we see a reaction, we consider short entries. Target potential — ~$0.17.
Sell Zones:
$0.23–$0.26
$0.295–$0.32
*This post is not financial recommendation. Make decisions based on your own experience.
USDCHF still bullish expectations
OANDA:USDCHF bullish push we are have, price is make short revers till zone, currently its on sup zone, from which expecting new bullish push.
SUP zone: 0.80400
RES zone: 0.82000, 0.82500
