January 2026 Alt Analysis RequestFamily, January 2026 marks the opening of a new trading year and a critical reset point for the broader market. With Bitcoin setting the tone and liquidity gradually repositioning, this phase is decisive for identifying which altcoins are preparing for expansion and which will continue to lag.
This makes our January altcoin selection especially important as we align early with the strongest structures and narratives for the year ahead.
📌 Submission Deadline: January 10th, 2026
📌 Target Coins: 30 slots only
📌 Requirements:
1. Strong liquidity with a clear and tradable technical structure.
2. Projects showing active development, sustainable narratives, or ecosystem growth.
3. No dead or illiquid tokens — serious, high-quality suggestions only.
As always, every submission will be reviewed, but only coins that align with current market structure, liquidity conditions, and our technical framework will advance into full analysis. The objective is straightforward: position ahead of rotation, not chase it, as market participants recalibrate for the new year.
🚨 Reminder: Early year positioning often defines the strongest performers for the months ahead. Let’s keep this list disciplined, selective, and forward-looking.
Drop your January alt requests below, this is the time to be intentional.
Crypto market

BTCUSDT: Pullback Toward Demand ZoneHi!
Bitcoin is showing short-term weakness after failing to hold above the recent high. Price is currently trading below the local resistance area, suggesting a corrective pullback rather than continuation.
The highlighted demand zone around 90.4K–90.9K is a key area to watch. This level previously acted as resistance and was later flipped into support.
Key Levels:
• Resistance: 93.1K–94.4K
• Demand / Support: 90.4K–90.9K
Downside Target:
• 90,500 (primary demand zone)
As long as price remains below resistance, a deeper retracement into demand is likely. Reaction at support will determine the next directional move.

Bitcoin (D1) - Breaks The Channel - Liquidity Grab Complete ?📝 Description 🔍 Setup (Market Structure) BINANCE:BTCUSDT
Bitcoin was trading inside a well-defined descending channel on the Daily timeframe.
Price has now broken above the channel resistance, showing early signs of trend reversal.
Key confluences:
Multiple support reactions inside the demand zone
Breakout supported by EMA & cloud shift
Strong base formation near higher-timeframe support
Momentum gradually shifting from sellers to buyers
📍 Support & Resistance
🔴 Support Zone: 83,700 – 87,300
🟢 1st Resistance: 107,500
🟢 2nd Resistance: 118,000
#Bitcoin #BTCUSDT #CryptoTrading #PriceAction #ChannelBreakout #SupportResistance #TradingView #Kabhi_TA_Trading
⚠️ Disclaimer
This analysis is for educational purposes only.
Crypto markets are highly volatile — always manage risk and use proper position sizing.
💬 Support the Analysis👍 Like if you trade BTC 💬 Comment: Breakout confirmed or needs retest?

BTC: The Premium Zone Trap (4H vs 1H)Bitcoin is at a decisive junction. We are trading in the Premium Zone ($93,700+) with a clear conflict between timeframes. The 4H screams exhaustion (RSI 70.7 + Low Volume), while the 1H structure remains stubbornly bullish, holding above the $92,102 demand zone. The structure is intact, but the conviction is missing.
1. THE TECHNICAL REALITY (4H + 1H)
📉 We are seeing a divergence between price action and momentum:
• The Trap (4H): Price is in the Premium sell zone. RSI is overbought (70.7) and volume is down 41% at these highs. This is classic "divergence" behavior, price grinding up while participation drops.
• The Floor (1H): Despite the macro exhaustion, the 1H timeframe has cooled off (RSI 42.9) and is respecting the Ascending Support Trendline ($92,306).
• The Magnet: We have a bearish OB supply overhead at $94,760, but a juicy unfilled FVG sitting below at $90,189. Price hates leaving these gaps open.
2. THE CONFLICT: MOMENTUM VS. STRUCTURE ⚖️
Bearish Case (The Exhaustion):
• Volume has collapsed 66% on the 1H timeframe.
• MACD is printing bearish divergence on the 4H.
• 14.1% wick rejection at the $94,760 local top suggests sellers are active.
Bullish Case (The Trend):
• CHoCH and BOS are both confirmed bullish.
• Price is holding above all major EMAs (20/50/200).
• Buyers are defending the $92,102 Order Block.
3. THE TRADE SETUP 🎯
We play the reaction, not the prediction. Here are the two probability paths:
🔴 Scenario A: The Premium Rejection (Higher Probability) If volume fails to return, gravity takes over.
• Trigger: Loss of the 1H support trendline ($92,300)
• Target 1: $90,189 (Filling the 4H FVG)
• Target 2: $86,760 (Major Swing Low)
• Invalidation: 4H Close above $94,760
🟢 Scenario B: The Demand Reclaim If the 1H structure holds, we squeeze the shorts.
• Trigger: Bounce from $92,102 (Bullish OB) with increasing volume
• Target: $94,760 (Range High) → $96,000 Extension
• Stop: Tight below $91,900
MY VERDICT Short-term structure is bullish, but the "fuel" (volume) is empty. I am leaning 68% bearish (expecting a sweep of the $90k FVG) unless we see a massive volume injection above $94k. Patience is the play, let the $92,100 level dictate the next move.
MARKET ROTATION WATCHLIST
📋 While Bitcoin consolidates in this premium zone, liquidity often rotates into specific altcoin setups that are lagging behind.
I am updating my watchlist today for coins that are showing cleaner structure than BTC.

BTCUSDT Price Update – Clean & Clear ExplanationBitcoin Overall, the market structure remains bullish, but price is currently facing strong resistance, causing a short-term pullback.
Bitcoin is moving inside a rising channel, which indicates an overall uptrend higher highs and higher lows confirm bullish momentum recently, price made a strong impulsive move upward from the lower range.
The upper grey zone (around 93,800 – 95,000) is a strong supply/resistance area price was rejected from this zone, showing sellers are active here this rejection caused a short-term correction.
A stronger support lies near 87,000 – 88,000, which previously acted as a demand zone and base for the last rally price is pulling back after a strong rally, which is normal in an uptrend as long as BTC holds above key support levels, the bullish structure remains intact a healthy retracement could provide a better buying opportunity if price holds above support and breaks above 95,000, the next upside move can continue strongly if price fails to hold 92,000, BTC may revisit the lower support near 87,000 – 88,000 before continuing upward.
This is a bullish market with a short-term correction. Traders should wait for confirmation at support or resistance before entering. Patience and risk management are key.
If you find it please like and comments for this post and share thanks.

Why Time Is a More Important Indicator Than Price?Everyone stares at price... Very few traders watch time.⏱️
📌 What Time Reveals
Price can lie.
Time can’t.
📌 When price:
- Spends too long at resistance → sellers are weak
- Fails to drop fast → demand is absorbing
- Breaks late → move is usually stronger
Time shows intent.
If price holds a level longer than expected, something is changing!
📌 How to Use This Practically
Next time price hits a key level:
Don’t rush the entry.
📌Instead, watch:
- How long it stays there
- Whether rejection is immediate or delayed
- Time tells you who’s in control.
⚠️ Disclaimer: This is not financial advice. Always do your own research and manage risk properly.
📚 Stick to your trading plan regarding entries, risk, and management.
Good luck! 🍀
All Strategies Are Good; If Managed Properly!
~Richard Nasr

TON/USDT | TON Coin Rallying Over 20%, Bullish Momentum ContinueCRYPTOCAP:TON has surged from $1.65 to $1.95, delivering over 20% return since our last analysis. Price has held above the key $1.58 level and is now pushing aggressively higher, confirming short-term bullish momentum.
If strength continues, next bullish targets to watch are $2.07, $2.22, $2.38, and $2.60.
Please support me with your likes and comments to motivate me to share more analysis with you and share your opinion about the possible trend of this chart with me !
Best Regards , Arman Shaban

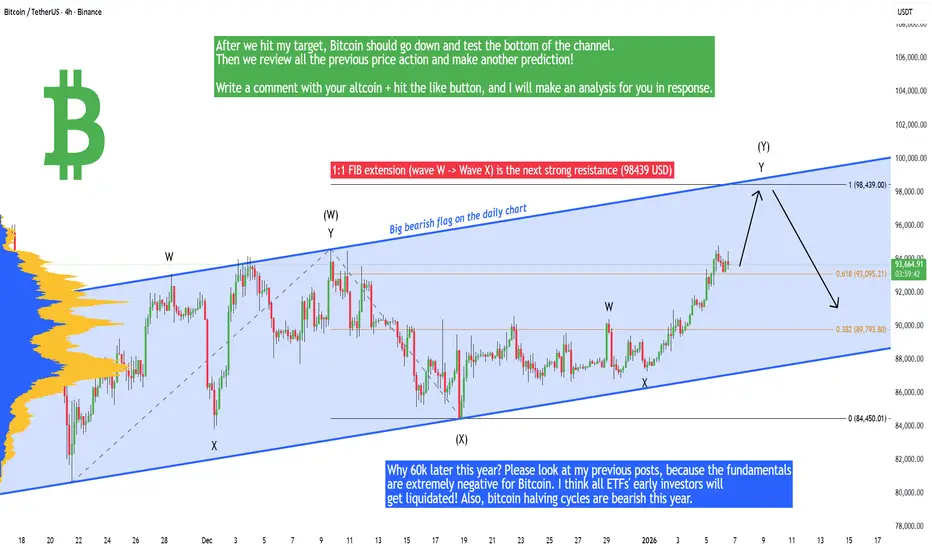
Bitcoin - Soon pump to 98k! But sell here, because...Bitcoin is temporarily bullish, and from a technical point of view, we can expect 98,439 USD in the short term. There are many reasons behind this movement, the first is that Bitcoin is forming a bigger bearish flag that is well visible on the daily chart. This is not the ultimate bottom on Bitcoin - I believe we are going to see levels around 60k later this year!
In the short term Bitcoin is forming an ascending parallel channel projection or a bearish flag, so if the price hits the upward trendline, that's a good time to open a short position or take profit on your long position. After that we can go all the way down to the bottom of the channel and test the upward-sloping trendline at around 89k. Why 60k later this year? Please look at my previous posts, because the fundamentals are extremely negative for Bitcoin. I think all ETFs' early investors will get liquidated! Also, bitcoin halving cycles are bearish this year.
So in short - take your profit below 98,439 USDT or open a short position below 98,439 USDT because this is a very significant level and point of interest.
Write a comment with your altcoin + hit the like button, and I will make an analysis for you in response. Thank you, and I wish you successful trades!
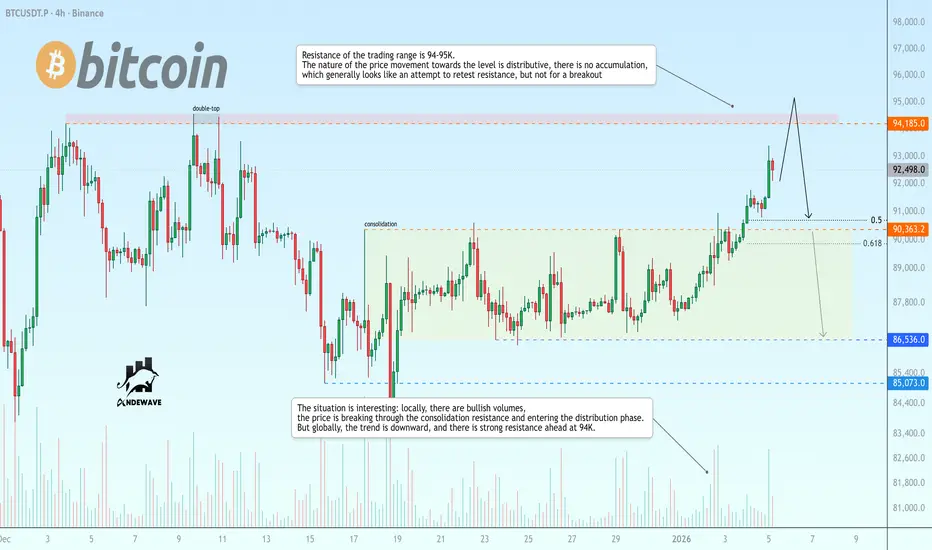
BTCUSD is heading towards 94K for a retest...
The situation is interesting: locally, there are bullish volumes, the price is breaking through the consolidation resistance and entering the distribution phase. However, globally, the trend is downward, and there is strong resistance ahead at 94K.
Resistance of the trading range is 94-95K. The nature of the price movement towards the level is distributive, there is no accumulation, which generally looks like an attempt to retest resistance, but not for a breakout. Bears may provoke a pullback from 94K.
Scenario: Retest of 94200, a false breakout and the formation of a reversal pattern below 94K could signal a possible pullback and decline to 90K - 86K.
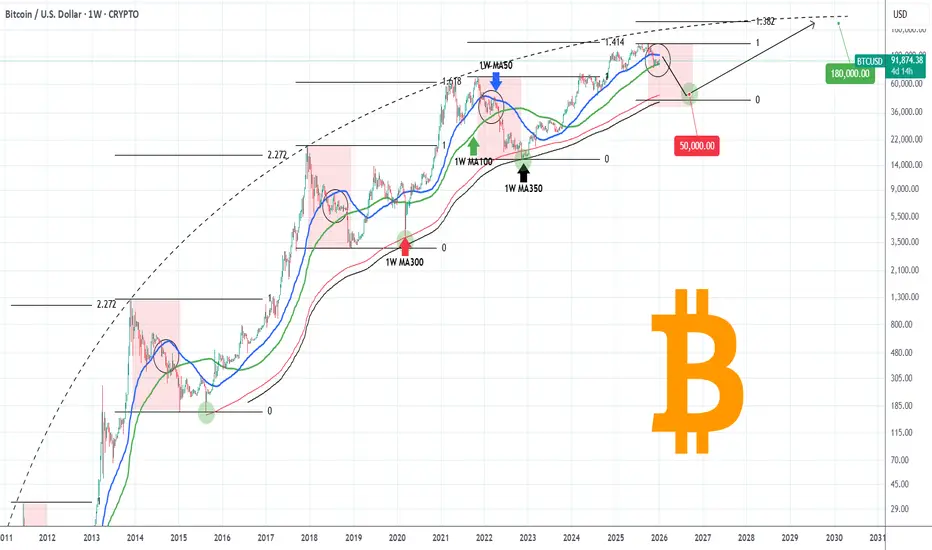
BITCOIN Can it reach $50000 during this Bear Cycle?Bitcoin (BTCUSD) has already started its new Bear Cycle since its October All Time High (ATH). We're past that, we've covered this extensively during the past 3 months. What's more important now is to cover the next stages, which is something we've started doing recently, in order to get a better understanding of the potential course of this Bear Cycle.
Right now BTC is consolidating within its 1W MA50 (blue trend-line) and 1W MA100 (green trend-line), which is a familiar pattern during all prior Bear Cycle, where after a 1W MA50 rejection, it starts Stage 2 of the Cycle.
The last Bear Cycle bottomed exactly on the 1W MA350 (black trend-line). The two before it, hit the 1W MA300 (red trend-line) before rebounding (and it was a secondary Low). As a result the 1W MA300-350 form a strong Support Zone and is the strongest candidate for the new bottom as well. Contact with the 1W MA350 (based on its current trajectory) should be made around $50000. A 45-50k potential Buy Zone would be more fair.
In any case, based on BTC's parabolic growth curve and the diminishing Fibonacci extension on each Bull Cycle Top, we expect the next ATH to be on its 1.382 Fib extension, i.e. around $180000.
Is that a trading plan you would follow if you were a long-term investor? Feel free to let us know in the comments section below!
---
** Please LIKE 👍, FOLLOW ✅, SHARE 🙌 and COMMENT ✍ if you enjoy this idea! Also share your ideas and charts in the comments section below! This is best way to keep it relevant, support us, keep the content here free and allow the idea to reach as many people as possible. **
---
💸💸💸💸💸💸
👇 👇 👇 👇 👇 👇
BTCUSDT Holding Higher Lows, $94,700 Resistance in FocusHello traders! Here’s my technical outlook on BTCUSDT (3H) based on the current chart structure. BTCUSDT initially experienced a strong sell-off, marked by aggressive bearish momentum as price dropped from higher levels. After this decline, the market found a base and started to grow, transitioning into an ascending channel. This phase showed a clear shift in control from sellers to buyers, supported by a rising support line and multiple bullish reactions along the channel. However, as price approached the upper boundary of the channel and the Seller Zone, upside momentum began to slow. During this phase, BTC formed several fake breakouts and failed attempts to hold above resistance, signaling strong selling pressure near the highs. Price then broke back below short-term structure and entered a consolidation phase, forming a clear range. This range reflected temporary balance, with buyers defending the lower boundary while sellers capped the upside. Recently, BTC broke out from the range to the upside and reclaimed the Buyer Zone, confirming renewed bullish intent. Price is now trading above key support around 91,500–92,000 and is respecting the rising support line, indicating that buyers are actively defending pullbacks. The current move is pushing price back toward the Resistance Level and Seller Zone around 94,700, where a test is expected. My scenario: as long as BTCUSDT holds above the Buyer Zone and the rising support line, the bullish bias remains intact. I expect price to retest the 94,700 Resistance, with TP1 aligned near this level. A clean breakout and acceptance above resistance would confirm bullish continuation and open the door for higher targets. However, a strong rejection from the Seller Zone followed by a breakdown below support would invalidate the bullish scenario and suggest a deeper corrective move. Please share this idea with your friends and click Boost 🚀

Bitcoin Reversal Structure Confirmed? $94K Is the Key LevelBitcoin is printing a high-confidence bullish reversal structure in the form of an Adam & Eve pattern, signaling a clear shift in market behavior after the recent corrective phase. The $94K level remains the critical neckline and a major resistance area, where price reaction will determine confirmation. A sustained breakout and acceptance above $94K would validate the setup and open the path toward the projected $110K target.
Until confirmation is achieved, attention should remain on the immediate demand zone, as holding this level is essential to maintain the bullish reversal thesis.

BTC/USD H4 – Pausing to Consolidate the UptrendHello everyone,
Looking at the BTC/USD H4 chart, what stands out to me is not the few recent red candles, but the way the market is slowing down after a very decisive rally. After moving from the 88,000 area up toward nearly 95,000, Bitcoin has started to cool off and pull back into the 92,000–93,000 zone. To me, this is a fairly natural price reaction following a strong advance, as capital needs time to rebalance before the market commits to its next directional move.
From a technical standpoint, the medium-term bullish bias has not been compromised. Price is currently pulling back into the confluence zone of EMA 34 and EMA 89 — an area that often acts as a “support base” within a healthy trend. The fact that BTC continues to hold above the slower EMA suggests that bullish momentum has not been broken, and that the current retracement is more consistent with short-term profit-taking than with genuine distribution.
A constructive detail lies in the price behavior during the recent pullback. Selling volume has not expanded, while the corrective candles show narrower ranges compared to the prior impulsive advance. This indicates that supply pressure is fading, while buyers have not stepped aside. Historically, this type of price action often leads to a brief consolidation phase before the market resumes its primary direction.
Stepping back from the chart to look at the broader context, the current macro backdrop remains supportive for Bitcoin. Recent US economic data point to easing inflation while growth remains moderate. This makes a shift toward a more aggressive monetary stance less likely, helping to preserve a relatively stable “risk-on” environment for risk assets.
In addition, early-year market sentiment has improved noticeably after the holiday period.
Capital is flowing back into equities and crypto, and Bitcoin is often among the first beneficiaries when risk appetite improves. Reports from international financial media also suggest that institutional money has not exited the market, but is instead repositioning after the strong year-end rally — a narrative that aligns well with what the H4 chart is currently showing.

DOGEUSDT - Consolidation after growth is a positive signBINANCE:DOGEUSDT is testing resistance, but the coin is not going to reverse yet. Focus on the current consolidation at 0.145 - 0.1534. A long squeeze or a breakout of resistance could trigger growth.
Bitcoin has been growing throughout the week, forming a retest of resistance. If the growth continues, it could support a bullish run in altcoins.
After the rally, DOGE moved into consolidation at 0.145 - 0.1533. The market is showing positive dynamics. The altcoin may test the consolidation support before growing. However, a breakout of the 0.1533 resistance and a close above the level could trigger an early rise.
Resistance levels: 0.1534, 0.1648
Support levels: 0.145, 0.139
Regarding the current consolidation in the trading range format, I highlight two levels: 0.1534 and 0.145. If the overall positive background persists, a false breakdown of support at 0.145 or a breakout of resistance at 0.1534 with the price closing above the level could trigger further growth towards the local zone of interest at 0.165.
Best regards, R. Linda!

BTCUSDT: Bullish Structure Intact - Targeting 93K ResistanceHello everyone, here is my breakdown of the current BTCUSDT setup.
Market Analysis
BTCUSDT previously traded inside a well-defined consolidation range, where price moved sideways and volatility was compressed, showing balance between buyers and sellers. During this phase, multiple internal swings failed to establish a clear trend direction. Before the range, price experienced several fake breakouts near the upper highs, highlighting strong selling pressure inside the 93,000 Resistance Zone, where buyers repeatedly failed to gain acceptance.
Currently, price is trading above the support zone and consolidating below the key 93,000 Resistance, where selling pressure previously emerged. The structure remains constructive, with higher highs and higher lows still intact, suggesting the move is corrective rather than a full reversal.
My Scenario & Strategy
My primary scenario: as long as BTCUSDT holds above the 90,800 Support Zone and respects the rising trend line, the bullish bias remains valid. I expect price to consolidate and potentially push higher toward the 93,000 Resistance, which acts as the next major upside objective (TP1). A clean breakout and acceptance above the resistance zone would confirm bullish continuation and open the door for further upside expansion.
However, a decisive breakdown below support and the trend line would invalidate the long setup and signal a return to range behavior or deeper correction. For now, buyers remain in control while support holds.
That's the setup I'm tracking. Thank you for your attention, and always manage your risk.

How to audit your own trades like a risk manager would Auditing your trades is not about replaying charts to confirm whether you were right or wrong. A risk manager audits to protect capital durability, reduce mistake frequency, and identify exposures created by process, not emotion. When you adopt this mindset, performance leaks become easy to detect and easier to correct.
A professional audit begins with environment classification. Every trade is labeled by the market phase it was executed in. Volatility is assessed as expanding or compressing. Liquidity incentives are identified before execution, not after it. For example, BTCUSDT and SOLUSDT produce wider candle ranges during expansion and thinner order books when liquidity drains. These are high-invalidation conditions. If you increased size here, you paid an execution tax without a volatility reason. A risk manager never scales into widening ranges. They scale into tightening ranges.
The second step is measuring invalidation distance. Risk officers place stops beyond structure, not arbitrary percentages. A stop below a random 1% or 2% rule means nothing if the structure required 3.5% distance to invalidate the narrative. Your stop must sit beyond the point where the market proves the opposite story. If your invalidation distance widens while volatility expands, that is alignment. If it widens while volatility contracts, that is a process breach.
Next comes execution quality scoring. Professionals deconstruct execution into sequence components: liquidity sweep first, micro-structure break second, displacement third, retest respected fourth, impulse continuation fifth. A trade that triggered on the first touch of a level without displacement is not a good fill. It is the fill the market used for liquidity. Score execution quality based on whether the sequence completed before entry, not whether the P&L was positive.
The fourth layer is correlation risk. Risk auditors measure how many positions were open simultaneously on the same asset or narrative theme. One trade rarely kills a small account. Correlated trades during the same thesis do. Mistake correlation compounds drawdown faster than strategy flaws ever could. Limit correlation by design, not hindsight.
Finally, audit outcomes against process wins. A trade that worked without a reason is not audit approval. A trade that worked because it followed a reasoned sequence is. When you measure behavior instead of candles, you gain intervention points. Intervention points protect capital. Reflection points identify capital already lost.
Small accounts scale when traders audit like capital protection matters more than capturing the entire move. Your audit should produce fewer open questions and more closed rules. The goal is not to defend the trade. The goal is to defend the account.

ETH Breaking Out of a Rising Wedge – Bullish Continuation SetupETH Breaking Out of a Rising Wedge – Bullish Continuation Setup
Ethereum is showing strength after completed a tringle pattern.
Price is indicating a clear bullish breakout and shift in momentum.
If ETH continues to respect this pattern then it can reach the first target soon around 3,270, followed by a higher resistance zone near 3,450, which previously acted as a strong supply area.
So far the pattern look strong and the time that ETH spent in correction was high so the chances for even a bigger bullish wave could be high.
You may find more details in the chart!
Thank you and Good Luck!
PS: Please support with a like or comment if you find this analysis useful for your trading day

Bitcoin - Range High Pressure, Expansion or Rejection AheadHappy New Year everyone 🎉
I hope you all had a great start to the year. I have been offline for a while due to holidays and some personal stuff, but I am back and ready to start posting trade ideas again. Let’s kick things off with a fresh look at Bitcoin based on the chart I shared.
Market Overview
Bitcoin has been in a corrective and consolidative phase after the impulsive move down, and price is now trading back into a very clear range. The market structure has shifted from aggressive selling into more balanced, rotational price action, which tells me the market is waiting for a catalyst. Price is currently pushing into the top of this range, an area that has already proven to be meaningful resistance.
Range Structure and Key Zones
The chart shows a well defined range with a clean support zone at the low of the range and a clear resistance zone at the top. These zones have been respected multiple times, which adds confidence to their validity. Right now, price is testing the top of the range, which is the current resistance, and this is where reactions are expected. Until we see a decisive break, this remains a range environment, not a trend.
Bullish Scenario and Expansion Idea
If Bitcoin manages to accept above the top of the range, this opens the door for continuation higher. Of course, we are going to have to break the 100k price range first, but if that happens with strong participation and volume, the potential target marked on the chart becomes realistic. In that case, dips into prior resistance could act as support, and price could start building higher highs and higher lows from there.
Bearish Scenario and Rejection Risk
On the other hand, this area is still resistance until proven otherwise. A rejection from the top of the range would fit perfectly within the current range logic. If buyers fail to hold this level, price can rotate back down through the range and revisit the low of the range, which is the current support. This would keep Bitcoin stuck in consolidation and delay any larger expansion move.
What I Am Watching Now
The most important thing for me here is acceptance or rejection at the top of the range. I want to see how price behaves inside and around this resistance zone. Strong follow through favors the upside scenario, while weak closes and rejection wicks increase the probability of another rotation lower. Patience is key here, the range will eventually break, but timing matters.
Conclusion
Bitcoin is at a decision point. The range is clearly defined, the key levels are obvious, and price is now testing the upper boundary. Whether we see expansion toward the potential target or a rotation back toward support will depend on how price reacts at this resistance. Until the market shows its hand, respecting the range and letting price confirm is the smartest approach.
___________________________________
Thanks for your support!
If you found this idea helpful or learned something new, drop a like 👍 and leave a comment, I’d love to hear your thoughts! 🚀

Elise | BTCUSD – M30 | Bearish Structure ContinuationBITSTAMP:BTCUSD
After a strong impulsive rally from the accumulation zone, BTC failed to hold higher structure and printed a decisive bearish continuation move. The breakdown was followed by weak retracements, indicating a lack of strong buying interest. Current price action suggests distribution within the channel rather than reversal, with sell-side liquidity still exposed below recent lows.
Key Scenarios
❌ Bearish Case 📉 (Primary)
– Rejection from descending channel resistance
– Continuation below recent structure lows
🎯 Target 1: 90,500
🎯 Target 2: 89,200
🎯 Target 3: Sell-side liquidity below range lows
✅ Bullish Case 🚀 (Conditional Only)
– Strong impulsive move with acceptance above the last lower high
– 30M close above channel resistance required
🎯 Upside targets valid only after structure reclaim
Current Levels to Watch
Resistance 🔴: Descending channel upper boundary
Support 🟢: Range low / sell-side liquidity zone
⚠️ Disclaimer: This analysis is for educational purposes only. It is not financial advice. Please conduct your own research before trading.

Risk Reward and Win Ratio - How to make $20K with just a 6R“I need to win more trades to be profitable.”
You don’t. Some of the most profitable traders I’ve studied and watched over the years win less than 50% of the time, and they still print money because their winners are built to pay for their losers. The real edge is not how often you win. The real edge is how much you win when you’re right compared to how much you lose when you’re wrong. That’s risk reward.
📌 1.Win rate alone means nothing if the math is against you
Win rate only tells you how often you end up on the right side of the move, but it does not tell you whether your account grows. You can win 70% of your trades and still lose over time if you’re risking too much to make too little, because those few losses wipe out a whole week of “small wins” and you end up trapped in a cycle where you feel good but your equity curve quietly drifts down. On the other hand, you can win only 40% of the time and still grow consistently if your winners are designed to be larger than your losers. In that scenario, you don’t need to be right often, you just need to be right enough, and that simple shift changes everything because it stops trading from being emotional and turns it into a numbers game you can actually manage. Win rate is frequency, but risk reward is impact, and impact is what pays you.
📌 2. Risk must be defined before you even think about profit
Most beginners start with the exciting part, which is targets and profits, but professionals start with the boring part, which is invalidation. That means the first thing you define is the level that proves your idea is wrong, and once that level is clear, the trade becomes clean because you’re not guessing anymore, you’re executing a plan that already includes a stop and a reason for that stop. Before I enter, I want clear answers to questions like: where is my idea wrong, where would structure have to break for me to admit I’m wrong, and where must I be out without negotiation. Only after that do targets start making sense. If you don’t know where you’re wrong, you don’t know what you’re trading, and if you don’t know what you’re trading, you’re basically gambling while pretending it’s analysis. 📌 3 .Good risk reward builds emotional stability, not just profit
This part is underrated, but it’s the reason most traders fail even with a decent strategy. When your risk is small and predefined, your losses stop feeling like personal attacks, and they start feeling like normal business expenses. You don’t hesitate as much because you’re not afraid of the outcome, you don’t revenge trade as much because one loss doesn’t crush you, and you don’t overtrade as much because you’re not trying to “fix” your day. You dont do nothing like that because you know distribution of trades can be random.
You may have a 65% percent win rate. It still means that you can have 35 losses out of 100 traders. Remember distribution of wins and losses is random , you never know outcome of next trade.
It could be win win loss win. Or loss loss loss win win. Or a brutal streak of seven losses before the market pays you back.
✅✅❌✅❌❌✅✅✅✅❌✅
When wins and losses are evenly distributed it's quite comfortable to continue in opening new trades. You still believe your strategy and it's simply normal to have loss time to time.
✅❌❌❌✅❌❌❌❌❌✅✅
But what you gonna do when such a streak comes? Are you gonna doubt your strategy? Are you gonna look for different strategy? Remember 65% success rate means 35 possible losses out of 100. If 20 losses comes in a row your long term statistics still was not broken.
Dont think this cant happen to you. If this didnt happen to you yet, you are not trading for long enough. It will come and it's better to be prepared. The reason is simple: no single trade can hurt you badly when risk is controlled. That’s why risk reward is not only account protection, it’s mindset protection, because your mind is your execution engine, and when it’s unstable you will sabotage even a good setup.
📌 4. Consistency is built in losing streaks
A lot of traders think consistency is about getting into a flow where everything goes right, but real consistency is about surviving the period when everything goes wrong without changing your system every two days. Winning streaks feel easy because confidence is high and everything seems to confirm your bias, but losing streaks are where discipline gets tested, because that’s when the brain starts whispering that the strategy is broken and you should start “improving” it in the middle of execution.
‼️ The big lesson
You don’t need to be right more often. You need your winners to matter more than your losers. When risk is controlled and reward is logical, trading stops feeling like a casino and starts feeling like execution, and the difference between those two states is literally the difference between a trader who survives and a trader who quits.
Now let’s go deeper, because this is where “good advice” becomes a real plan.
A statistical edge only becomes real through a mechanical you backtests on a large sample, you can start building expectations that are grounded in reality, like win rate, average risk reward, average drawdown, and the typical losing streak you should be prepared for.
Let’s say your backtest results look like this:
Win rate: 65%
Average RR: 2.3
That means for every $100 you risk, your average win is $230, and your average loss is $100. On paper, that looks like a smooth road to profits, and it can be, but only if you understand one brutal truth: reality is always worse than backtest. In real trading you will enter worse, exit earlier, hesitate, get slipped, pay spread, misread a level, or just have a bad day mentally, so your real performance will usually drop below your backtest numbers. 🧩 Your ability to hold matters more than your ability to enter
A lot of traders chase big RR trades like 1:5 because it looks sexy, but what they forget is that higher RR often comes with a lower win rate and more painful pullbacks. That means you might get stopped out several times before you catch the one big move, and even when you catch it, the trade will likely pull back enough to test your emotions. So the real question is not “can I find 1:5 setups,” the real question is “can I hold them without self-sabotage,” because if you can’t hold, you’ll never realize that RR anyway.
💎 Hence Im suggesting RR 2.3 Its what is working for me for years and this is usually target which I can reach without holding in overextended period and without huge pullbacks. Where I have to watch flowing profits back to the markets.
🧩 “$20,000 per month” goal, and why most traders approach it backward
Most traders try to hit big monthly percentage gains, and that’s where they lose discipline. In prop trading, the smarter route is to aim for consistent, modest growth and scale capital under management, because the payouts get big when the base gets big, not when your ego gets big.
🧩 The magic number in prop trading is 3% per month
3% sounds small until you do the payout math, and then you realize it’s enough to change your life if you scale properly. It’s also realistic enough that you don’t have to break your rules to achieve it, and that’s the entire point. 📌 How to make $20 000 a month ? Magic of 3%
Yes, you actually need to make only a 3% a month. Is it difficult ? No, It's not. You need 3 wins with 1:2 RR while risking 0.5% Risk.
1️⃣Your Ultimate goal - -$100K Funded account - 3% Gain - 80% Profit split = $2400 Payout
2️⃣Let's take it to $20 000 a Month
Don't try to increase your % gains per month, increase your capital under management
- Get another 4 x $ 100K Challenges pass them - You will have $500K AUM:
- $ 500 000 - 3% Gain - 80% Profit split = $12 000
3️⃣Reinvest buy another 3 - 5 challenges aim for $ 1000 000 funded across few solid props firms.
Now scale it instead of forcing it.
If you build to $500K funded across a few accounts, the same 3% month becomes:
$500,000 x 3% = $15,000 profit
80% split = $12,000 payout
And if you scale to $1,000,000 funded across solid firms, you’re looking at:
$1,000,000 x 3% = $30,000 profit
80% split = $24,000 payout This is why the path is patience, not pressure
This doesn’t happen in a few weeks. It’s a year plan for most people. The technical part is not the issue, the discipline is. My biggest mistakes in the past were always the same: trying to pass too quickly, forcing trades when the market was not giving my setup, and gambling during drawdowns because I wanted to “get back” to breakeven faster. That thinking is expensive.
🧩 Long-term plans require real planning, not motivation
Set aside 60 minutes, and treat this like a real project. Write answers on paper, not in your head.
What is my monthly target in % and in payout?
What is my fixed risk per trade?
What is my max daily loss?
What is my weekly trade limit?
What are my A+ setups and what is banned?
What will I do when a losing streak hits, so I don’t break rules?
🧠 Don’t fall for the fantasy
If you don’t trade well on a small account, a prop account will not fix you. Funding is leverage for skill, not a rescue plan for chaos, and expecting it to solve financial pressure is how people start gambling. 🧠 Trading is not hard, we overcomplicate it
Most traders already have enough good trades in a month to hit 3%. The real problem is they add too many unnecessary trades that drain the account. If you removed the bored trades, the revenge trades, and the “maybe” trades, you’d be shocked how close you already are.
🔑 Write this somewhere you will see it every day:
$1,000,000 funded
3% gain
80% profit split
$24,000 payout
I promised myself I’d become the person I once needed the most as a beginner. Below are links to a powerful lessons I shared on Tradingview. Hope it can help you avoid years of trial and error I went thru.
📊 Sharpen your trading Strategy
⚙️ 100% Mechanical System - Complete Strategy
🔁 Daily Bias – Continuation
🔄 Daily Bias – Reversal
🧱 Key Level – Order Block
📉 How to Buy Lows and Sell Highs
🎯 Dealing Range – Enter on pullbacks
💧 Liquidity – Basics to understand
🕒 Timeframe Alignments
🚫 Market Narratives – Avoid traps
🐢 Turtle Soup Master – High reward method
🧘 How to stop overcomplicating trading
🕰️ Day Trading Cheat Code – Sessions
🇬🇧 London Session Trading
🔍 SMT Divergence – Secret Smart Money signal
📐 Standard Deviations – Predict future targets
🎣 Stop Hunt Trading
💧 Liquidity Sweep Mastery
🔪 Asia Session Setups
🧠 Level Up your Mindset
🛕 Monk Mode – Transition from 9–5 to full-time trading
⚠️ Trading Enemies – Habits that destroy success
🔄 Trader’s Routine – Build discipline daily
💪 Get Funded - $20 000 Monthly Plan
🧪 Winning Trading Plan
🛡️ Risk Management
🏦 Risk Management for Prop Trading
📏 Risk in % or Fixed Position Size
🔐 Risk Per Trade – Keep consistency
Adapt useful, Reject useless and add what is specifically yours.
David Perk

Bitcoin Currently an impulsive a key resistanceBitcoin is currently consolidating after an impulsive rally into a key resistance zone near 94K. Price action around this level is critical, as it will likely determine whether BTC continues toward new highs or undergoes a deeper retracement toward structural support.
Despite edging slightly lower, Bitcoin remains above the key 90K psychological level, supported by a modest recovery since the start of the new year. Broader market sentiment has improved, with U.S. equities rallying overnight—both the Dow Jones Industrial Average and the S&P 500 posted new record highs, providing a supportive macro backdrop for risk assets.
From a technical perspective, Bitcoin’s strong advance stalled near 94K, where increased selling pressure emerged. A decisive breakout above this resistance could open the door for continuation toward 95K / $98K.
However, failure to reclaim and hold above 94K may trigger a pullback. In that scenario, the chart suggests potential downside toward 88K , with a deeper retracement possibly reaching 85,500, both of which represent important structural support zones.
You may find more details in the chart,
Trade wisely best of luck buddies.
Ps; Support with like and comments for better analysis thanks for supporting.

Dogecoin (DOGE): Now or Never | Seeing Bullish SignsDOGE is offering too good of an R:R setup not to try from here. After a long period of downside pressure, we finally saw a decent market structure break, which gave the first green signal for a potential upside move.
Right now, the focus is on the 200 EMA. Once it gets broken and secured, we should see a strong continuation to the upside, possibly turning into a parabolic move. Until that happens, we wait for confirmation.
Swallow Academy

Rejection from Supply Zone Signals Potential Pullback to Key Dem
This is a 2-hour BTC/USD chart showing a structured market move framed by clear supply and demand zones
Supply Zone (Top, ~94k–95k
Price rallies into this upper resistance area and gets rejected, indicating strong selling pressure and exhaustion of the bullish move.
Demand Zone (Bottom, ~86k–87k):
A well-defined accumulation area where buyers previously stepped in, acting as a likely downside magnet if price continues lower.
Ascending Channel:
BTC previously trended higher within a rising channel, making higher highs and higher lows. The recent price action shows a **breakdown from the channel**, signaling weakening bullish momentum.
Consolidation & Key Levels:
The horizontal zone around ~89,978 marks a former consolidation and key support. Price is currently hovering near this level, suggesting it is a critical decision point.
Bearish Projection:
The dashed levels and downward arrows indicate a potential continuation lower with targets first near 87,756 and possibly deeper toward the demand zone if support fails.
Overall Interpretation:
The chart suggests a short-term bearish correction after a strong uptrend, driven by rejection at supply. Unless BTC reclaims the broken channel and consolidation support, price is likely to seek liquidity at lower demand levels before any meaningful bounce.
