Futures market

How a Single Put Spread Predicted Gold’s BreakdownSo, gold has broken below the previous bearish zone — meaning we now have a bearish sentiment in play (at least according to my classification).
Now, regarding options flow:
On the chart, I’ve highlighted those lucky (or rather, well-informed) players who entered with a Put Spread — just before the correction started.
Perfect timing.
Their ideal target?
$3,950 — to be reached within 8 days, right around expiry.
Or at least close enough for maximum profit.
p.s. Just to be clear:
We are not teaching options trading as such — even though much of my methodology is built on options market data.
What we are doing is showing you how to read the option sentiment and use that insight to trade more effectively on the markets you already know — like spot Forex.
It’s about understanding why price moves — before it does.
We believe that trading without using options sentiment analysis is similar to fishing with a fishing rod🤦🏻♂️ on the shore while your neighbor has arrived at the river with a sonar on a boat.
We are on that boat, and we want to help you make better trading decision.💰

BULLISH ON XAUUSDBullish Momentum Ahead.
-Touch/Retest on the previous support.
-Im still expecting a drop before or after highlighted move (later on in the day if not week)
-With that being said im still expecting crazy market movement (fake outs;wicks etc)
-Bullish Confirmations:
4HR TF touch on rectangle support zone.
1HR TF new buy candle formed & closed above.
15MTF continuation flag.
-Anything can still happen; hence im expecting to types of entries.
Lets see....

SILVER Trading Opportunity! BUY!
My dear subscribers,
My technical analysis for SILVER is below:
The price is coiling around a solid key level - 50.560
Bias - Bullish
Technical Indicators: Pivot Points Low anticipates a potential price reversal.
Super trend shows a clear buy, giving a perfect indicators' convergence.
Goal - 51.903
My Stop Loss - 49.919
About Used Indicators:
By the very nature of the supertrend indicator, it offers firm support and resistance levels for traders to enter and exit trades. Additionally, it also provides signals for setting stop losses
Disclosure: I am part of Trade Nation's Influencer program and receive a monthly fee for using their TradingView charts in my analysis.
———————————
WISH YOU ALL LUCK

XAUUSD PLAN & IMPORTANT LEVELS FOR INTRADAY ( 17 NOV 25 )This chart shows the important support and resistance levels for OANDA:XAUUSD on the 30-minute timeframe. The price recently made a sharp fall from the upper resistance zone, and it is now holding above a minor support area. The market is trying to pull back, but the overall structure still looks bearish.
My plan is simple. If the price moves back into FX:XAUUSD the highlighted supply zone, I will wait for signs of rejection. If a clear bearish signal appears, I expect the market to continue falling towards the lower support near the green line. However, if the price breaks above the supply zone with strong momentum, then the bearish idea will be invalid for the moment.
Lets wait for a cleaner entry instead of rushing into trades.

XAU/USD – Retracement Before Next Leg UpGold (XAU/USD) has pulled back after testing the upper boundary of the descending trendline around US $4,230–4,250. The rejection there was expected, as this level has acted as a major dynamic resistance since early October. Despite the drop, price is still trading within a broader ascending channel, suggesting that the current move is a healthy retracement inside an ongoing uptrend.
Potential W-shaped correction forming, with multiple buy invalidation levels highlighted. This structure often appears mid-trend when the market is resetting liquidity before continuation.
🧠 Technical Outlook
Price remains inside the rising channel, respecting both upper and lower boundaries.
The rejection at the descending trendline aligns perfectly with previous swing highs — a natural area for sellers.
A deeper pullback into the 4,000–4,020 region is possible before buyers step back in.
If the W-correction completes, a bounce from the lower channel boundary could send price back toward 4,160–4,200, and eventually retest the descending trendline again.
Buy Invalidation #1: A break below 4,000 weakens the bullish structure.
Buy Invalidation #3: A break below 3,900–3,880 fully invalidates the upside scenario and opens the door to deeper declines.
The overall structure still favors bullish continuation, as long as price stays above the lower channel line.
🌍 Fundamental View – November 2025
Fed Outlook: The Federal Reserve kept rates unchanged in late October but signaled openness to rate cuts in early 2026 as economic data cools. This continues to underpin gold sentiment.
USD & Yields: The U.S. dollar has shown a mild rebound this week, creating short-term pressure on gold — aligning with the current dip on the chart.
Inflation: Sticky inflation around 3.2% limits how high real yields can climb, helping maintain gold’s medium-term bullish bias.
Geopolitics: Persistent tensions across the Middle East keep safe-haven demand stable, contributing to deep pullbacks being bought quickly.
In short, the fundamentals still support gold’s broader uptrend, even if a short-term correction unfolds.
⚖️ Trading Plan
Bias: Bullish continuation after a corrective pullback
Watch Zone for Buys: 4,000–4,020 (channel support & correction completion zone)
Upside Targets:
4,160
4,200
Retest of 4,230–4,250 descending trendline
Invalidation Levels:
#1: Below 4,000 (structure weakens)
#3: Below 3,900–3,880 (bullish idea invalid)
Summary:
Gold is correcting inside a rising channel, and as long as price holds above the lower boundary, the structure favors another bullish leg toward 4,160–4,250. The W-pattern on your chart supports a scenario where buyers re-enter after liquidity is swept from lower levels.

XAUUSD short Hello traders
Gold may drop to 3715
it is my ananlysys Entry now 3968
TP 3715
Stop loss 3990

XAUUSD: Trend in 30-Min timeframeThe color levels are very accurate levels of support and resistance in different time frames, and we have to wait for their reaction in these areas.
You should be noted, that we have two trend (green & purple)
So, Please pay special attention to the very accurate trend, colored levels, accurate channel and you must know that SETUP is very very sensitive.
Be careful
BEST
MT

Gold trading settings!Internal falling wedge created. Manage your risk properly!
ENTRY: 4090
TP1: 4180
TP2: 4200
SL: 4027

2026 Gold Satellite Market is making no sense, chart can give 0 signal, demand and seller are gambling every day.
Money = power
power need a brain if without then you'll live like a fool.
passion and waiting will open doors
stay back and watch
something will happen before summer and we have to be ready to take a ticket.
this is my view and my last post.
we will meet again next year, i hope so.

XAUUSD – Drop → Sweep → Explode UpGold is currently in a temporary bearish correction, but the macro trend remains bullish. Price is approaching a major demand zone where a strong reversal is expected.
This setup is built around liquidity engineering, market structure, and institutional order-flow.

GOLD ( XAUUSD ) Buying Trade idea From the Support LevelHello Traders
In This Chart GOLD HOURLY Forex Forecast By FOREX PLANET
today Gold analysis 👆
🟢This Chart includes_ (GOLD market update)
🟢What is The Next Opportunity on GOLD Market
🟢how to Enter to the Valid Entry With Assurance Profit
This CHART is For Trader's that Want to Improve Their Technical Analysis Skills and Their Trading By Understanding How To Analyze The Market Using Multiple Timeframes and Understanding The Bigger Picture on the Charts

GOLD IDEASWe anticipate GOLD to reject the +D1 C.E and respect the upper Quadrant and continue higher to HTF Bullish momentum.
NB; If Gold does not respect the C.E and upper Quadrant of the D1 FVG, and instead close below the C.E we'll be anticipating a sell-off.
Safe Trading!

Gold. Where to short for 6150 pips. 16/Nov/25Xauusd have formed a pivot for downtrend at 4245.195. Trend will continue decline untill mid of December 2025..

XAUUSD | Rejection From Premium Zone — Targeting Sell-Side LiqGold has pulled into a premium retracement zone (0.5–0.618 Fib) aligning perfectly with the Daily Wick 50% + previous structure flip level (4,122 zone).
This zone acted as a strong supply block, causing an immediate reaction, confirming bearish order flow.
Price is currently forming distribution under the premium zone, signaling potential continuation downward.
🔍 Detailed Breakdown:
HTF Bias: Bearish below 4,122
Retracement: Into 0.5–0.618 Fib + Daily Wick 50%
Zone of Interest: 4,122 – 4,110 (strong rejection zone)
Current Structure: Lower highs forming → distribution
Liquidity Targets:
4,027 (first liquidity pocket)
4,005 (major sell-side liquidity)
4,000 – 3,995 (extended target if momentum accelerates)
📉 Bearish Confirmation:
A clean rejection from the premium zone + multiple liquidity sweeps at the top indicates smart money shifting direction.
📌 What I’m Watching:
If XAU retests the 4,110–4,122 zone and fails to break above structure →
Expecting a clean sell-off into sell-side liquidity levels.
📚 Concepts Used: Liquidity | Imbalance | SMC | Premium vs Discount | Fib Retracement | Market Structure Shift

Gold price opening trend after the plunge
News:
Spot gold prices plunged 2% on Friday (November 14th) as hawkish comments from Federal Reserve officials dampened market expectations for a December rate cut, triggering a massive sell-off.
Gold itself does not earn interest and typically performs well in low-interest-rate environments, and is also seen as a safe haven during times of economic uncertainty.
With the US government shutdown ending, investors are awaiting clearer information on how the backlog of economic data will be processed and how this data will reflect the state of the US economy.
Technical aspects:
From a 1-hour technical analysis perspective, the daily chart closed bearish, indicating a significant drop and strong short-term upward pressure. Market sentiment is less optimistic, and the 4000 level is crucial. If it holds, the price may consolidate for a while; however, a break below this level could see gold prices fall to around 3930 or even lower, potentially finding support near 3885.
On the 4-hour chart, the price is in a consolidation phase. If it can recover lost ground and reclaim key moving averages, the bulls still have some hope; otherwise, the bears may continue their aggressive selling.
Trading strategy:
Buy:4115-4110, SL: 4125, TP: 4065-4020

XAUUSD SILVER DAILY PERSPECTIVE SILVER CURRENT = 50.538
the daily price action gave us head and shoulder and came beck to retest the neckline in the form of ascending trendline and the weekly line chart close provided extra layer of resistance at 54.27 and was backed by sell catalyst from structural perspective .
as the market open i will apply 3-1 rule for retest into broken demand floor in the zone of 51.900-51.456 .if this analysis go as planed then i will hold sell into 49.032 while watching the dollar index and united states 10 year treasury bond yield .
the next support zone will 45.700- 45.300
the next support zone will be 41.241 and 50% of the rally using Fibonacci strategy.
Silver fundamental.
Fundamentals of Silver
Silver is a precious metal with a dual role as both an investment asset and an industrial commodity.
Its price is influenced by factors such as inflation, industrial demand, investment flows, and geopolitical risks.
Silver market has faced a structural deficit for several years, with supply consistently falling short of demand, supporting upward price pressure.
Investment demand remains robust, driven by ETFs, bullion purchases, and as a hedge against inflation and currency risk.
Key Uses of Silver
Industrial Applications (Approx. 56% of demand):
Electronics and electrical contacts due to excellent conductivity
Solar photovoltaic (solar panels) industry for clean energy production
Automotive industry, especially in electric vehicles (EVs) for battery and electronics components
Medical uses due to antimicrobial properties
5G infrastructure, advanced computing, and IoT devices
Jewelry and Silverware: Traditional uses driving consistent demand
Investment: Physical silver, ETFs, coins, and bars for hedging and portfolio diversification
Countries with the Highest Silver Deposits (Reserves)
Rank Country Silver Reserves (Metric Tons) Approximate Share of Global Reserves (%)
1 Peru 140,000 17.5%
2 Russia 92,000 14.7%
3 Australia 94,000 15.0%
4 China 72,000 11.5%
5 Poland 63,000 10.0%
6 Mexico 37,000 5.9%
7 Chile 26,000 4.2%
8 United States 23,000 3.7%
9 Bolivia 22,000 3.5%
10 Argentina 23,000 3.7%
Peru is the world leader in silver reserves, followed closely by Australia and Russia.
Mexico leads as the largest silver producer.
These deposits form the backbone of global silver supply and significantly impact price dynamics.
Summary
Silver is a critical industrial metal with growing applications in electronics, clean energy, and medical technology, supported by strong investment demand.
GOODLUCK

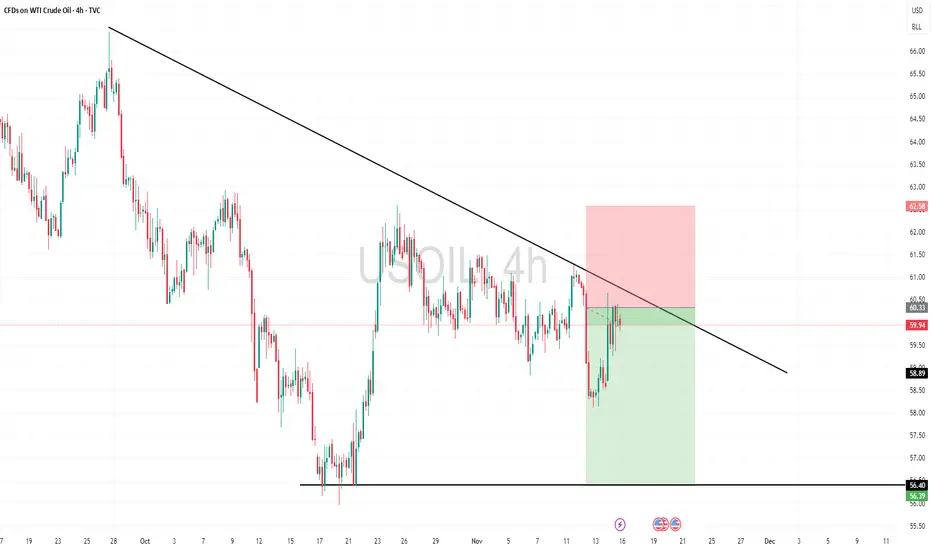
US-Oil will further push Down-sideHello Traders
In This Chart xtiusd HOURLY Forex Forecast By FOREX PLANET
today XTIUSD analysis 👆
🟢This Chart includes_ (XTIUSD market update)
🟢What is The Next Opportunity on XTIUSD Market
🟢how to Enter to the Valid Entry With Assurance Profit
This CHART is For Trader's that Want to Improve Their Technical Analysis Skills and Their Trading By Understanding How To Analyze The Market Using Multiple Timeframes and Understanding The Bigger Picture on the Charts
XAUUSD Bearish📉 XAUUSD Short Setup
EMA rejection
Trendline break
Structure shift to the downside
4H bearish rejection confirmation

XAUUSD meltdown before hitting new all time high$Guess before the price race for the moon we already respected the Weekly Bearish Imbalance nd closed the week with rejection wick...… I anticipate price to target HTF equilibrium and the Monthly FVG before I look for any buys.

XAUUSD LongBuy @ 3980
TP 4036
I'm not a story teller, neither i trade on news.
The only story what u should be reading is the chart itself

Ascending triangle gaps end of earnings (just about) correction?All the earnings releases and positive impact of business investment in AI gave the market anther move higher, but what now everything is so stretched gaps appearing and a negative pattern suggest a correction, the question how far ?

XAU/USD — Bullish Continuation Setup (4H Chart)Gold (XAU/USD) has been consolidating near US $4,000 after rallying strongly to new highs above US $4,300 earlier this quarter.
Price has since formed a falling wedge / triangle pattern, signaling potential bullish continuation if buyers regain control.
Technical Outlook
Price is compressing between converging trendlines, with clear zones marked on the chart.
Buy confirmation: a breakout and close above 4,020–4,040 would signal bullish momentum.
If confirmed, price could extend toward 4,120–4,180, followed by 4,250+.
Buy invalidation: a breakdown below 3,940 would negate the bullish setup and expose the 3,900–3,860 support zone.
The overall structure remains constructive — a breakout above resistance would complete the wedge and potentially resume the broader uptrend channel.
Fundamental View (November 2025)
Fed policy: The Federal Reserve held rates steady in October but hinted at rate cuts in early 2026, a dovish tilt that supports gold.
Macro conditions: U.S. inflation (~3.2%) remains sticky, and bond yields are easing — reducing pressure on non-yielding assets like gold.
Safe-haven demand: Continued geopolitical tension in the Middle East and strong central-bank purchases (China, India, Turkey) add structural support.
Short-term risk: A brief U.S. dollar rebound may cause intraday volatility, but sentiment remains broadly bullish.
Trading Plan
Bias: Short-term bullish continuation
Breakout trigger: Above 4,020–4,040 (confirmed breakout)
Targets:
‣ TP1: 4,120–4,150
‣ TP2: 4,180–4,250
Invalidation: Below 3,940
