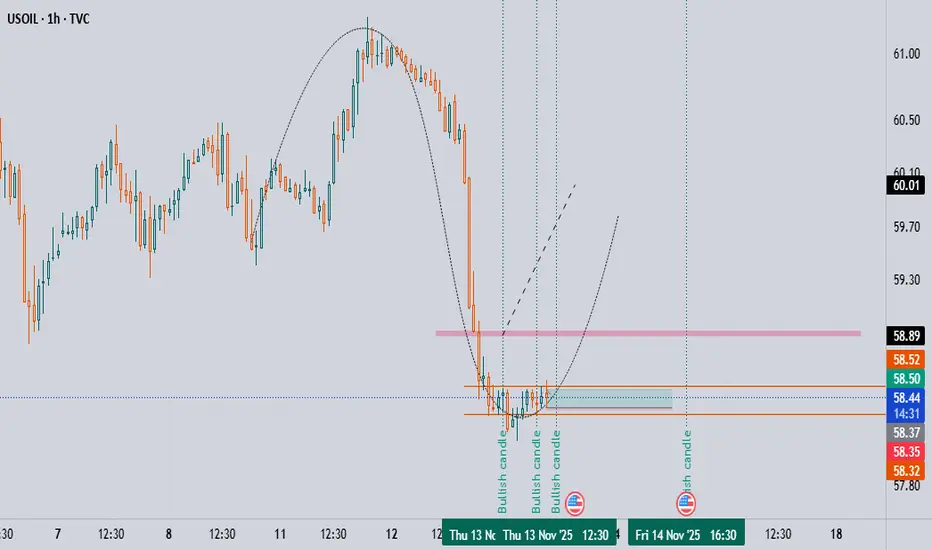
13/11/2025 XAUUSD Ending Diagonal Pattern At Wave 513/11/2025
XAUUSD Outlook
H1 Timeframe
Ending Diagonal Pattern
Possible Reversal
Futures market

XAUUSDGold: The main trend remains up, but after testing the $4,380 level, the price was unable to break above this level and the price declined. We expect this to be a correction, with key support levels at 3,885 and 3,857. If the price can hold above 3,857, there is a high chance that the price will continue to rise.
** Very Risky Trade
🔥Trading futures, forex, CFDs and stocks carries a risk of loss.
Please consider carefully whether such trading is suitable for you.
>>GooD Luck 😊
❤️ Like and subscribe to never miss a new idea!

gold await breakout#XAUUSD price still bullish which decline holds between D1 high to 4252 for main selling rejection.
We await for 2 times breakout below 4220 to buy till 4252 which holds bearish retrace.
Above 4252 breakout sell, target 4180-4150 which holds reverse on buy, SL 4266.
Above the rectangle 4268-72 H1 closure holds bullish continuation till 4310.

Gold Holds 4200, Bulls Eye 4250Gold showed a fluctuating upward trend today, successfully standing firm above the critical 4200 level, with strong bullish momentum. Supported by multiple positive factors, there remains room for further upside, though potential volatility risks should be guarded against.
From the daily chart structure, Gold has steadily broken through the key integer level of 4200 and successfully stood above the 61.8% Fibonacci retracement level of the recent pullback range, presenting a favorable technical pattern. On the indicator front, both RSI and MACD remain in positive territory, indicating sufficient short-term upward momentum.
Key support levels below are concentrated around 4180 and 4100. If these critical levels can be held, the subsequent upward trend is expected to continue; a breakdown below them may trigger technical selling, dragging gold prices toward 4075 or even the psychological threshold of 4000.
If gold can continue to hold firmly above 4200, the next target range is expected to be 4250, with further potential to test 4300.
Trading Strategy:
Buy 4170 - 4180
SL 4160
TP 4210 - 4220 - 4230
Sell 4230 - 4240
SL 4250
TP 4210 - 4220 - 4190

GOLD its continuous buying pattern or something else ???#GOLD .. perfect rise above our expected buying zone that was discussed in our last idea regarding gold and now market just broke his resistance that was on 4229-30
so keep close and sustain above that level can create further volume to upside.
good luck
trade wisely

XAUUSD 13 Nov Intraday AnalysisBullish momentum may persist if the price holds above H4 FVG, with potential for a retracement to take out Asia's low before continuing its uptrend

What will be the outlook for gold against the euro?My take on the path ahead for an ounce of gold against the euro is that we should follow the price growth to 3630 euros per ounce of gold.
Good luck
MJ.REZAEI

CORRECTIVE STILL ONGOINGI still believe a corrective phase ongoing until price break all time high (ATH). In corrective phase in Elliot Wave has many pattern. and now, corrective phase still valid until price break the rules of corrective pattern.

XAU/USD 13 November 2025 Intraday AnalysisH4 Analysis:
-> Swing: Bullish.
-> Internal: Bullish.
Analysis and bias remains the same as analysis dated 20 October 2025.
Price has printed as per previous intraday expectation by printing a bearish CHoCH which indicates, but not confirms, bullish pullback phase initiation.
Price is currently trading within an established internal range, however, I will continue to monitor price with regards to depth of pullback.
Intraday expectation:
Price to continue bearish, react at either discount of 50% internal EQ, or H4 supply zone before targeting weak internal high priced at 4,380.990.
Note:
The Federal Reserve’s sustained dovish stance, coupled with ongoing geopolitical uncertainties, is likely to prolong heightened volatility in the gold market. Given this elevated risk environment, traders should exercise caution and recalibrate risk management strategies to navigate potential price fluctuations effectively.
Additionally, gold pricing remains sensitive to broader macroeconomic developments, including policy decisions under President Trump. Shifts in geopolitical strategy and economic directives could further amplify uncertainty, contributing to market repricing dynamics.
H4 Chart:
M15 Analysis:
-> Swing: Bullish.
-> Internal: Bullish.
Price did not print according to my analysis. Price instead targeted strong internal high by printing a bullish iBOS.
This could potentially indicate H4 bearish pullback phase is complete.
Price has since printed a couple of bearish CHoCH's, however, I will not mark them as such due to very insignificant depth of pullback.
Intraday expectation:
Price to indicate bearish pullback phase initiation by printing a bearish CHoCH. CHoCH positioning is demoted with a blue horizontal dotted line.
Note:
Gold remains highly volatile amid the Federal Reserve's continued dovish stance, persistent and escalating geopolitical uncertainties. Traders should implement robust risk management strategies and remain vigilant, as price swings may become more pronounced in this elevated volatility environment.
Additionally, President Trump’s tariff announcements, particularly against China, are expected to further amplify market turbulence, potentially triggering sharp price fluctuations and whipsaws.
M15 Chart:

XAU/USD Intraday Plan | Bulls Eye 4285 After 4153 BreakoutAfter a short consolidation phase, gold broke above the 4153 resistance and extended higher, now trading around 4236. A clean break and hold above 4234 could open the path for the next resistance at 4285.
If bullish momentum fades, watch the MA50 for potential dynamic support and the Pullback Zone (4153–4115) for a possible retracement area.
Failure to hold that zone could trigger a deeper move toward lower support levels.
📌Key Levels to watch:
Resistance:
4234
4285
4322
Support:
4197
4153
4115
4074
4027
🔎Fundamental Focus:
Today’s calendar is light on major economic data, but multiple FOMC members are scheduled to speak, which could provide hints on future monetary policy direction.

GOLD again breakout ? What's next??#GOLD.. just broke resistance that was 4113-15 around
Sustain above means further rise expected ..
Good luck
Trade wisely

Gold Trade Plan 12/11/2025Dear Traders,
Gold will continue its bullish trend within the corrective phase.
The 4150–4160 zone is very important — if it breaks strongly, I expect the price to move toward the 4190–4200 area.
Regards,
Alireza!

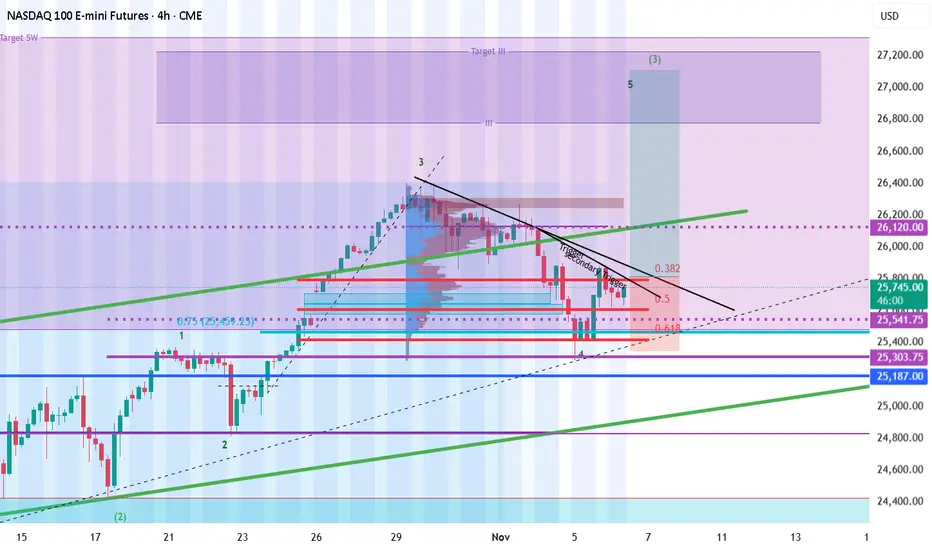
Nasdaq - potential trigger Break for a long targetNasdaq - potential trigger Break for a long target
We are at final point of rebound
We can have a potential 5 wave so, if price will break trigger zone we can have final long wave.
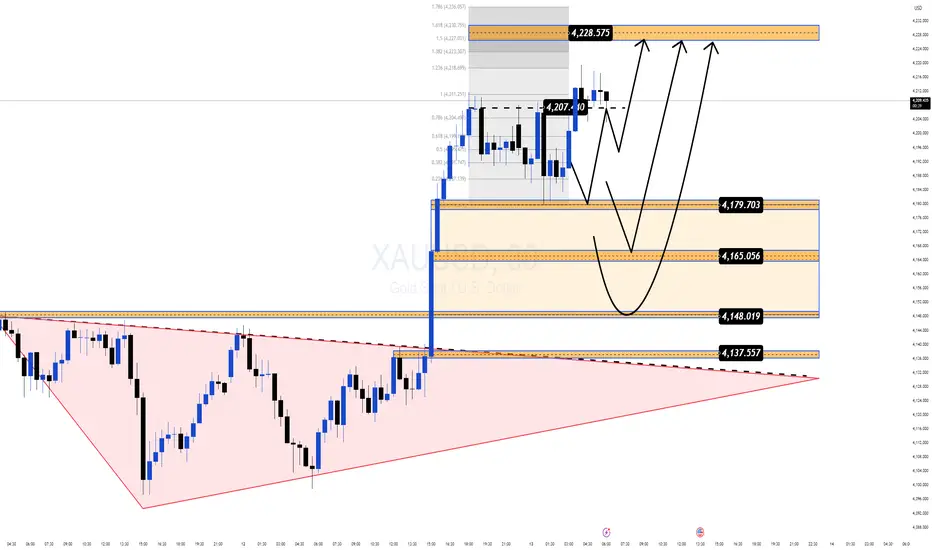
Gold Hits a 3 Week High but the Real Move Might Still Be LoadingGold just tapped $4,213 — the highest level in three weeks, powered by growing expectations of a dovish Fed and optimism around the potential reopening of the US government.
But the real story isn’t the headline spike — it’s the structure forming right beneath it.
📌 Why this zone matters right now
Price is pulling back into $4,179–$4,165, a clean Demand zone aligning with Fibo + breakout structure.
Buyers remain firmly in control despite a mild USD recovery.
The market swept liquidity around $4,207, hinting at accumulation before the next expansion.
The broader pattern resembles a falling-wedge breakout, often appearing before strong upside continuation phases.
🎯 Most Probable Scenario (Mind Insight)
Gold is in a “compression before expansion” phase.
Once this squeeze resolves, momentum is likely to continue in the direction that’s already dominant — and right now, that’s the bulls.
🔶 MMF BUY Zone
$4,179 → $4,165
Looking for a shallow pullback before the next leg.
🔼 Bullish Targets
• $4,207 (liquidity tap)
• $4,228 (Fibo 1.618)
• $4,236 (Fibo 1.786 — major reaction zone)
🧠 Key Takeaway
As long as Gold holds above $4,165, the bullish structure remains intact and the upside expansion toward the upper Fibo cluster stays in play.
New ATH?Will Silver be able to sustain the bullish momentum to create a new ATH above $54.50? Anticipating Breakout of the M15 consolidation "box" for potential long entries today. Failure to break higher could trigger a deeper pullback before a move higher?

$XAU Hit boost button if you liked the plan.
TVC:XAU | $ TVC:GOLD Clean +3.3R move smooth and stress-free trade! 💪📈

Gold market creates a new hedge Gold market forms a new hedge floating across 4190’s ,pacing toward the 4300’s for a full wedge completion within its ongoing bullish trajectory. Momentum remains aligned with the prevailing upside structure. follow for more insights , comment and boost idea

Gold Short Ahead of House VoteGold and stock market corelation turn negative again, meaning market is not pricing the liquidty crunch anymore rather than economy as a whole. Rising risk over jobs market showed itself this week and it got markets spooked. Is today's jupm because of protection againts risks or today's vote is expected to fail that I don't know but I will bet on a house passing the stopgap because risk/reward ratio will be more suited for me. I'm not an inseder so I will continue to play for statistics.
4200-4220 is the resistance zone that I follow and I'm going short.

XAU/USD Gold strong buy trend resistance breakout bullish move📈XAU/USD (Gold) Update
Gold showing strong bullish momentum — recent resistance breakout confirms upside strength.
Current bullish entry zone around 4210 looks promising for continuation.
🎯 Technical Target: 4377 (Supply Zone / All-Time High)
⏱ Timeframe: 4H
🟢 Bias: Bullish
⚠️ Note: Always apply proper risk management — protect your capital first!
If you found this useful — Like, Follow, Comment & Share 💬✨
#XAUUSD #GoldAnalysis #TradingSetup #Forex #TechnicalAnalysis #PriceAction #Bullish #RiskManagement

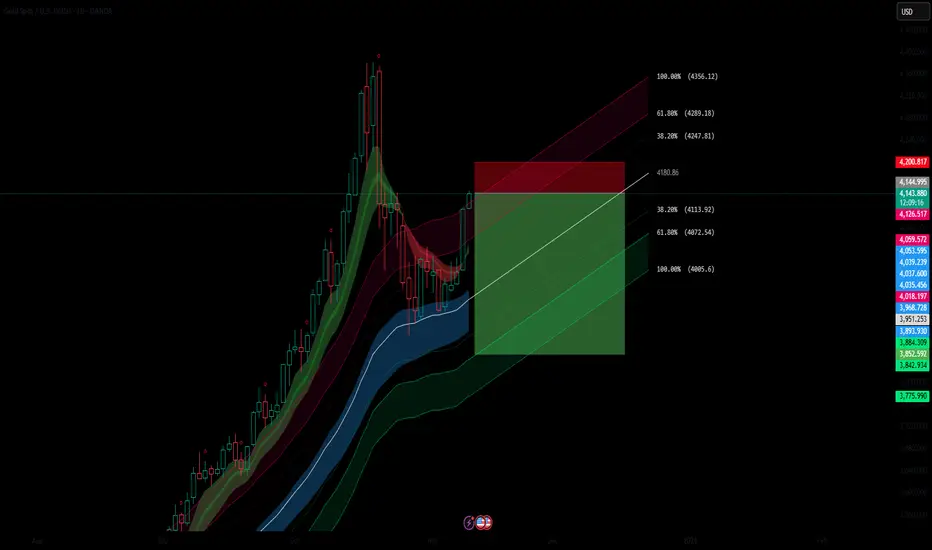
Golden Trap: Massive XAU/USD Sell OpportunityGold (XAU/USD) recently hit resistance near 4180–4200, a zone aligned with previous structural highs and a key Fib retracement zone (38.2%) from the recent swing top. The price has lost bullish momentum after a sharp rally, showing rejection wicks and fading volume. The multi-color ribbon EMA suggests early signs of a bearish crossover — indicating potential for a deeper correction.
Bearish Confluences:
Rejection at Fib Cluster (4180–4200) — aligns with both the local swing high and the 38.2% retracement level.
EMA Ribbon Curling Down — shorter EMAs are turning bearish, suggesting momentum exhaustion.
Bearish Market Structure Shift — lower highs forming after a parabolic rise, often preceding deeper retracements.
Overextended RSI / Momentum Divergence — previous highs not supported by equal strength on indicators.
Psychological Round Number Pressure (4200 zone) — historically a strong reaction level for gold.
🎯 Fibonacci Downside Targets (retracement from swing low to swing high):
Target 1 (38.2%) → $4,114 — Minor support, potential short-term bounce zone.
Target 2 (61.8%) → $4,072 — Golden ratio target and major structural support.
Target 3 (100%) → $4,005 — Full retracement zone and confluence with previous breakout
XAU/USD – Strong Bullish Trend Holds Firm as Price Consolidates Gold continues to trade in a powerful bullish structure on the H1 timeframe, respecting the ascending trendline and forming steady higher highs and higher lows. After the recent impulsive rally, price is now consolidating just above a newly formed demand zone – a typical pattern before the next breakout.
The market remains supported by multiple stacked demand layers, suggesting strong institutional accumulation beneath current price.
Key Technical Zones
Immediate Demand Zone: 4210 – 4185
Price is holding above this fresh demand block, showing strong buyer presence.
Secondary Demand Zone: 4145 – 4125
This zone provided the earlier breakout base and remains a key support for any deeper pullback.
Major Demand Base: 4020 – 3985
The origin of the entire uptrend and the area where aggressive buyers previously entered.
Market Structure & Trend Analysis
Uptrend remains intact with clean reactions at each demand zone
Price is consolidating near the highs, often a signal of bullish continuation
No bearish break of structure observed
Trendline support remains respected throughout the move
The current price action suggests that bulls are preparing for another upward push as long as price stays above the nearest demand zone.
Trading Strategy
Buy the Retest (Primary Setup):
Look for a dip into 4210 – 4185
Wait for bullish confirmation candles
Target: 4245 and 4260
Deeper Pullback Buy Zone:
If price pulls back further, the 4145 – 4125 zone offers a high-probability entry aligned with the trend.
Invalidation:
A clean H1 close below 4120 would signal weakening bullish structure and open the door to a deeper correction.
Summary
XAU/USD maintains a strong bullish trend with healthy pullbacks into well-defined demand zones. As long as price holds above key supports, continuation toward new highs remains the dominant scenario.
If this analysis aligns with your strategy, follow for more high-quality trading setups each day.

Gold Pulls Back to 4200 – Awaiting Direction Confirmation📊 Market Overview
Gold (XAU/USD) has just dropped from the resistance zone $4218–$4219 down to $4203.
The market is currently reacting near the support zone $4200–$4205, with buying pressure starting to appear, but short-term bullish momentum is weakening.
The H1 trend remains slightly bullish, with EMA20 & EMA50 pointing upward, providing support around $4205–$4210.
📉 Technical Analysis
• Main Trend: Slightly bullish (bullish bias).
• EMA20 & EMA50 H1: Upward sloping, support at $4205–$4210.
• Resistance: $4218 – $4222, further $4230 – $4235
• Support: $4205 – $4200, further $4195 – $4190
• RSI H1: Dropping from overbought → warning of a short-term pullback.
📌 Outlook
• The $4205–$4207 zone is a key support; if price holds, a rebound toward $4212–$4215 is likely.
• If price breaks below $4205, a deeper drop toward $4195–$4190 may occur.
• H1/H4 candle signals will determine the next breakout direction; priority is to BUY on support bounces and SELL on clear rejection at resistance.
________________________________________
💡 Trading Strategy
🔺 BUY XAU/USD: $4190 – $4193
• TP: 40 / 80 / 200 pips
• SL: $4186
🔻 SELL XAU/USD: $4233 – $4236
• TP: 40 / 80 / 200 pips
• SL: $4239
