XAGUSD--LONG--Long bias
--entry and tp levels are as shown on the chart
--Also check below 12M chart I published before. (I added down below)
Futures market

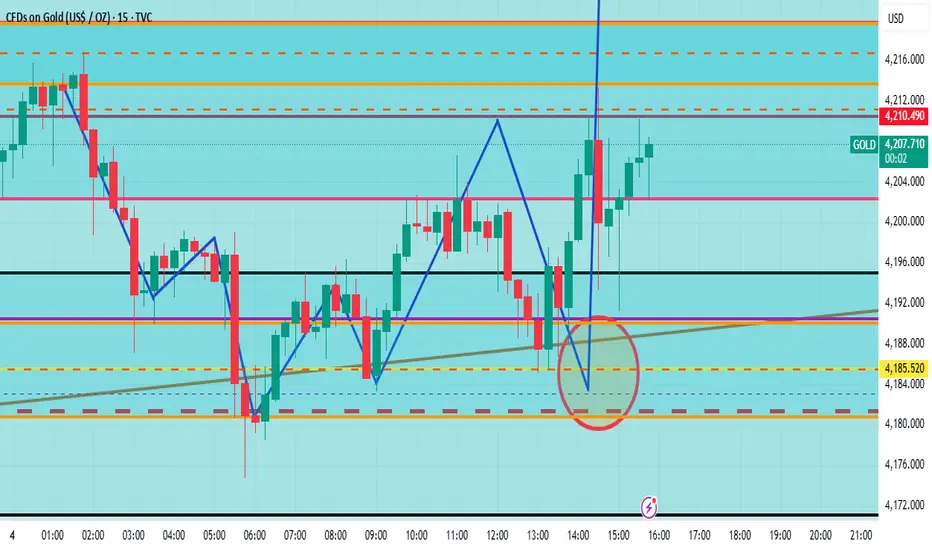
WILL GOLD STILL GO SIDEWAYS TODAY? WHAT DO YOU THINK?1. Overview
Yesterday's candle formed a Doji → the market is hesitant, not showing a clear main trend.
Today, if the candle closes below the support zone → prioritize SELL,
If the candle closes above the resistance zone → prioritize BUY.
2. Expected Trend
The market is likely to move sideways within the range:
4170 ⇄ 4220
Strategy: Trade according to the zone – follow the breakout of any boundary.
3. BUY ZONES
4180-4175
4155-4160
🔸 SL: 100 pips
🔸 TP: 100 pips
4. SELL ZONES
4217-4220
4230-4333
4240-4244
4260-4265
🔸 Wait for a clear price reaction in the zone before entering a trade.
5. Important Notes
Plan applies before the 22:00 news.
Break any zone, then follow that zone. Do not try to catch tops and bottoms.

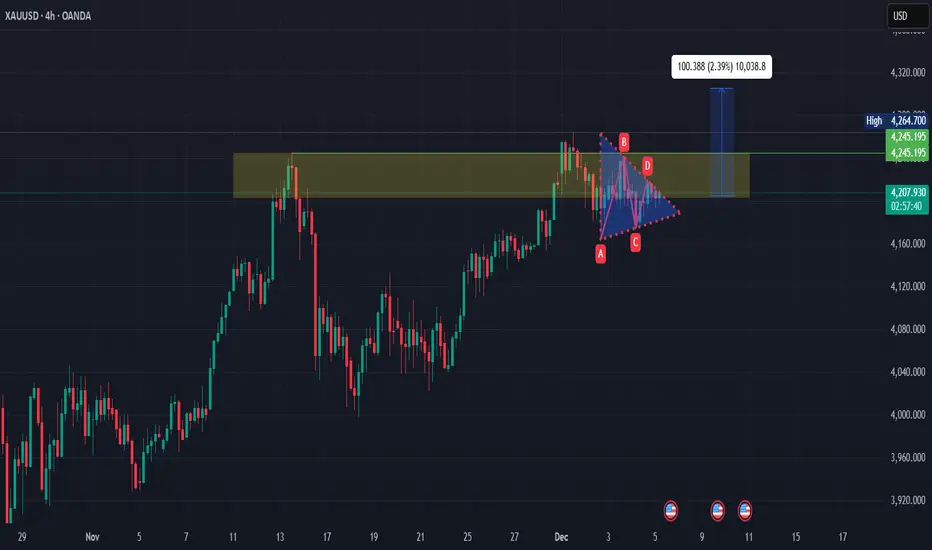
Gold ready to blast Yesterday's gold rices were sideways in a range .
Now trying to breakout from consolidation and readyvto move .
Details shared in chart


Symmetric Triangle Formation Once we get a clear close outside the symmetric triangle we can enter a trade.
Minimum 100points we can expect out of this trade. My view is bullish, so I am expecting this to break upwards i.e crossing the tringle ~4221 resistance level.
i.e minimum target can be ~4305 - ~4320 or
Current market is in a strong resistance level you can see it in the yellowish highlight zone.
We need to be careful in this zone trade with lesser quantity is wiser.
Never forget to protect your funds.
Gold Long Entry: gold looks strong, money will flow to XAUUSDgold is looking very strong bullish and any dip level liquidity zone will be a very good buying opportunity < Gold Long Entry: gold looks strong, money will flow to comodities

5/12/25 Can Bears Get FT Selling or Retest Above 20-Day EMA?
Thursday’s candlestick (Dec. 4) was a bear bar closing in its lower half with a small tail below.
In our previous report, we stated that traders would watch if the bears could create follow-through selling and close far below the 20-day EMA, or if the market would trade slightly lower but close with a long tail below and above the middle of the candlestick.
The market traded lower and closed below the 20-day EMA.
The bulls hope the selloff (Nov 26) will form a major higher low.
The bulls hope to get a reversal from a large wedge pattern (Jan 17, May 8, and Nov 26).
They see any pullback simply as a retest of the November 26 low, and want it to be weak (overlapping candlesticks, poor follow-through selling), forming a higher low major trend reversal.
They must produce strong follow-through buying above the 20-day EMA to show they are clearly in control.
The bears want the 20-day EMA to act as a resistance level, followed by a retest of the November low.
If the market trades higher, they want the November 19 high to act as resistance (around 4250-4300 area)
They hope for a strong third leg down to form the wedge pattern, with the first two legs being Nov 13 and Nov 26.
Fundamentals
• Production: Production may be down in December.
• Refineries: Buying interest is there at these low prices. Not paying premiums vs spot futures.
• Exports: ITS first five days of Dec: TBA
The market sold off in a tight bear channel, followed by a tight trading range in November, which could be a possible final flag, followed by a second leg sideways to down (Nov 26).
The market formed a pullback towards the 20-day EMA this week.
Next, traders will see the strength of the retest of the November 26 low. Will it be strong, breaking below the Nov 26 low? Or will it be weak, perhaps stalling around the December 2 low area?
Bulls want a strong bull bar today so that the weekly candlestick will close in its upper half, while the bears want a strong bear bar today so that the weekly candlestick will have a bear body and a long tail above.
Today (Friday, Dec. 5), traders will watch to see whether the bears can create follow-through selling and close far below the 20-day EMA, or will the market trade higher to retest the area near the 20-day EMA instead?
Andrew

Copper Shows Steady Relative Strength Against Equities (HG1!/SPYCopper continues to show steady relative strength against the S&P 500 on the daily timeframe.
Because copper is highly sensitive to economic activity, this ratio often provides an early read on underlying growth trends and industrial demand.
Key observations from today’s structure:
• Price remains above key moving averages, reflecting improving trend stability
• RSI is firm, showing constructive momentum
• Volume behavior supports the recent advance
• ATR remains controlled, indicating steady rather than volatile movement
A rising HG1!/SPY ratio often aligns with improving macro conditions and stronger growth expectations.
Monitoring this ratio across multiple timeframes helps clarify whether economic momentum is strengthening or weakening beneath the broader equity surface.

The Market Doesn’t Wait — But Winners Don’t Hesitate.The market has transitioned into a short-term bearish cycle after sweeping the buy-side liquidity above 4243. A clean CHoCH → BOS sequence confirms the shift from bullish displacement into redistribution, signaling bearish orderflow dominance.
📌 1. CURRENT TREND — MARKET STRUCTURE
The chart is showing a short-term bearish structure on H1 because:
- After forming a HH, price broke the previous low → BOS to the downside.
- Current structure: LH → LL → LH → minor HL → LL.
- Price is heading toward the 4,181 – 4,163 support zone, which is a major structure low.
➡️ H1 trend: short-term bearish (deep pullback)
➡️ Higher-timeframe trend (H4/D1): still bullish → this drop is a corrective move.
📌 2. KEY LEVELS — SUPPORT & RESISTANCE
Main Resistance
- 4,225 — previous swing high and key liquidity target.
Major Support Zones
- 4,181 — mid-range support, likely first reaction point.
- 4,163 — key structure low; strong zone where a new HL may form.
📌 3. MAIN SCENARIOS
Scenario 1 (Primary Scenario): Price taps 4,181 → small sweep → pushes up
Price may form a small internal LL/HL pattern near 4,181.
Potential for liquidity sweep / double bottom.
If price confirms, it will push back toward:
- 4,200
- 4,215
- Main target: 4,225
➡️ This aligns with the higher-timeframe bullish trend + H1 pullback.
Scenario 2 (Cleanest & Highest RR): Price sweeps 4,163 then reverses
- A strong liquidity grab around 4,163 forms a major HL.
- This is where smart money typically accumulates positions.
- A bullish BOS afterward confirms the reversal on H1.
➡️ Best risk-to-reward setup.
📌 4. ENTRY – SL – TP
🎯 ENTRY 1: 4,181 – 4,185 (after rejection/confirmation)
SL: below 4,172
TP1: 4,200
TP2: 4,215
TP3: 4,225
🎯 ENTRY 2 (safer, high RR): 4,163 – 4,168
SL: below 4,150
TP1: 4,185
TP2: 4,200
TP3: 4,225
📌 5. SUMMARY
H1 structure is bearish, but it is simply a deep pullback inside a bullish higher-timeframe trend.
The best long setups are at 4,181 and 4,163.
Once a new HL forms, bullish continuation targets 4,225.
Every pullback is a chance — not a punishment. Stay patient, trust your structure, and execute like a pro.

Gold Buy iminent buy because i can and if it loses it loses. market is in consolidation and it lloks like a buy from the daily chart


MORE BUYS EXPECTED
if you took this trade, hold it because we will buy more any moment from now and tomorrow especially and from the look of things this could be the beginning of the impending bullish move,
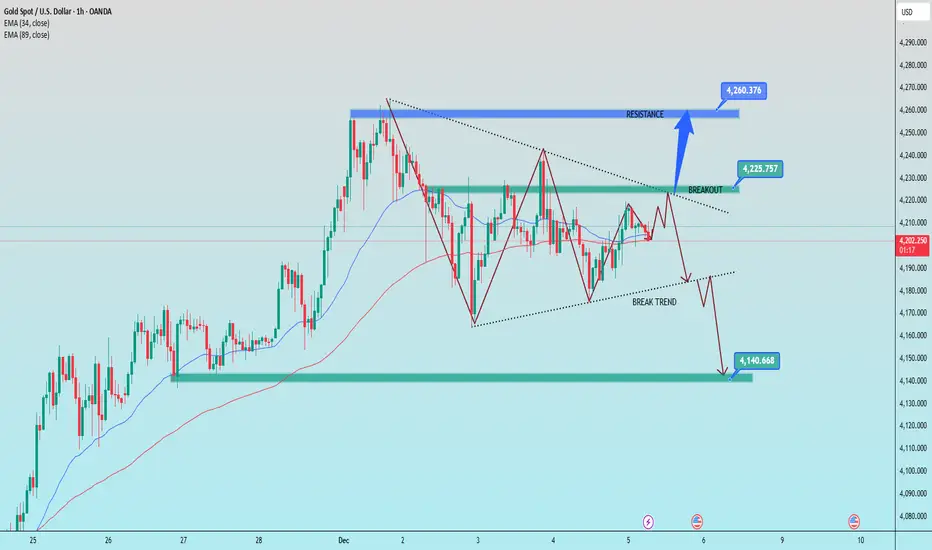
Gold price developments at the end of the week of December 51️⃣ Trend Line
Descent trend line (above – dashed line)
Price has been touched and rejected several times → becomes strong dynamic resistance.
The 4,225–4,230 price zone is a key area:
→ Valid breakout = opens upward momentum towards 4,260.
→ Failed breakout = price returns down following the previous trend.
Ascending trend line (below – dashed line)
This is dynamic support that maintains the short-term upward structure.
If price breaks through this trend line, a downtrend will activate.
2️⃣ Support Area – Key Resistance
4,225 – 4,230:
Confluence of the descending trend line + the previous supply zone → a designated area for buyers.
4,260 – 4,265:
Strongest resistance. When price touches this area, a downward reaction is likely.
Support
4,190 – 4,195:
The first area to be tested if the trend line is broken.
4,140 – 4,135 (lower green zone):
Very strong support – the main target if the downtrend is confirmed.
📌 Trading Signals
BUY GOLD: 4,140 – 4,138
Stop Loss: 4,130
Take Profit: 100 – 300 – 500 pips
SELL GOLD: 4,260 – 4,262
Stop Loss: 4,270
Take Profit: 100 – 300 – 500 pips
XAU/USD LongM & W: Uptrend, respecting the lows
D: Uptrend, price retraced 88.6%
4H: Downtrend, price made a higher low trending long
1H: Uptrend, price hit -61.8 on H1 FIB + RSI showing oversold and bearish divergence.
CURRENTLY: I'm looking for price to go short to retest H1 trendline, @previous resistance, and continue long.

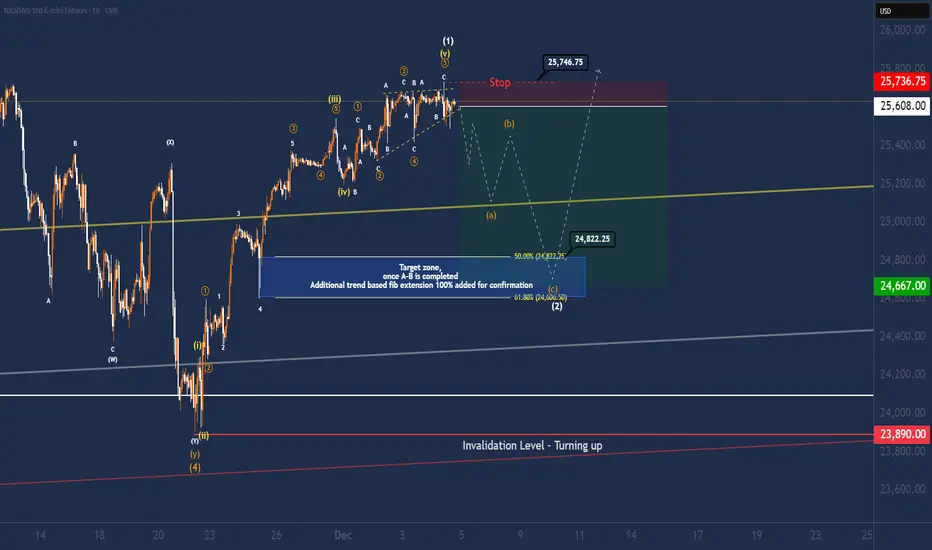
Elliot wave suggests correction on NQ for wave (2) -> [5]Instrument: NASDAQ 100 E-mini Futures (NQ)
Bias : Short-term corrective downside after a completed impulse, then continuation higher.
1. Bigger picture – why I expect a correction
From the low around 23,890 we’ve put in a very clean 5-wave impulsive advance:
* Wave (i)–(ii) starts the move off the low.
* Wave (iii) is clearly the strongest and longest leg – classic extended 3rd wave behaviour.
* Wave (iv) is a shallow sideways consolidation.
* The current high is labelled (1), with the last leg subdividing as an ending diagonal in wave (v): overlapping structure, contracting highs, and loss of momentum.
That wedge-type structure at the top usually signals trend exhaustion , not the start of fresh impulsive upside. So my base case is that the first motive wave up from 23,890 is complete and we’re now looking for a textbook wave (2) pullback. We also can back this data up with volume nodes we can observe during the NY Cash sessions. Who are clearly showing signs of distribution.
Wave (2) corrections most often retrace 50–61.8% of wave (1) in a 3-wave A-B-C structure – exactly what the chart is projecting.
2. Expected path – the A-B-C into the blue box
From the current highs around 25,600–25,700 I’m looking for:
1. Wave (a) down
First impulsive leg lower, ideally breaking out of the wedge and pushing into the rising yellow trendline zone around ±25,200.
2. Wave (b) retrace up
Corrective bounce that stays below the stop zone and forms a lower high.
3. Wave (c) down into the blue box
Final flush into the confluence zone marked in blue, where:
50% retrace of wave (1) sits around 24,800.
61.8% retrace sits around 24,600
There’s also a previous structural support / prior wave-4 area.
Labelled as the end of wave (2) on the chart.
This blue rectangle is my primary target area for the current correction and also my preferred zone to look for fresh longs if the structure behaves as expected.
4. Trade idea #1 – Aggressive short from the wedge
This is the “ catch the correction ” play for traders comfortable trading against the higher-timeframe trend.
Idea: Short against the completed wedge / wave (1) high, targeting the A-B-C correction into the blue zone.
Entry zone:
Around current prices in the 25,580–25,600 area (wedge top / prior minor highs).
Stop-loss (hard invalidation for the short):
Above the red “Stop” band and the labelled high at 25,746.75
If price breaks and holds above this level, the idea of a completed wave (1) and immediate correction is likely wrong – stand aside.
Profit targets:
TP1 – first leg / (A) completion:
Around the rising yellow trendline near 25,150–25,250
Take some off here if you want to pay yourself on the initial impulse.
TP2 – upper edge of blue box (50% fib): 24,822.25
TP3 – lower edge of blue box (61.8% fib & (c) completion): 24,600–24,650 are
For reference, using an approximate entry at 25,600:
Risk: 25,740. – 25,600 ≈ 138.75 pts
Reward to TP2: 25,600 – 24,800 ≈ 780 pts (~5.7R)
Reward to TP3: 25,600 – 24,660 ≈ 940 pts (~6.8R)
So the idea offers an attractive reward:risk , as long as you accept the possibility that the correction may be shallower or more complex than the “ideal” projection.
What I want to see step-by-step if I’m in this short:
1. A convincing break down out of the wedge.
2. Follow-through selling to the yellow trendline (wave (a)).
3. A choppy overlapping bounce that stalls under the stop zone (wave (b)).
4. One more push down with increasing momentum into the blue box (wave (c)) – where I’ll look to exit shorts and flip bias.
5. Trade idea #2 – Conservative swing long from the blue bo x
If you don’t like shorting a strong trend, the more conservative plan is to ignore the short and only look for longs once the correction has played out.
Idea :
Buy the end of wave (2) in the blue box for a continuation higher in wave (3).
So we are trying to buy the dip in a strong trend.
Buy zone (long trigger area ):
Blue box between roughly 24,800–24,600.
Ideally after we’ve seen a full A-B-C structure into this zone and some kind of reaction. (rejection wicks, bullish divergence, lower-timeframe 5-wave impulse off the lows, etc.).It could also be a more complex correction like WXY, However most of the time we expect a wave 2 more str8 forward price action.
Stop-loss for the long:
Conservative, structure-based invalidation remains the red line at 23,890
A break below this low would invalidate the wave (1)–(2) interpretation and suggest something more bearish is underway.
Tactically, some traders may opt for a tighter stop just below the blue box (e.g. under 24,550), but that’s a money-management choice, not a structural one.
Upside objectives:
First objective is a retest and break of the 25,746 high .
From there, if this is indeed the start of wave (3), extensions towards **26,000+** become realistic (1.0–1.618 extensions of wave (1), not drawn in detail here but implied by the dashed grey path).
6. Invalidation and what would change my mind
Short-term bearish idea is invalid :
if price closes decisively above 25,75x without first breaking down. That would suggest that wave (1) is still extending, or that we’re in a different pattern (e.g. a larger ending diagonal or a complex topping structure). In that case I step aside and reassess.
Medium-term bullish roadmap is invalid if price trades below 23,890 . Then the whole impulse from the low is likely mis-labelled and I would expect a deeper bearish structure. However this
7. Final notes
This is an Elliott Wave–driven roadmap, not a guarantee. I’m planning to:
Treat the current region as exhaustion of wave (1).
Use it either for an aggressive short into the A-B-C correction,
Or wait patiently for the blue box to develop for a more conservative long into a potential wave (3).
As always: manage your risk, size appropriately, and don’t trade this blindly. This is a trade idea and educational analysis, not financial advice.
Since lack of time I was not able to post many trade ideas in the past months. However I'm going to try to get back some more ideas in the future! Please leave feedback and comments!
ASIAN MONEY ZONE SNIPER SIGNALS BASE TEMPLATE One of the most simplest and profitable strategies. This is a base template to use along with Signal Sniper software.

XAUUUSD WANT MORE DROPING AT LEVEL 4208📉 XAUUSD ANALYSIS & LEVEL FORECAST
On the H1 timeframe, XAUUSD has rejected its major resistance level, triggering a strong bearish move. Sellers are currently in control, and the structure is pointing toward a deeper downside continuation.
🔑 Key Levels
Resistance: 4234
Support: 4175
🎯 Technical Target
4130
📌 Technical Outlook
Gold faced heavy rejection at 4234, confirming strong supply and shifting momentum downward. As long as price holds below 4175, the bearish wave is expected to continue toward the 4130 technical target.

Goldbach ideaBias ideas using Hopiplaka's personal trade plan logic with po3 size movements. The next target for the idea is a 27 points BISI that i did not show but it's marked down there.

XAU long.Beautiful 😍
Alright….
24h on the clock.
Still messy and would have preferred a hit on 275x before closure?! Not completely off the table at this point…. still Looking for her to put that work in on them handles today. 75/80.
If we can achieve. Next week will be easy..
Same plan remains on target,
Same fight over 192.. Definitely needs to sustain!
Bless 💯

GOLD - H2 Update - Pivotal PointWe have an ascending channel divided into 2 parts with the Blue line separating them.
Chart has breached the upper channel into the lower one by crossing the blue line on DEC 2.
Since then, Gold has retested the line 3 times and failed. The third time was on DEC 3 @ 15, where we had a Fake Breakout & a Strong rejection forming a long upper wick.
The rejection came too from the red resistance zone.
We are also starting to identify a potential "Head & Shoulder".
The chart however has bounced off a good green support zone, pushing the battle to a close range between the Reds & Greens.
We are at a pivotal point.
With enough buying pressure it is possible to breach the red zone, yet if it is not available at this level, going for a lower support around 4130 can help replenish Green Energy levels and from there try to breach the red zone.
Safe Trade.

SILVER REBOUND AHEAD|LONG|
✅ SILVER price is reacting off the anchored demand block, with displacement showing early signs of bullish orderflow returning.
A liquidity sweep beneath intraday lows suggests engineered sell-side delivery before a corrective move higher into the target zone.Time Frame 1H.
LONG🚀
✅Like and subscribe to never miss a new idea!✅

CRUDE OIL Local Short! Sell!
Hello,Traders!
CRUDE OIL price is reacting inside a major supply zone, suggesting a potential shift as liquidity begins to unwind. If orderflow confirms, price may slide back toward the target level as SMC dynamics align with bearish distribution. Time Frame 2H.
Sell!
Comment and subscribe to help us grow!
Check out other forecasts below too!
Disclosure: I am part of Trade Nation's Influencer program and receive a monthly fee for using their TradingView charts in my analysis.

Silver (XAG/USD) – 4H Technical OutlookSilver (XAG/USD) – 4H Technical Outlook
Silver is currently sitting right on the red bullish trendline, which is the main structure holding this entire uptrend together. This level is the pivot that will decide whether the market continues its bullish run or enters a deeper correction.
Bullish Scenario
If price bounces cleanly from the red trendline, we can expect momentum to shift back upward toward the next key level at 59.528.
A strong rejection here would signal continuation of the bullish structure, opening the door for new highs above the recent peak.
Bearish Scenario
If price breaks and closes below the red trendline, this will invalidate the short-term bullish structure.
That break would likely trigger a deep correction, with the first liquidity target sitting around 54.575 (yellow zone).
Key Note
From this exact zone, both outcomes are on the table — either a new high is born from a trendline bounce, or a structural correction begins from a confirmed trendline break. Traders should wait for confirmation before choosing a direction.
