NASDAQ 100 (NQ1!): Bullish! Buy The Dip!Welcome back to the Weekly Forex Forecast for the week of Sept 15 - 19th.
In this video, we will analyze the following FX market: NASDAQ (NQ1!) NAS100
The NASDAQ is bullish. No reason in the world to start looking for shorts! Let the market pullback to Internal Range Liquidity (IRL), a +FVG or +OB, and look for valid long setups on the lower timeframes.
Enjoy!
May profits be upon you.
Leave any questions or comments in the comment section.
I appreciate any feedback from my viewers!
Like and/or subscribe if you want more accurate analysis.
Thank you so much!
Disclaimer:
I do not provide personal investment advice and I am not a qualified licensed investment advisor.
All information found here, including any ideas, opinions, views, predictions, forecasts, commentaries, suggestions, expressed or implied herein, are for informational, entertainment or educational purposes only and should not be construed as personal investment advice. While the information provided is believed to be accurate, it may include errors or inaccuracies.
I will not and cannot be held liable for any actions you take as a result of anything you read here.
Conduct your own due diligence, or consult a licensed financial advisor or broker before making any and all investment decisions. Any investments, trades, speculations, or decisions made on the basis of any information found on this channel, expressed or implied herein, are committed at your own risk, financial or otherwise.
Futures market

Gold next Week Move PredictionWhen the market opens next week, gold is expected to retest 3684 and then reverse back into a selling trend.

Gold: Will the Rally Continue or Is a Correction Ahead?Hello everyone,
Today gold staged a modest rebound, currently trading at $3,684.97/oz, up $16.63 (+0.45%) from the previous session. This is a notable sign after the metal experienced a prior correction.
The main driver comes from continued safe-haven demand as global economic uncertainty persists. Fair Value Gaps (FVG) formed during the recent rally are also acting as support, while the increase in trading volume highlights strong participation from large investors.
From a technical perspective, if gold holds above the $3,640 support area, the bullish trend is likely to be reinforced, with immediate targets at $3,700 and a further extension towards $3,750. Moreover, the Ichimoku cloud continues to support the upward bias as the price remains above it.
What do you think? Will gold push through $3,700–$3,750, or could it slip back into correction? Share your view below!

THE KOG REPORT - UpdateEnd of day update from us here at KOG:
Yesterday we posted the FOMC Report with the hot spots and boxes, which you can see has been added to the our usual chart. Although the move was very quick, you can see the boxes and hot spots worked like magic, especially the lower one which gave us the bounce we wanted for the long early session.
Now, we have resistance at the 3655 level and support below at the 3630 level. We would say late session trading is not worth it as there is hardly any volume in the markets, however, if we stay above the 3630 we should get an attempt higher
As always, trade safe.
KOG

XAUUSD: Bounce from 3615 Support LevelHello everyone, here is my breakdown of the current Gold setup.
Market Analysis
From a broader perspective, after a strong run-up within a prior Upward Channel, the price action for Gold has transitioned into a horizontal consolidation Range. This shift from a trending to a ranging market indicates a period of balance as buyers and sellers digest the previous impulsive move.
Currently, the price is in a corrective phase within this Range. After recently failing to break above the Resistance Zone, sellers have pushed the price down, and it is now approaching the major horizontal support at the bottom of the consolidation, near the Support 1 level.
My Scenario & Strategy
I think that this Range structure will continue to hold for now. The lower boundary, which aligns with Support 1 at 3615, is a significant area of historical support. This Support zone represents a high-probability area for buyers to step in and defend, just as they have in the past.
My scenario is that Gold will complete its drop to the lower part of the consolidation, testing the Support 1 level. Therefore, I expect that a successful defense of this support will lead to a rally back across the Range. My target for this move is 3700, which is placed within the major Resistance Zone at the top of the consolidation.
That's the setup I'm tracking. Thank you for your attention, and always manage your risk.


Learn the Significance of Psychological Levels and Round Numbers
When traders analyze the key levels, quite often then neglect the psychological levels in trading.
In this article, we will discuss what are the psychological levels and how to identify them.
What is Psychological Level?
Let's start with the definition.
Psychological level is a price level on a chart that has a strong significance for the market participants due to the round numbers.
By the round numbers, I imply the whole numbers that are multiples of 5, 10, 100, etc.
These levels act as strong supports and resistances and the points of interest of the market participants.
Take a look at 2 important psychological levels on EURGBP: 0.95 and 0.82. As the market approached these levels, we saw a strong reaction of the price to them.
Why Psychological Levels Work?
And here is why the psychological levels work:
Research in behavioral finance has shown that individuals exhibit a tendency to anchor their judgments and decisions to round numbers.
Such a decision-making can be attributed to the cognitive biases.
Quite typically, these levels act as reference points for the market participants for setting entry, exit points and placing stop-loss orders.
Bad Psychological Levels?
However, one should remember that not all price levels based on round numbers are significant.
When one is looking for an important psychological level, he should take into consideration the historical price action.
Here are the round number based levels that I identified on AUDUSD on a weekly time frame.
After all such levels are underlined, check the historical price action and make sure that the market reacted to that at least one time in the recent past.
With the circles, I highlighted the recent reaction to the underlined levels. Such ones we will keep on the chart, while others should be removed.
Here are the psychological levels and proved their significance with a recent historical price action.
From these levels, we will look for trading opportunities.
Market Reaction to Psychological Levels
Please, note that psychological levels may trigger various reactions of the market participants.
For instance, a price approaching a round number may trigger feelings of greed, leading to increased selling pressure as traders seek to lock in profits.
Alternatively, a breakout above/below a psychological level can trigger buying/selling activity as traders anticipate further price momentum.
For that reason, it is very important to monitor the price action around such levels and look for confirmations.
Learn to identify psychological levels. They are very powerful and for you, they can become a source of tremendous profits.
❤️Please, support my work with like, thank you!❤️
I am part of Trade Nation's Influencer program and receive a monthly fee for using their TradingView charts in my analysis.
SELL OUNCEDivergence on weekly time frame
Buying saturation on monthly time frame
Possibly final triangle pattern.
Wave and lag 9 in wave 3
0.01 or 0.02 sell with stop loss of $5000
and target up to 2600

Eliott . is it possible to correct gold on 1(4) ?on monthly cart guuys? what about correcting gold 1900-2200 in few months? what do you think? i know it seems to be ridiculous but.... as we know everything is possible on the stock market
Gold 30Min Engaged ( Bullish Movement Detected )Time Frame: 30-Minute Warfare
Entry Protocol: Only after volume-verified breakout
🩸Bullish Movement From : 3665
➗ Hanzo Protocol: Volume-Tiered Entry Authority
➕ Zone Activated: Dynamic market pressure detected.
The level isn’t just price — it’s a memory of where they moved size.
Volume is rising beneath the surface — not noise, but preparation.
🔥 Tactical Note:
We wait for the energy signature — when volume betrays intention.
The trap gets set. The weak follow. We execute.
GOLD may need some rest now After the expected gain:
now we may have some rest and short-term dump here like red arrow on chart but only if more war news did not pump the price.
DISCLAIMER: ((trade based on your own decision))
<<press like👍 if you enjoy💚

GOLD IS DOWN Gold is facing strong resistance at the 3700 level, and therefore it needs a major corrective move down to 3445. However, we first need to confirm a break of the 3640 level.

XAUUSD--LONG--Bullish bias.
--tp and entry levels are as shown on chart
--for big picture check the weekly chart I published before. (I added below)

Gold Faces Major Resistance: Is a Sharp Decline Imminent?Hey everyone, looking at XAUUSD today, I noticed something quite interesting. Gold has reached an important resistance level, one that in the past has acted as a strong barrier, pushing the price down. This area has also been a strong supply zone, where sellers have previously taken control of the market. Therefore, it becomes a "hot" spot for those looking for shorting opportunities.
If the price starts showing bearish signals, such as rejection wicks, bearish candlestick patterns, or signs of weakening buying pressure, I think there's a good chance we could see a drop towards 3,604, and possibly even lower to 3,5XX if the selling pressure remains strong. However, if the price breaks this resistance clearly, the bearish outlook might be invalidated, and we could see a further rally.
This is just my personal view on the support and resistance levels, not financial advice. Always double-check your signals and ensure proper risk management.
Good luck with your trades!
XAUUSD--Ascending Channel--Bullish bias
--Looking at the sizes of the candles, we see momentum decreases. But it seems GOLD will rise more.At least up to the upper side of the channel.

Gold has returned to its upward trendCurrently, the bulls in the gold market have the upper hand. The recent short - term pullback in gold prices is merely an adjustment and does not signal a real trend reversal. After gold broke through the short - term downward trend line on the chart, it rebounded upwards again. As a result, the 3660 level has now transformed into a support level. Any retracement of gold to above 3660 presents an opportunity to go long on dips.
Given that the gold bulls have managed to reverse the situation after multiple downward probes and the price has ultimately continued to rise, it indicates that the strength of the gold bulls is more dominant. Gold has returned to its upward trend, and the short - term adjustment may have ended. Therefore, on any retracement, it is still an opportunity to go long along the trend.

Profit taking to start Is gold to see profit taking into a clear supply area / technical resistance. To trigger short term shorts at the stops of the longs?
Chart Context: The daily close aligns with a prominent supply zone highlighted across multiple timeframes
USD index ticked up around the week’s close, which can cap gold’s upside if USD strength extends.
Bond yields still matter the 10 yr yield is 4.06% not sky high but high enough that any further rise would bolster the opportunity cost of holding non yielding gold and could pressure the metal.
Creating a short-term edge for sellers, who likely have the marginal edge while price sits at a major supply / resistance cluster. With gold closing at Daily supply zone.
Next week we can expect choppy and the potential for a retracement down into the 3668 to 3664 old resistance to turn support. Or first demand / support: 3655 to 3646 demand area and trend support. If this fails on clean close / follow through, sellers likely push price to demand band if buyers fail to defend 3668–3664. With deeper support if that fails.at 3620 to 3618 aoi previous structure / lower time frame demand.
Medium term edge weeks to months, Buyers keep the strategic advantage while Fed easing expectations, ETF flows and Chinese demand signals remain intact. Unless real yields spike or ETFs reverse heavily, the structural bias remains bullish.
Execution notes & structure checklist what to watch daily
1. FOMC follow through / Fed commentary, any hint that cuts will be delayed pushes real yields up and hurts gold. Watch Fed speakers.
2. US data flow, CPI/PPI, jobless claims, retail strong prints can tighten the short term squeeze on gold. Weak prints bolster the bull case.
3. DXY & 10 yr yields, watch DXY intraday moves and 10 yr clustering. A surge in yields or a sustained USD rally favors sellers.
4. ETF flows / physical flows, WGC weekly/monthly updates large net inflows can sustain upward pressure despite short term technicals.
5. China demand / policy headlines, any easing in import controls or strong retail/wholesale buying in China/India is bullish.
Key Price Zones to Monitor
3668 – 3664 First pullback support Old resistance turned support. Initial retracement target.
3655 – 3646 Demand / trend support Strong demand cluster and trendline confluence.
3620 – 3618 Deeper structural support Lower timeframe demand, failure here signals broader correction.
Note: A clean daily close below 3668–3664 with follow-through would hand sellers near-term control and open a path to deeper supports.

Gold Price Reverses - Continues to Surge👋Hello everyone, what do you think about OANDA:XAUUSD ?
Although XAUUSD was impacted by the news of a drop in unemployment claims, the upward momentum continued to perform well on Friday. The price held strong above the $3,630 support zone and pushed the precious metal to new highs, rising by over 400 pips, or approximately 1.12%.
With the current price level, breaking through the immediate resistance could signal the start of the next rally, targeting the $3,700 level and potentially even higher. Previous pullbacks were necessary steps for reaching this target.
What do you think about the trend of XAUUSD? Feel free to share your thoughts in the comments!
Good luck!

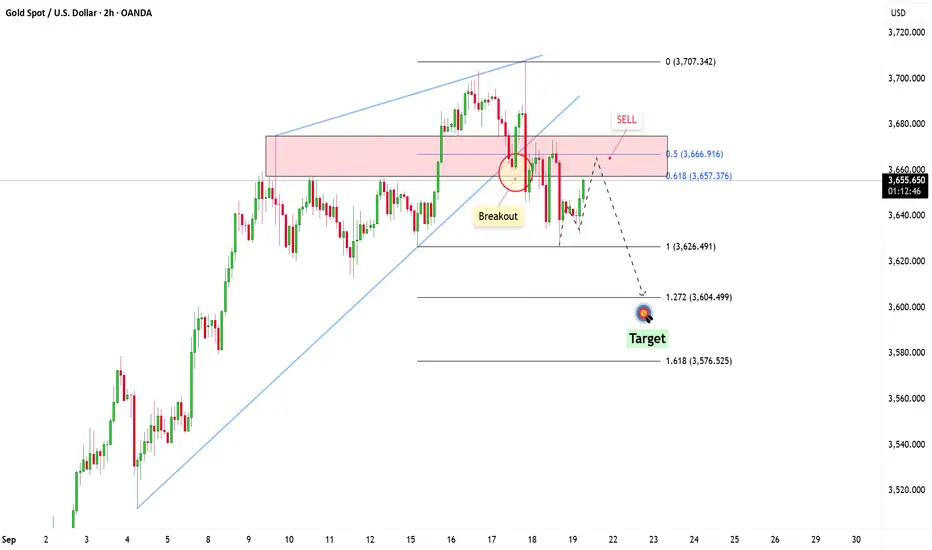
Gold (XAU/USD) 4H Outlook – Two Possible Scenarios AheadGold is trading inside a rising channel on the 4H timeframe, approaching a key resistance zone (3,685–3,700). From here, I see two potential scenarios:
🟢 Bullish Scenario
A breakout and 4H close above 3,700 could signal continuation higher.
Retest of the 3,690–3,700 zone as support would strengthen the case for upside.
Next target sits around 3,750–3,770 (upper channel boundary).
🔴 Bearish Scenario
Failure to break above 3,700 and rejection from resistance may trigger a pullback.
A break below the 0.5–0.618 Fibonacci retracement zone (3,643–3,626) would add bearish momentum.
Downside target extends toward 3,580 (major demand zone).
Both paths are possible – price action confirmation around the 3,690–3,700 zone will be key to determine direction.

GOLD WEEKPLAN: UP FIRST DOWN AFTEROANDA:XAUUSD Footprint Analysis
The Footprint chart provides a more detailed view of the order flow. Here are some key points:
Price Pullback: The recent candles show a decrease in buying pressure (green) and an increase in selling pressure (red).
Volume Footprint: The trading volume (Total) and Delta (the difference between buying and selling pressure) on each candle show the order distribution.
The candle on the 19th has a negative Delta (~ -5.96 K), indicating that selling pressure is dominant, which aligns with the corrective pullback.
However, there's no major volume divergence, suggesting that this may only be a typical correction.
Detailed Footprint Analysis: The numbers within each candle show the number of buy orders (on the left) and sell orders (on the right) at each price level. When the price pulls back to the Imbalance or Strong OB zone, it's crucial to monitor the Footprint for signs of buying pressure returning (Delta turning positive or significant buying volume at key price levels), which would serve as a confirmation signal for a long entry.
OANDA:XAUUSD General Analysis
The XAUUSD market is in a strong uptrend, confirmed by the market structure:
Higher Highs (HH): Each new peak is higher than the previous one.
Higher Lows (HL): Each new trough is higher than the previous one.
Recently, the price created a Break of Structure (BOS), breaking the previous high, which indicates a continuation of the uptrend. After the BOS, the price established a new high (HH) and is now making a corrective pullback to find a strong support zone before continuing its upward momentum.
Imbalance (Fair Value Gap - FVG): This is a liquidity void created when the price moves too quickly. According to SMC theory, the market tends to return to fill this gap.
Location: The price range is from ~$3660 to ~$3670 USD.
Significance: This zone could act as a temporary support level. If the price returns to this area, it might fill the Imbalance and then continue to rise.
Strong OB (Order Block): This is a large block of orders left behind by "Smart Money" and often serves as a strong support or resistance zone.
Location: The price range is from ~$3645 to ~$3655 USD.
Significance: This is the strongest support zone to consider for a long entry. The price is likely to pull back to this area, tap into the order block, and then bounce back up to continue the trend.
Additionally, there are two important liquidity zones to note:
Buy Side Liquidity ($$$): Located above the most recent high (~$3700 USD). The price has the potential to move up to sweep this liquidity.
Sell Side Liquidity ($$$): Located below the most recent low (~$3620 USD). This zone could be swept if there is a sharp market drop, but it's highly likely that the price will respect the bullish structure and not break this low.

ES - September 19th - Daily Trade PlanSeptember 19th - 6am
Before reading this trade plan, IF, you did not read yesterday's take the time to read it first!
(You can see my post in the related publication section)
I wrote yesterday ... "We need a pull back with some structure to one of the levels, ideally at either 6696-6700, 6692, 6682. We could also build a flag down to 6705-09 and then reclaim 6714, and head to 6733. IF, we go lower than 6682, I would get out the way and wait for a reclaim of 6684."
At 9:46am my note stated "We have continued to sell. Be patient. We could get a short squeeze soon. I would wait for reclaim of 6676 for a run to retest 6690-92"
At 9:50am - we sold into 6670, reclaimed 6676 and squeezed higher. This is a great example of why I DO NOT SHORT ES. Everyone thought it was going to continue lower and then the Institutions stepped in and took it higher and everyone short was covering.
There were 2 levels in my note yesterday that have continued to be very important since Wednesday. They have been 6682 & 6692. I will go deeper into this during my note for today.
-------------------------------------------------------------------------------------------------------------------
The overnight session low was 6679 and the high is 6705. We have been making lower lows, lower highs on the 15 min chart since yesterday's low of 6670. Until the trend changes, we cannot be bullish short term. The first sign of a change will be when we hold 6679 and then take out 6697. Ideally, we could flush down to 6670 or even as far down as the white trendline around 6658-62 zone and then rally higher. I will be waiting patiently for one of the following to happen:
1. Flush 6679, 66670 or below and reclaim higher for a level-to-level move.
2. Hold above 6679 and look for a back test of the breakout above 6697.
I do believe we will break out one way or another and IF, price drops below the white trendline and cannot reclaim it pretty quickly, I would expect price to flush lower and retest 6634 area or the FOMC lows around 6610. That would be a good spot to grab some points.
Key Support Levels - 6692, 6686, 6679, 6676, 6670, 6658-62 (White Trendline Zone)
Key Resistance Levels - 6697, 6705, 6710
Upside targets above are all levels in yellow with a breakout above 6719 to target 6733, 6750, 6776, 6796, 6809, 6814.
Based on where price is at time of this post 6:05am - We either hold this 6692 or 6686 and then reclaim above and that would potentially start the change in trend. Below 6686 and we need to flush 6679. Any breakout above 6697 should be bullish.
I will post an update around 10am EST.
---------------------------------------------------------------------------------------------------------------------
Couple of things about how I color code my levels.
1. Purple shows the weekly Low
2. Red shows the current overnight session High/Low (time of post)
3. Blue shows the previous day's session Low (also other previous day's lows)
4. Yellow Levels are levels that show support and resistance levels of interest.
5. White shows the trendline from the August lows.

GoldXAUUSD
- Change of Characteristics
- Completed " 12345 " Impulsive Waves and " ABC " Corrective Wave
- Break of Structure
- Bullish Channel as an corrective pattern in Short Time Frame
- Fair Value Gap

XAUUSD Intraday Analysis – September 19, 2025Gold price on the H1 chart has recently broken out of a descending channel after a short-term correction from the 3,700 zone. The market is now testing a key support level around 3,645 – 3,650, which will play a decisive role in today’s intraday trend.
Technical Outlook
Trend
After rallying strongly above 3,700, gold entered a correction phase inside a falling channel.
The breakout from this channel signals potential bullish momentum if support holds.
Key Levels
Immediate support: 3,645 – 3,650 (retest zone after breakout).
Major support: 3,625.
Resistance zone 1: 3,675 – 3,680.
Resistance zone 2: 3,700 – 3,705 (a break above this area could extend toward 3,720+).
Indicators
EMA: Price is consolidating near short-term EMAs. If support holds, EMAs may flip bullish.
RSI: Recovered from oversold territory and moving upward, supporting a potential bounce.
Fibonacci: 3,645 aligns with the 0.618 Fib retracement, strengthening its role as support.
Trading Strategy
Primary scenario (Long bias):
Watch for price action around 3,645 – 3,650.
If the support holds, consider long entries targeting 3,675 – 3,705.
Stop loss below 3,621.
Risk-to-reward ~ 1:2, suitable for intraday trades.
Alternative scenario (Short if support breaks):
If price breaks below 3,621 with strong volume, bearish pressure may resume.
Downside targets would be 3,600 – 3,588.
Conclusion
Gold is at a critical point today. Holding above 3,645 – 3,650 will favor a bullish continuation toward 3,700+. A breakdown below 3,621, however, would shift the bias back to the downside.
Stay alert and monitor the reaction at these key levels. Save this analysis if you find it useful, and follow along for more daily trading strategies.
