Parallel Channel Observation H1XAUUSD GOLD Update H1 Timeframe 🙌
- This Analysis is based on educational purposes using Technical aspect Parallel Channel 🔋
- Parallel Channel indications for a good bullish opportunities point from 📈
Targets would be at 4026 - 4047 - 4082.00 ✅️
Note : if Channel breaks this idea will be in Invalid ❗️
All you need to stick with one Mentor with Discipline Consistency and Focus Mindset 💯
#XAUUSD
Futures market

November 3, 2025 - XAUUSD Analysis and Potential Opportunity📊 Analysis:
From the chart, bearish momentum hasn’t completely disappeared, and bullish strength hasn’t yet emerged, suggesting that the market may enter a range-bound phase.
I expect the price to consolidate between 3991 and 4010 — within this range, sell near the top and buy near the bottom.
Watch for a clear breakout:
If price breaks above 4010, consider buying pullbacks into support.
If price breaks below 3991, look to sell rallies into resistance.
A quick reminder: the zone between 4010–4045 lacks clear higher-timeframe levels, but there are many minor levels within it.
Conservative traders may prefer to wait until price exits this zone.
Aggressive traders can try light positions near short-term levels — with strict stop losses and small size.
🔍 Key Levels to Watch:
• 4065 – Resistance
• 4050–4058 – Resistance zone
• 4045 – Resistance
• 4020–4030 – Resistance zone
• 4010 – Upper boundary of range / resistance
• 4000 – Psychological level
• 3991 – Lower boundary of range / support
• 3971–3980 – Support zone
• 3960 – Key support
• 3947 – Support
📈 Intraday Strategy:
SELL: If price breaks below 3991 → target 3987, with further downside toward 3984, 3980, 3975
BUY: If price holds above 4010 → target 4015, with further upside toward 4020, 4025, 4030

Warm November vs. Record LNG: Why Gas Holds $4Weather – Strong Bearish Driver: Actual NOAA forecasts (6–10d and 8–14d) are consistently warm, with a 70% probability of above-normal temperatures in key regions. This is a strong bearish factor for heating demand.
EIA: The latest report (Oct 30) showed a +74 Bcf injection vs. a +71 Bcf consensus. That’s a bearish factor. Total storage remains +171 Bcf above the 5-year average.
LNG exports: On October 25 we had a record 17.3 bcfd, and on November 1 the market expected 17.9 bcfd — a new all-time high. That’s +0.6 bcfd in a week, which is a lot for late October. A powerful bullish driver.
Storage is high and the weather is warm, but price is not falling because everyone is watching the LNG number at 17–18 bcfd.
Because of the U.S. government shutdown, CFTC (COT) reports are not being published. Nobody sees the real positioning of large funds.
Fundamentals are pushing down, technicals are pulling up, and the lack of COT does not allow the trend to be confirmed.
The seasonal weight of weather in November puts weather in the first place in terms of price impact.
Exports are very strong, almost record level — that’s why the market doesn’t want to drop even when weather and storage are “bearish.” In this context LNG acts as a support and explains why price is still holding below 4.20 instead of pulling back to 3.6.
Weather is bearish right now, which means you cannot just “relax and hold a trend long.”
The market has formed an upper range and will wait to see what changes first — a shift in NOAA (warmer/colder) or a drop/disruption in LNG. That’s what will drive the next move.
A short from a false breakout of 4.18 and buys from levels are intraday trades.

Silver Buy PlanSilver Buy Plan
I’ll wait for confirmation before taking a buy trade.
Recently, a CISD formed, which may push the price lower. There’s a strong bullish order block sitting much lower, and that zone can act as the base for an upward move.
For now, I’ll just observe the market closely. Once price action aligns with my criteria, I’ll look for a buy setup.
We already have a sweep of the previous low, and my first target will be around the equilibrium or the previous week’s level.

Ascending triangle gaps end of earnings (just about) correction?All the earnings releases and positive impact of business investment in AI gave the market anther move higher, but what now everything is so stretched gaps appearing and a negative pattern suggest a correction, the question how far ?

XAGUSDHow to become successful in forex and stock trading:
1.Master fundamentals and technical analysis.
2.Build and follow a solid trading plan.
3.Apply strict risk management (4–6% rule).
4.Stay disciplined—control fear and greed.
5.Record and analyze every trade.
6.Focus on high-quality setups only.
7.Diversify across assets and markets.
8.Keep evolving—study, adapt, and grow daily.

Bullish GoldBased on the analysis of supply and demand points and fundamental conditions, it seems that gold will be in demand next week and will grow by about 10%.
This analysis is valid as long as the global price of an ounce does not fall below $3,970.

US OILHI GUYS,
We are still selling as illustrated months ago, nothing has changed , no correction on technical just a clean update on sell entries H4, H3 CHART and price patterns for speed on entry

Gold: Technicals vs. Fundamentals as Prices DipGold is currently facing significant downward pressure, recently touching its lowest point since early October and dipping below the $4,000 mark. This bearish sentiment is largely fueled by two key factors: cautious remarks from Federal Reserve Chairman Jerome Powell regarding policy easing, and a noticeable de-escalation in the ongoing trade tensions between the United States and China.
As traders, we're now watching for the next catalyst. Upcoming macroeconomic data from the US, coupled with further commentary from Fed officials, will be critical in shaping Gold's near-term valuation.
The December Rate Cut: Not a Done Deal
While the market has been pricing in potential rate cuts, it's important to remember that a cut in December is not yet a certainty. This ambiguity is keeping buyers on the sidelines and adding to the metal's weakness.
A Look at the Charts (Technical View)
From a technical perspective, Gold is at a critical juncture. The key breakout level to watch is the $4050 - $4060 area.
The Bullish Case: If Gold can decisively break above this $4050/$4060 resistance, it would open the door for a test of the next significant level, around $4150 / $4160.
The Bearish Case: However, until Gold can firmly establish itself and stabilize above the $4150/$4160 zone, the risk of a deeper correction remains very high till $3700
We are observing a recurring pattern: Gold is repeatedly failing at immediate trendline resistance levels. In technical trading, this is often a classic sign that the market is weak and may be poised for a further decline, assuming there are no major fundamental surprises.
Trading Strategy: Patience is Key
For those of us looking to enter long-term buy positions, a two-pronged approach is necessary:
Fundamental Watch: Keep a close eye on fundamental developments. Specifically, any new updates regarding US-China tariffs or shifts in the Federal Reserve's tone on interest rates will be major market movers.
Technical Confirmation: Patience is required. We must wait for a confirmed technical breakout above the $4150 / $4160 area. Until this happens, the bearish pressure is likely to continue. Otherwise, gold still have bigger chances to test $3700 before it rise again.

Gold Trading Strategy for Monday
News:
Gold (XAU/USD) remained under pressure this week, falling below $4,000 at one point and hitting its lowest level since early October, influenced by Federal Reserve Chairman Jerome Powell's cautious remarks and easing US-China trade tensions.
Considering all factors, future US economic data and speeches by Federal Reserve officials will be key catalysts in determining the direction of gold prices.
Specifically:
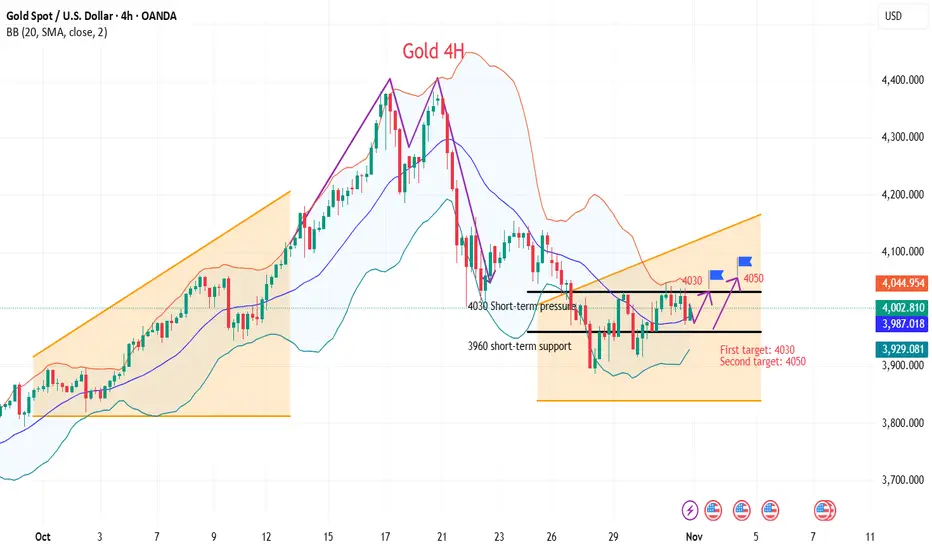
From the 4-hour chart, the current short-term resistance level to watch is 4035-4030, with a key resistance level at 4055. Short-term support is around 3960. The overall trend remains upward, so the recommended strategy is to buy on dips and patiently wait for key entry points.
Specific trading strategies will be provided in the channel; please pay attention.
I believe the overall market will maintain a period of fluctuation before continuing its upward trend. Judging from the current market situation, the bottom has been established, but the upward trend has not yet started. In particular, the repeated fluctuations and shakeouts on Friday have added more uncertainty to the market.
This is mainly because market sentiment is currently quite divided. The US-China trade tariff issue is in a tug-of-war, and the Russia-Ukraine situation has begun to ease, but these remain unresolved issues. Although bullish momentum has slowed, it's not enough to reverse the bull market trend. The more important factors are US Treasury bonds, the Fed's interest rate cuts, and the cessation of balance sheet locking.
Therefore, after a short period of tug-of-war between bulls and bears, the market will likely rise again later.
Trading strategy:
Buy:3980-3975, SL: 3960, TP: 4000-4030-4060
XAU/USD "SET AND FORGET" PLAN OF THE WEEK🟡 XAUUSD (Gold) – Weekly Outlook Plan
Timeframe: H4 / Daily
Bias: Bearish after short-term pullback
🔍 Market View
I expect gold to make a small bullish correction up to the 4030–4060 zone, where we may see rejection candles forming.
Once rejection is confirmed (strong bearish candle from resistance), I anticipate a drop toward 3900 during the week.
💼 Trade Setup (For Educational Purposes Only)
Parameter Details
Symbol XAUUSD
Entry 4003 (after pullback confirmation)
Stop Loss (SL) 4063
Take Profit (TP) 3900
Sample Lot Size 0.01
Risk ≈ $60
Reward ≈ $103
Risk : Reward 1 : 1.7
📉 Trade Plan Notes
Wait for rejection candle (bearish engulfing / pin bar) around 4030–4060 zone before entering.
Trade may move fast once rejection occurs, but could also develop over several days.
this is a SET AND FORGET STRATEGY PLAN ;)
NOTE! for those that are concern and like to take profits before
Manage position carefully and move stop loss to breakeven if price breaks below 3970 with momentum.
⚠ Disclaimer
This analysis is for educational purposes only.
Trade responsibly and always manage your own risk.

SILVER (XAGUSD) | 100-Year Setup Bracing for $3,382 Surge🥈 SILVER | The Supercycle Unfolding — Eyeing $243, Then $3,382 ⚡
Silver has been following a textbook Elliott Wave Supercycle since the 1970s. Wave 1 topped in 1980 near $50, Wave 2 bottomed in 1991 with a deep 0.786 retracement , and since then, we’ve been in a massive Wave 3 that’s still playing out.
Within this ongoing Supercycle Wave 3, we’ve seen five major macro waves:
Wave 1 (1991–1998) – the first impulsive leg.
Wave 2 (1998–2001) – retraced 0.786.
Wave 3 (2001–2011) – the big run to $49.
Wave 4 (2011–2020) – a long 0.5 retracement and re-accumulation phase.
Wave 5 (2020–Now) – the current and final advance of this Supercycle wave.
Inside the current Macro Wave 5 , we’ve already seen Micro 1 top in 2021, Micro 2 bottom in 2022 (0.5 pullback) , and now Micro 3 is underway , targeting the 2.618–3.618 Fib zone ($71–$123) . After that, a Micro 4 correction should follow (around 0.382–0.5), then Micro 5 could push to roughly $243 , which aligns with the 1.618 extension of the entire Supercycle (1)-(2) .
That $243 level may mark the end of Supercycle Wave 3 , setting up for Wave 4 , a long-term correction likely into the $90–$120 rang e (0.382–0.5 retracement). From there, the final Supercycle Wave 5 could begin — a massive impulsive phase aiming for the 2.618 Fibonacci extension near $3,382 🌕
The structure, Fibonacci ratios, and long-term fundamentals all support this roadmap. Industrial demand (solar, EVs, electronics) and ongoing monetary debasement continue to build the fundamental base for a multi-decade silver bull cycle.
📈 We’re in the late stages of Supercycle Wave 3 — and the calm before silver’s next historic acceleration. ⚡
Follow this century-long Silver Supercycle closely — the final wave is unfolding and $3,382 is in sight. Bookmark this idea to track each micro and macro move, and comment your target or thoughts on the Wave 5 breakout. Let’s see who spots the historic setup first!
— Team FIBCOS
#Silver #PreciousMetals #Supercycle #ElliottWave #Fibonacci #MarketStructure #SmartMoneyConcept #LongTermBull #TradingSetup #TechnicalAnalysis #MacroTrend #Commodities

StevenTrading - $XAUUSD$: New Week Perspective – Prioritize...StevenTrading - OANDA:XAUUSD $: New Week Perspective – Prioritize BUYING According to Elliott Wave 5, Awaiting Range $3961$
Hello everyone, StevenTrading is back with the Gold scenario for the new trading week!
After a period of strong volatility, I am leaning towards more buying scenarios according to Elliott Wave 5.
Although retesting deeper support levels is possible, the technical structure still shows potential for price increase.
Initially, the structure on H1 is showing that the price is moving sideways within a wide range.
We will watch the price range to trade before Gold officially breaks the barrier!1.
📊 TECHNICAL STRUCTURE ANALYSIS
Elliott Wave: Prioritize the development scenario of Wave 5. This reinforces the medium-term upward trend.
H1 Structure: The price is fluctuating within a wide range, creating opportunities for Scalping/Day Trade at the upper/lower boundaries.2.
🎯 DETAILED TRADING PLAN (ACTION PLAN)
Our trading strategy this week is to actively buy at the lower boundary and defensively sell at the upper boundary to maximize the price range.
Primary BUY Scenario (BUY Primary):
We will patiently wait for Gold to adjust to the $3961$ area, an important liquidity support zone (near the Buy Liquidity/Buy Zone on the charts).
This is an ideal entry point to join the upward momentum according to Elliott Wave 5.
The Buy order will be activated at $3961$ with a stop loss SL $3950$ (set below support $3954$) to preserve capital.
Profit targets are divided into ascending levels: TP1 $3975$, TP2 $3990$, TP3 $4012$, and the final target is $4035$ as the price approaches the upper boundary.
SELL Scalping Scenario: To defend and take advantage of the adjustment, we will watch to Sell just below the strong resistance area at $4050$ (near old resistances and barrier zones). The Sell order will be placed with a tight stop loss SL $4060$. Profit targets will be prioritized for short-term (Scalping) to quickly secure profits.3.
📌 SUMMARY & DISCIPLINE (Steven's Note)The goal is to patiently wait for $3961$ to execute the BUY position with the lowest risk, pursuing the Elliott Wave 5 target. Capital management discipline and compliance with SL are mandatory in this wide range trading phase.
Are you ready to take advantage of this price range?

Gold consolidation selling pressure sidesGold is currently in a consolidation phase after testing the upper boundary of its bullish trend. Despite the broader uptrend, price weakness and shifting market sentiment are creating downward pressure.
Technically, gold is showing signs of selling pressure, suggesting the bullish momentum may be losing strength. If the current structure holds, the path of least resistance appears to be to the downside. We could see gold move lower toward the 3980–3960 support zone in the near term, provided that selling momentum continues and no new bullish catalysts emerge.
You may find more datils in the chart.
Trade wisely best of Luck Buddies.
Ps; Support with like and comments for better analysis Thanks for Supporting.


US OILHI GUYS,
US OIL , we are still selling on weekly chart to area of interest as we expect RT DAILY SOON.

GOLD: HAWKISH FED Pushing the Market? $4,085 is the Test!Hey community, Gold is sitting at a critical junction. The alignment of the Fed’s pressure and a key Supply Zone is creating a high-conviction trade setup. Let's break it down.
I. FUNDAMENTALS: The Macro Headwinds 📰
Key Driver (The Bears' Argument): The Fed’s latest "hawkish" signals, with regional Presidents opposing further rate cuts, have significantly cooled market easing expectations. This solidifies the strong USD, creating heavy short-term pressure on non-yielding Gold.
Performance & Record High: Despite the immediate pressure, Gold surged 53% this year, hitting an all-time high of $4,381.21/oz on October 20th, showcasing underlying bullish demand.
Long-Term View: Morgan Stanley still supports Gold’s long-term climb (targeting $4,300/oz average by H1 2026), driven by expected rate cuts and economic instability.
Geopolitics: Trade news (e.g., discussions on US-China tariffs) adds noise, but the Fed's interest rate stance remains the dominant factor.
II. TECHNICAL ANALYSIS: The Supply & Demand Zones 🎯
The prevailing structure on the H4 chart confirms a strong DOWNTREND (Bearish Bias). The recent rally is a correction, necessary to retest key supply before the next decline.
1. The Primary SELL Setup (Following the Trend)
Optimal Supply Zone: $4,059 - $4,085. This is the key reversal zone where smart money is likely waiting to fill sell orders (discount zone for shorts).
Strategy: Wait for price to reach the $4,059 - $4,085 zone. Look for a strong rejection or pattern shift on lower timeframes to confirm the SHORT entry.
Ultimate Target (TP): The strong Demand Zone at $3,939 - $3,952.
2. The Counter-Trend BUY Zone (Bounce Potential)
Strong Demand Area: $3,939 - $3,952. This is a major structural level where Gold is likely to find strong support.
Strategy: If Gold sells off into this area, watch for buying pressure to catch a potential bounce.
🔑 FINAL TRADE CONCLUSION
Best Strategy: Wait and SHORT at the $4,059 - $4,085 Supply Zone. This is where fundamental pressure (Fed) and technical resistance perfectly align.
What's your take? Will the strength of the USD hold Gold down from here? Drop a comment! 👇
#XAUUSD #GOLD #FED #TechnicalAnalysis #ForexTrading #SupplyAndDemand #Bearish #TradingStrategy #PriceAction #MarketAnalysis

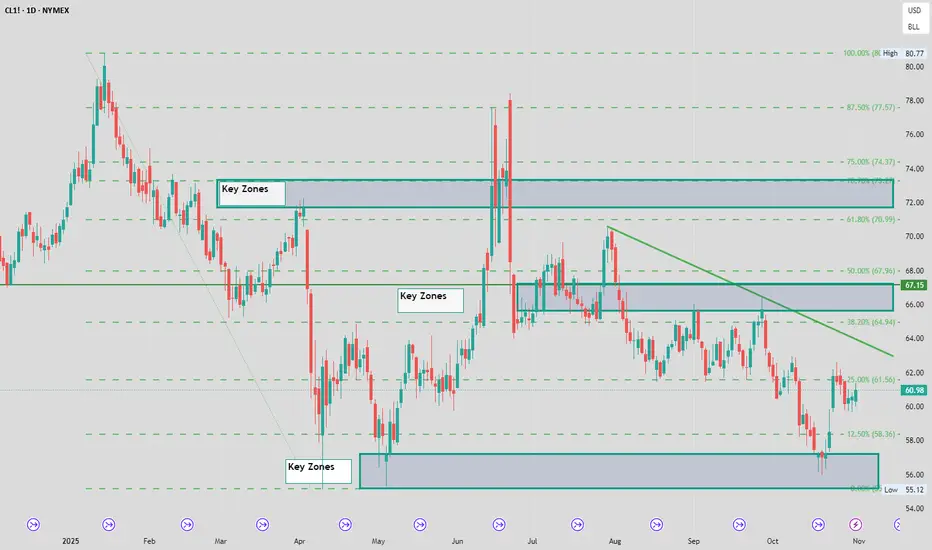
CL been the same all year - 2025 The song remains the same in CL this year aggressive moves higher get met with selling and big sell off's run into buyer range bound and key areas been mapped.
Xaausd planHello! Shorttime plan is finished.
1h timeframe:
We have a FVG that must fills around price 3980.
This is smart money concept.
Let price go down to FVG(support), wait for a confirmation, like a bullish engulfing, hammer candle.
Maybe the last time xauusd going down to 3980 before is go higher to 4060-4100
Entry: 3980-3990
Sl: 3965-3975
Tp1: 4030
Tp2: open to maximize, move sl to breakeven after tp1 hit and close manually later.
Are you bullish on gold?

GOLDGOLD is still upside for us, next reaction will be above 4100.
Disclosure: We are part of Trade Nation's Influencer program and receive a monthly fee for using their TradingView charts in our analysis.

Gold vs Euro: Perfect Bullish Entry Opportunity! Swing Trade🎭 The Gold Heist: XAU/EUR Multi-Layer Entry Strategy | Swing/Day Trade Setup
📊 Asset Analysis
XAU/EUR (Gold vs. Euro) - The shiny metal vs. the continental currency
Bias: 🐂 BULLISH - Time to fill those bags!
Strategy Type: Thief's Layered Entry System (Multi-Limit Order Approach)
🎯 The Master Plan: "Thief Style" Multi-Layer Entry
💰 Entry Zones - The Layering Game
This setup uses a layered entry strategy (aka "Thief Style") with multiple limit orders spread across key price levels. Think of it as setting multiple traps to catch the golden opportunity!
Suggested Layer Entry Points:
🥇 Layer 1: 3425.00
🥈 Layer 2: 3450.00
🥉 Layer 3: 3475.00
💎 Layer 4: 3500.00
Pro Tip: You can add more layers based on your risk appetite and account size. Scale in, don't go all-in on one price level!
Alternative: If layering isn't your style, you can enter at any current price level based on your own analysis and conviction.
🛡️ Risk Management
🚨 Stop Loss: 3400.00
This is the "Thief's Emergency Exit" - if price breaches this level, the heist didn't go as planned.
⚠️ Important Notice: Dear Traders (Thief OG's),
This stop loss level is based on my analysis. However, YOU are the captain of your own ship! Set your SL based on your risk tolerance, account size, and trading plan. Trade at your own risk and always protect your capital first.
🎯 Target Zone: The Escape Route
💵 Take Profit: 3625.00
There's a "police barricade" (strong resistance zone) around this level where:
🚧 Strong resistance cluster
📈 Potential overbought conditions
Bull trap risk increases
Smart Money Move: Consider scaling out profits as you approach this zone.
⚠️ Important Notice: Dear Traders (Thief OG's),
This target is my projection based on technical levels. YOU decide when to take profits! Some prefer to lock gains early, others ride trends longer. Make decisions that align with YOUR trading plan and risk management rules.
🔗 Related Pairs to Monitor
Keep an eye on these correlated markets for confluence:
EUR/USD - Inverse correlation; Euro strength impacts XAU/EUR directly
DXY (US Dollar Index) - Gold's traditional nemesis; watch for divergences
XAU/USD (Gold/Dollar) - The big brother pair; shows overall gold strength
GC Futures (Gold Futures) - Institutional positioning and volume analysis
XAG/EUR (Silver/Euro) - Precious metals correlation check
Key Correlation Point: If EUR/USD strengthens significantly, it could compress XAU/EUR gains. Watch for Euro zone economic data and ECB policy shifts.
📈 Technical Synopsis
This setup combines multi-timeframe analysis with a strategic layered entry approach. The bullish bias is based on . The layered entry strategy allows for better average price positioning while managing downside risk with a clearly defined stop loss.
The target zone represents a key resistance cluster where profit-taking is recommended as price action may face rejection or consolidation.
⚖️ Disclaimer
This is a "Thief Style" trading strategy shared purely for educational and entertainment purposes. This analysis represents one trader's view and should NOT be considered financial advice.
✅ Always do your own research (DYOR)
✅ Never risk more than you can afford to lose
✅ Past performance doesn't guarantee future results
✅ Cryptocurrency and commodity markets are highly volatile
✅ Consider consulting a licensed financial advisor
Trading involves substantial risk of loss. You are solely responsible for your trading decisions.
✨ If you find value in my analysis, a 👍 and 🚀 boost is much appreciated — it helps me share more setups with the community!
#XAUEUR #GoldTrading #SwingTrading #DayTrading #ForexTrading #ThiefStrategy #LayeredEntry #GoldVsEuro #TechnicalAnalysis #TradingStrategy #RiskManagement #CryptoTrading #PreciousMetals #BullishSetup #TradingIdeas #ForexSignals #GoldAnalysis #MultiLayerEntry #SwingTrade

All is nothing...When the war begins, all resistance, all supply, all trendline, all dream about discount is nothing.

Emphasis on goldThis is Saturday night. Warren Buffett's very bearish on gold but a better way to look at it in my opinion is that the pattern is going to actually take the market lower than where it is now probably around the 50% but I think it's going to go to the 618 and possibly lower///and that doesn't mean that the market's bearish it's better to think of this as the market trading the patterns it had a wonderful move higher and so you would expect the market to have a very good move when it goes lower and you can use this with your trading decisions////if the market goes lower it's an opportunity to take a long trade if you have a good setup with a good 2 bar reversal going higher.
