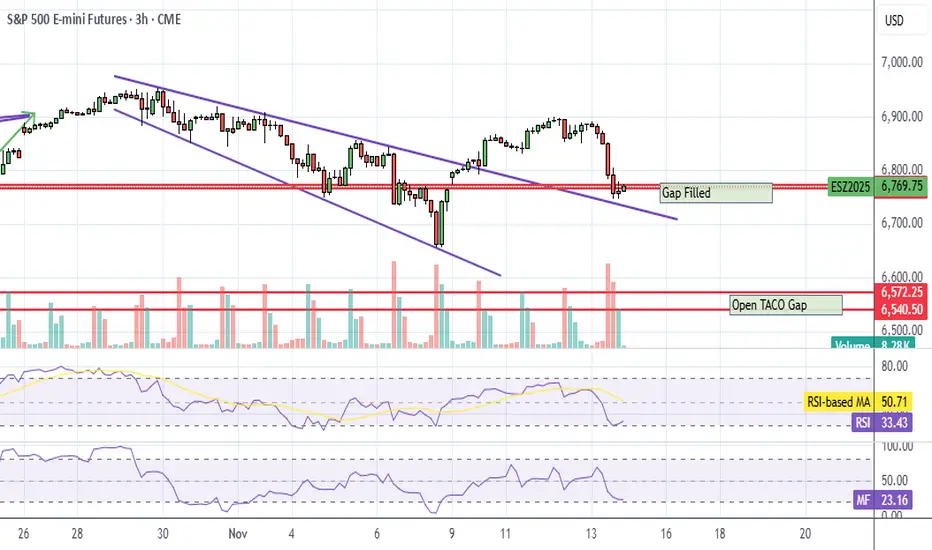
ES UpdateSunday gap filled and RSI hit oversold but MFI didn't, I guess that explains the weakness at close.
It might drop tomorrow morning then rebound in the afternoon after MFI gets oversold.
Futures market
Gold price recovers to 4250, nearest target⭐️GOLDEN INFORMATION:
Gold (XAU/USD) extends its rally to around $4,195 during the early Asian session on Thursday, marking its highest level since October 21. The metal gains ground as investors await a crucial US House vote to end the record-long government shutdown, which could bring economic clarity and shape the Federal Reserve’s (Fed) next policy steps. Later in the day, Fed officials Neel Kashkari, Alberto Musalem, and Beth Hammack are scheduled to speak.
The House of Representatives is expected to vote on the Senate-approved funding bill, backed by Democrats, to reopen the government and restore federal operations through January 30.
⭐️Personal comments NOVA:
Bulls are positive, expecting the final cut in December. Gold prices return to the above 4200 price zone.
⭐️SET UP GOLD PRICE:
🔥SELL GOLD zone: 4252 - 4250 SL 4257
TP1: $4240
TP2: $4220
TP3: $4200
🔥BUY GOLD zone: 4148 - 4146 SL 4141
TP1: $4160
TP2: $4175
TP3: $4190
⭐️Technical analysis:
Based on technical indicators EMA 34, EMA89 and support resistance areas to set up a reasonable BUY order.
⭐️NOTE:
Note: Nova wishes traders to manage their capital well
- take the number of lots that match your capital
- Takeprofit equal to 4-6% of capital account
- Stoplose equal to 2-3% of capital account

From Gold to Silver — The Next Big Move on XAGUSD Following our previous series of Gold analyses, where that massive drop unfolded exactly as projected,
this time we’re turning our focus to Silver (XAGUSD) ⚡️
After completing a clear five-wave decline, Silver has been forming a corrective rally as wave (ii) —and it now seems to be in the final subwaves of this correction.
The market looks ready to kick off wave (iii) to the downside, which is often the most powerful and impulsive leg in the entire sequence! 🔥
📍The current zone is where we expect the correction to end and the main bearish trend to take control once again.
As always, patience and precision matter most here — the next move could define the market’s direction for the coming weeks.
--------------------------------------------------------------------------------------------
🚀 Who am I?
I'm Mahdi, a prop firm trader with 7+ years of experience in technical analysis, mainly focusing on Smart Money Concepts and Elliott Wave theory.
I specialize in delivering high-quality trading signals, market insights, and educational content tailored for serious traders and investors.
📊 My Tools: SMC, Elliott Wave, Fibonacci, Liquidity Grabs, Order Blocks
💼 Prop Challenge Passed: Yes | Funded Account: In Progress
🔗 Follow for consistent updates and trading insights.

XAU/USD Gold strong buy trend resistance breakout bullish move📈XAU/USD (Gold) Update
Gold showing strong bullish momentum — recent resistance breakout confirms upside strength.
Current bullish entry zone around 4210 looks promising for continuation.
🎯 Technical Target: 4377 (Supply Zone / All-Time High)
⏱ Timeframe: 4H
🟢 Bias: Bullish
⚠️ Note: Always apply proper risk management — protect your capital first!
If you found this useful — Like, Follow, Comment & Share 💬✨
#XAUUSD #GoldAnalysis #TradingSetup #Forex #TechnicalAnalysis #PriceAction #Bullish #RiskManagement

Silver SurferI had this chart published already, it seems it was unpublished, perhaps I violated terms and conditions. Any who, I predict silver will fall. I took a short position at 51.858. Stay tuned.

After hitting resistance level going to target Gold is trading around 4080, showing a strong bullish momentum after bouncing from the support trend line. The price has broken above the previous resistance level, confirming an uptrend continuation. As long as it holds above the 4039 support zone, the bullish bias remains strong. The next potential target is 4153, where price may face some resistance before further upside movement.

Is it Black Friday? No need to panic, strategy updateGold has closed. During the latter half of the US session, influenced by news, it fell to around 4180, finding support and reaching a high of 4211. Gold prices then fell sharply again, briefly dropping to 4145 USD before slightly recovering. Having already risen over 200 points this week, this upward move was too rapid, and the consolidation period was too short, resulting in weak upward momentum. While reaching 4250 is only a matter of time, short-term trading requires careful attention to timing. The excessive pullback during the US session has led to a correction, potentially breaking the current uptrend. Therefore, a cautious approach is advised, avoiding blindly chasing the upward trend and patiently waiting for a stabilizing signal after a pullback. This is currently a more prudent and cost-effective choice. Following market rhythm and acting according to the trend is the core principle of investing. From the current structure, the support area to watch is the 4130-40 range. Resistance is at 4175-85, and the closing price is around 4170. Will this be a Black Friday? Don't panic. Our operations will be updated based on the opening market trend and news. Just stay tuned.
I focus solely on short-term trading and clear market analysis. In short-term trading, there is no market that goes up or down forever, only the right entry point at any given moment. Find the rhythm and follow the trend. That's the essence of trading. We made 5 trades this trading day, including both long and short positions, all of which were sold at a profit. You can check the historical recommendations to verify their accuracy. For example, we sold a long position at 4193 at 4202, which rose to a high of 4211. Don't regret selling too early at that point. We have our own profit targets and risk management for each trade. Once the profit target is reached, we sell. Although I am a professional trader, it's not necessary for me to buy at the lowest and sell at the highest point in every trade. After all, I'm just a trader; I don't have God's perspective! Therefore, we need to adjust our mindset, only earning what's rightfully ours. Profit and loss are part of trading; focus on overall returns.
If you can't execute trades precisely, try the method I teach you: first, use a small position to test the market, then add to your position during pullbacks or rallies. This way, you won't miss any opportunities. If you're truly unsure when, where, and how to proceed, let's work together to flexibly and steadily pursue greater returns in the ever-changing market!

How to Trade Crude Oil with Smart Money Concepts SMC Explained
Smart Money Concepts is one of the most reliable techniques for trading WTI Crude Oil.
In this article, I will teach you a profitable SMC strategy for analysing and trading USOIL futures and CFD.
This simple strategy is based on an important event every SMC trader should know - a break of structure BoS.
In a bullish trend, the best break of structure will be based on a violation and a candle close above a current higher high.
It will signify a highly probable bullish continuation and provides a great opportunity to buy
Though you can spot a bullish break of structure on any time frame, the most reliable one is a daily.
After a formation of a new high, I suggest waiting for a short term intraday correctional movement.
With a high probability, the market will retest a recently broken structure and smart money will manipulate the market, pushing the price below that, making buyers close their positions.
Once the market starts retracing, analyze an hourly time frame. The price will need to establish an i ntraday minor bearish trend.
In this bearish trend, 2 trend lines should connect lower highs and lower lows composing an expanding, parallel or contracting channel - a bullish flag pattern.
Your best signal will be a breakout of a resistance line of the flag and a violation of the level of the last lower high - a bullish change of character of a liquidity grab.
It will confirm a completion of a correction.
Buy the market on a retest of the level of the last higher low, it will be your best entry.
Set your stop loss at least below a trend line and aim at the next strong daily resistance.
That will be a perfect model for trading break of structure on WTI Crude Oil.
We spotted such a setup in my trading academy on one of the live streams with my students.
WTI Crude Oil was trading in an uptrend on a daily time frame.
A bullish violation of the last Higher High and a candle close above that confirmed a Break of Structure BoS.
The price started a correctional movement then, and we spotted a bullish flag pattern on an hourly time frame.
The market completed a correction after grabbing a liquidity below a broken structure.
A bullish movement started then, and the price violated a resistance line of the flag and the level of the last lower high.
These 2 breakouts confirmed a completion of a correction and a resumption of a bullish trend.
We opened a buy position immediately on a retest of a broken level of the last lower high.
Stop loss was below a trend line, take profit was based on the closest key daily resistance.
And the price went straight to the target.
Break of Structure BoS will be useful for analysis, forecasting and trading WTI Crude Oil.
Combining that with top-down analysis and lower time frames confirmations will provide accurate signals and profitable trading setups.
Integrate a price model that I shared in your strategy, and good luck to you trading USOIL!
❤️Please, support my work with like, thank you!❤️
I am part of Trade Nation's Influencer program and receive a monthly fee for using their TradingView charts in my analysis.

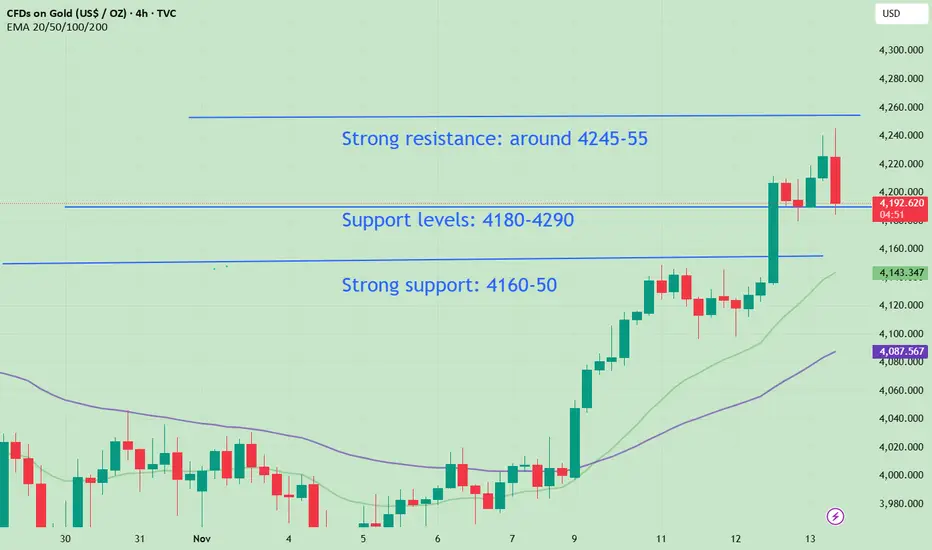
Can Gold Reach 4200 in the US Session? Strategy Update
Gold faces resistance in the 4245-55 area we mentioned, failing to break through multiple times. Support lies at 4180-90. Currently, aggressive traders can consider buying in batches near 4185. However, considering the increased volatility in the later US session and the uncertainty surrounding data releases, conservative traders should remain on the sidelines. This advice is time-sensitive, and updates within this channel may be delayed. Watch for a break above $4245. If it rises further, watch for resistance at $4275 or even $4300. Failure to break through will likely result in continued consolidation.
I focus solely on short-term trading and clear market analysis. In short-term trading, there is no perpetually rising or falling market, only the right entry point, finding the rhythm, and following the trend. This is the essence of trading. For example, our long position near 4220 was sold at 4232 for a profit. Today's trades also include short positions, all of which are profitable. Currently, you must seize every opportunity to buy on pullbacks. If you cannot execute trades precisely, try my method: first test the market with a small position, then add to the position on pullbacks. This way, you won't miss any opportunities. If you're truly unsure when, where, and how to proceed, let's work together to flexibly and steadily pursue greater returns in the ever-changing market!
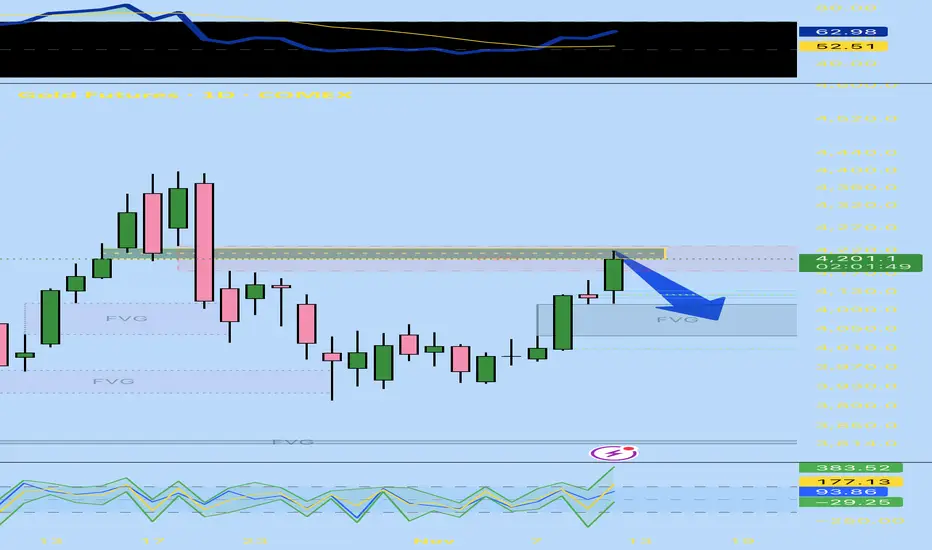
Caught between a Volume Imbalance and 2 FVGsI’m looking at the bullish volume imbalance that is overlapping a bearish fair value gap. Price just made a bullish run leaving a bullish fvg behind. I think we drop out of this fvg and vi and head back down towards the bullish fvg around 4050.
I’m guessing we go back to around 4050 over the next couple days.
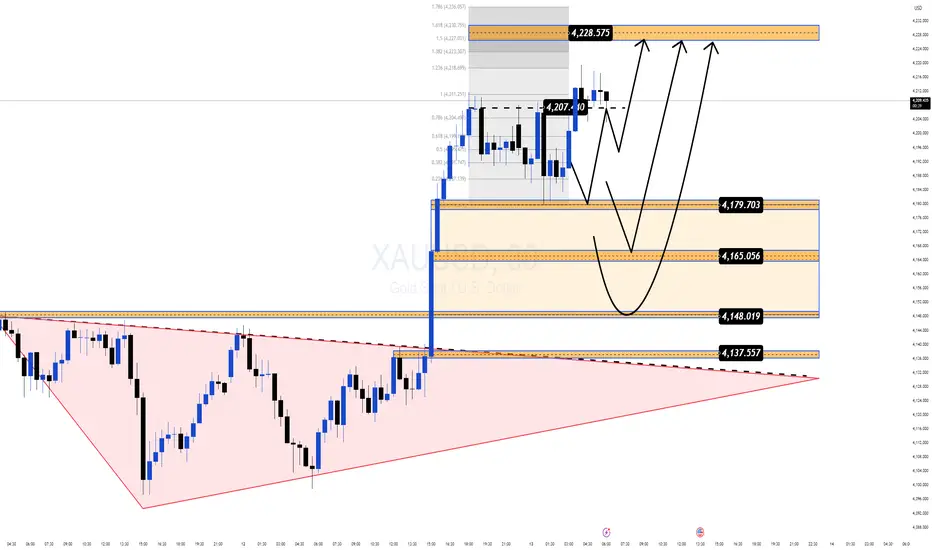
Gold Hits a 3 Week High but the Real Move Might Still Be LoadingGold just tapped $4,213 — the highest level in three weeks, powered by growing expectations of a dovish Fed and optimism around the potential reopening of the US government.
But the real story isn’t the headline spike — it’s the structure forming right beneath it.
📌 Why this zone matters right now
Price is pulling back into $4,179–$4,165, a clean Demand zone aligning with Fibo + breakout structure.
Buyers remain firmly in control despite a mild USD recovery.
The market swept liquidity around $4,207, hinting at accumulation before the next expansion.
The broader pattern resembles a falling-wedge breakout, often appearing before strong upside continuation phases.
🎯 Most Probable Scenario (Mind Insight)
Gold is in a “compression before expansion” phase.
Once this squeeze resolves, momentum is likely to continue in the direction that’s already dominant — and right now, that’s the bulls.
🔶 MMF BUY Zone
$4,179 → $4,165
Looking for a shallow pullback before the next leg.
🔼 Bullish Targets
• $4,207 (liquidity tap)
• $4,228 (Fibo 1.618)
• $4,236 (Fibo 1.786 — major reaction zone)
🧠 Key Takeaway
As long as Gold holds above $4,165, the bullish structure remains intact and the upside expansion toward the upper Fibo cluster stays in play.
Lingrid | GOLD Possible False Breakout - Correction Setup OANDA:XAUUSD has extended its rally after a clean breakout from the range zone, now testing a confluence area near 4,155 within the resistance zone. The structure forms a steep upward channel with a potential short-term exhaustion pattern near the upper boundary. If price fails to sustain above 4,150, a corrective pullback toward 4,065–4,000 could unfold. The broader momentum remains bullish but stretched, suggesting a possible pause before continuation.
⚠️ Risks:
A breakout above 4,150 could accelerate momentum toward 4,220.
Softer U.S. inflation data may weaken USD and fuel further gold demand.
Rising geopolitical tensions could boost safe-haven inflows, invalidating pullback scenarios.
If this idea resonates with you or you have your own opinion, traders, hit the comments. I’m excited to read your thoughts!

ElDoradoFx – GOLD ANALYSIS (14/11/2025, ASIA SESSION)
1️⃣ Market Overview
Gold enters the Asia session trading around $4,171, following a strong bearish rejection from the $4,225–$4,245 supply region during the US session. The aggressive sell-off broke several intraday bullish structures and brought price back toward the mid-range of the weekly consolidation.
Buyers are attempting to stabilize price above the 4,160–4,165 intraday support cluster, but momentum remains weak as the descending trendline from $4,245 continues to cap upside attempts.
Gold is currently compressing between a falling intraday trendline and rising 200 EMA support, suggesting a tight coil before the Asia–London volatility window.
⸻
2️⃣ Technical Breakdown
🔹 Daily (D1)
• Gold printed a rejection wick below $4,181, but remains below the daily 10EMA.
• RSI sits at ~61, still bullish but cooling off from overbought levels.
• Daily support at $4,026–$3,920 remains intact.
• A daily close back above $4,200 would signal a bullish re-accumulation, while losing $4,155 risks a deeper pullback into $4,105–$4,098.
⸻
🔹 1H Chart
• Strong bearish momentum from the $4,245 high created a BOS to the downside; structure is now bearish-to-neutral.
• Price is currently stuck under the descending trendline while sitting just above the 200 EMA zone (4,165–4,170).
• RSI around 42, showing sellers still in control.
• MACD histogram is heavily red but flattening, indicating exhaustion from the initial drop.
• Intraday supply sits at 4,185–4,200, while support sits at 4,155–4,165.
⸻
🔹 15M–5M
• Short-term structure shows clear lower highs and repeated failures at 4,174–4,178.
• MACD momentum remains bearish, but weakening — suggesting a possible retest of structure before continuation.
• Asia liquidity is showing compression between rising micro-trendline and descending resistance, forming a symmetrical triangle.
• A breakout from this intraday wedge is likely the session’s decisive move.
⸻
3️⃣ Fibonacci Analysis
Last major swing: 4,098 → 4,245
• 38.2% = 4,189
• 50.0% = 4,171
• 61.8% = 4,153
🎯 Golden Zone: 4,171 – 4,153
Price is currently inside the Golden Zone — a sensitive area for either a bounce or deeper continuation.
⸻
4️⃣ High-Probability Trade Scenarios
📈 BUY SCENARIO (Countertrend Rebound From Golden Zone)
• Entry Zone: 4,171 – 4,153
• Targets:
→ 4,185
→ 4,198
→ 4,210
→ 4,225
• Stop Loss: Below 4,145
• Confirmation: Bullish engulfing or CHoCH on 5M/15M from inside the Fibonacci cluster.
⸻
📉 SELL SCENARIO (Main Bias Due to Rejection at 4,245)
• Entry Zone: 4,185 – 4,198 (intraday supply + descending trendline)
• Targets:
→ 4,171
→ 4,160
→ 4,145
→ 4,125
• Stop Loss: Above 4,205
• Confirmation: Rejection candle, RSI divergence, or repeated failure to break the descending structure.
⸻
💥 Breakout SELL Setup
• Trigger: Break & close below 4,155
• Retest Zone: 4,160–4,165
• Targets:
→ 4,145
→ 4,130
→ 4,105
• Stop Loss: Above 4,175
⸻
💥 Breakout BUY Setup (Alternative)
• Trigger: Break & close above 4,200
• Retest Zone: 4,192–4,198
• Targets:
→ 4,210
→ 4,225
→ 4,245
• Stop Loss: Below 4,185
⸻
5️⃣ Fundamental Watch
• Asia session typically quiet, but markets may position ahead of UoM consumer sentiment and Fed speakers.
• DXY remains soft after failing to hold 106.
• Bond yields are flattening — supportive for gold if sustained.
• No major high-impact news until US session, but pre-positioning may cause spikes.
⸻
6️⃣ Key Technical Levels
Resistance:
• 4,185
• 4,198
• 4,210
• 4,225
• 4,245 (major high)
Support:
• 4,171
• 4,160
• 4,153
• 4,145
• 4,125
Golden Zone:
4,171 – 4,153
Break Sell Trigger: < 4,155
Break Buy Trigger: > 4,200
⸻
7️⃣ Analyst Summary
Gold is currently trading inside a major Fibonacci Golden Zone after a strong rejection from the $4,245 high. While price is stabilizing above the 200 EMA, the structure remains bearish on intraday timeframes. Bears remain in control below 4,198, but bulls may reclaim momentum if they defend 4,153 and break above 4,200.
The market is compressing — expect a decisive breakout during Asia–London.
⸻
8️⃣ Final Bias Summary
📉 Primary Bias: Bearish below 4,198, targeting 4,160 → 4,145 → 4,125
📈 Alternative Bias: Bullish breakout above 4,200, targeting 4,225 → 4,245
⸻
🥇 ElDoradoFx PREMIUM 3.0 – PERFORMANCE 13/11/2025 🥇
📅 High-momentum day with strong continuation on buys + swing dominance.
━━━━━━━━━━━━━━━
🪙 XAU/USD (GOLD) Results
❌ BUY –40 PIPS (SL)
🟢 BUY +210 PIPS
🟢 BUY +110 PIPS
🟢 BUY +60 PIPS
🟢 BUY +210 PIPS
🟢 BUY +60 PIPS
❌ BUY –80 PIPS (SL)
🟢 SELL +210 PIPS
🟡 BUY – BE
🟢 BUY +240 PIPS
---
📈 SWING TRADE UPDATE (From 05/11)
🟩 Current Floating Profit: +2,850 PIPS
Trend still running massively in profit.
━━━━━━━━━━━━━━━
💰 TOTAL DAILY GAIN: +980 PIPS
📊 10 Trades → 7 Wins | 2 SL | 1 BE
🎯 Accuracy: 70%
━━━━━━━━━━━━━━━
🔥 Strong continuation, excellent volatility management, and another winning day for PREMIUM 3.0.
👏 Congratulations if you profited! ✅✅✅🚀🚀🚀
— ElDoradoFx PREMIUM 3.0 Team 💼📈

Gold Short: A Great Risk Reward tradeThe previous Gold idea to short failed because Wave C of 2 unexpectedly unfolds in a 5-wave impulse. However, that is not surprising because wave 2 can technically retrace 100% of wave 1.
Over here, I see the completion of 5-wave structure and thus will attempt another short.
The stop will be above wave B and the take profit can be set at the end of wave A. The reward to risk ratio is 9.82:1.
Good luck!

USOIL (WTI Crude Oil) Long Trade ENtryAnalysis:
Price recently formed a strong bullish reaction after an extended down-move. The market pulled back to retest intraday support around 58.60 and is showing signs of stabilization. A bounce from this level could trigger a continuation move toward the 61.20–61.30 resistance area.
Setup Type: Long Position
Entry: Around 58.60 (support retest)
Stop Loss: 57.94
Target: 61.28
Bias: Bullish above 58.60
Invalidation: Break and close below 57.94
#USOIL #WTICrude #CrudeOil #OilMarket #PriceAction #TechnicalAnalysis #TradingView #LongSetup #CommodityTrading #MarketAnalysis

Gold H1 – Gold Awaits U.S. PPI Data After 5-Wave Completion🟡 XAUUSD – Elliott Wave Intraday Outlook | 14/11
📈 Elliott Wave Context
Gold has completed a textbook 5-wave impulsive rally, peaking near 4250 before entering a corrective phase. The current retracement appears to be forming an ABC correction, with price now approaching the C-wave completion zone around 4145–4147.
Today’s focus shifts to the upcoming U.S. Producer Price Index (PPI) report — a crucial inflation indicator that may influence Fed policy expectations and short-term dollar momentum.
• A hotter PPI print could strengthen USD and trigger a brief sell-off from premium zones.
• A softer reading could weaken USD and fuel a renewed push from discount levels.
🔎 Wave Structure Breakdown (H1)
• Wave 1 → Initial breakout from liquidity trap (~4070).
• Wave 2 → Shallow retracement, respecting prior OB.
• Wave 3 → Strong extension into new highs (~4220+).
• Wave 4 → Sideways correction with internal liquidity grab.
• Wave 5 → Final push to ~4250 — marking potential top.
Now the market is tracing an A–B–C corrective structure, with wave C expected to finalize near the BUY ZONE 4145–4147 (SL 4138) before the next bullish leg resumes.
Intraday Trade Zones (Elliott-Based)
🟩 BUY ZONE: 4145 – 4147 | SL 4138
Looking for completion of wave C and bullish reversal confirmation (BOS or mitigation from demand block).
Targets: 4205 → 4230 → 4250
🟥 SELL ZONE: 4245 – 4243 | SL 4252
Scalp opportunity aligning with potential wave B retest or short-term overextension before larger correction.
Targets: 4180 → 4150
📌 Summary
Gold remains technically bullish after completing a 5-wave structure but is currently digesting gains through a corrective ABC phase. The 4145–4147 discount zone serves as a high-probability wave C completion area, especially if PPI data softens USD momentum.
Wait for structure confirmation before entering, and monitor the PPI release as it may dictate whether gold extends higher or deepens its correction.

Gold , Butterfly ?As you can see on chart
1 - brocken trend
2 - Now retesting
3 - Butterfly pattern
4 - FVG selling Zone
If that so . and 4255 - 4270 hold , we may break last support and fall down
better to divide your entry from now untill 4250 then hold and wait
Good luck


Latest Direction After Gold Price Surge
News:
On Thursday (November 13) in Asian trading, spot gold remained relatively stable after yesterday's surge, currently trading around $4,200 per ounce.
On Wednesday evening local time, US President Trump signed a temporary funding bill, ending the longest government shutdown in US history. The bill will provide continued funding for the federal government, ensuring most government agencies have operating funds until January 30, 2026.
The end of the US government shutdown means that official economic data will resume being released, paving the way for a Federal Reserve interest rate cut in December.
Technical aspects:
On the daily chart, after stabilizing last week, gold has continued its rebound this week, showing short-term strength. Support levels to watch are around $4210, near Wednesday's high, and then the intraday low of $4185. Resistance levels to watch are the intraday high around $4240; a break above this level would indicate further strength, with the upside target at the psychological level of $4300, which also coincides with the upper Bollinger Band on the daily chart.
The 5-day moving average is trending upwards in a golden cross, the MACD indicator has formed a golden cross, and the KDJ and RSI indicators are also trending upwards in a golden cross, suggesting short-term technical indicators indicate a potential for further gold price rebound.
Trading strategy:
Buy:4190-4185, SL: 4175, TP: 4250-4275

gold intraday longmomentum is high, reversal traders r ready to short it , but i think this will move up atleast 4225 before any further move which can extend to 4230 .

XAUUSD | FVG Rejection Signaling Bullish ReversalPrice has recently delivered a strong sell-side sweep into the marked FVG (Fair Value Gap) inside the discount zone of the current swing range. After tapping into this imbalance, buyers stepped in, showing a sharp reaction and a potential shift back toward bullish order flow.
🔍 Key Observations
• CHoCH & BOS sequences across multiple sessions (Tokyo / London) indicate transitions in liquidity and directional intent.
• The latest BOS to the upside after rejecting the FVG suggests that price may be ready to retrace higher.
• The prior London session high is marked as a Weak High, making it a likely target for liquidity engineering.
• Current price action shows early signs of forming a higher-low structure, aligning with a bullish continuation model.
🎯 Bullish Scenario
If price maintains support above the FVG mitigation and continues forming higher highs/higher lows, the next upside objectives are:
• Inefficiency fill
• Sweep of the Weak High
• Target zone around 4,220 as illustrated
❗️Invalidation
A clean break back below the FVG with displacement would invalidate the bullish scenario and open the door for deeper downside.

Gold Trade Plan 13/11/2025Dear traders,
Gold continues its corrective upward movement, and I expect it to resume its bullish move from the 4200 area toward the initial target of 4275.
Regards,
Alireza!

14/11/2025 XAUUSD Continuation Dumping Next Week Let See14/11/2025
XAUUSD M30 Outlook
Correction A Done
next B & C
Go To the next Sell Setup
target Under $4100
