SILVER XAGUSD SILVER demand floor at 48-47$ will be challenged at 51.385$-52$ zone, should we break and close above this level we could be seeing more upswing into 54.303-55 zone and a retest supply roof .
key fundamental outlook
Electronics & Electrical: Silver’s unmatched electrical conductivity makes it vital in smartphones, data centers, automotive electronics, and other high-tech devices.
Solar Photovoltaics (PV): Rapid growth in solar panel production has sharply increased silver demand
Electric Vehicles (EVs): EVs use 25-50 grams of silver per vehicle in electrical contacts, battery management, and thermal system
5G Infrastructure: Silver is used extensively in 5G equipment, including connectors and amplifiers.
Medical uses (antimicrobial properties), water purification, advanced computing cooling systems, and IoT continue to expand silver's demand base.
Supply Deficit: The silver market has experienced a supply deficit for several consecutive years, tightening physical availability and supporting prices.
Safe-Haven Demand: Alongside gold, silver benefits from investor demand during geopolitical and economic uncertainties.
silver remains bullish despite pullback ,price will keep rising .
Futures market

GOLD Local Short! Sell!
GOLD is sliding away from the horizontal supply zone, with bearish displacement hinting at continuation toward the next liquidity pocket below. Any minor pullback may simply serve as distribution before the markdown resumes. Time Frame 1H.
Sell!
Comment and subscribe to help us grow!
Check out other forecasts below too!
Disclosure: I am part of Trade Nation's Influencer program and receive a monthly fee for using their TradingView charts in my analysis.

GOLD XAUUSD GOLD ,newyork session rejected the sell at 4038-4040 floor ,a previous broken supply roof now a demand floor and on technical could retest 4100 coming week.
13th November during newyork session rejected the 4243-4244 zone ,the technical analysis hinged on daily double top structure break of neckline and buyers return to retest a broken neckline at 4243-4044 and dropped to 4146-4150 zone during the newyork session ,on 4hrs using the line chart we have a strong psychological horizontal structure and another break and retest to close newyork session on another 200pips buy trigger.
break and close 4146-4150 was another bearish correction into 4036-4040.
break and close will challenge another key low at 3889-3885.5 strong psychological demand floor on 4hr TF.
GOOD LUCK AND SEE YOU AT THE TOP.

XAUUSD started bull move on ending shutdown!with US G.shutdown ending GOLD dropped to weekly support int his long term uptrending market structure, with multiple liquidity sweep on this support, XAUUSD gain new momentum for new higher high?
As currently weekly price action is just potential beginnign of a new impulse after back to 3 weeks of pullback giving GOLD a very high probability of continue to rise up to current weekly high.
Running GOLD buy up 400 pip looking at closing 820 pip or beyond!

Gold Near Channel Support – Bulls Preparing for Another Leg Up?Gold ( OANDA:XAUUSD ) is approaching the Support zone($4,193 – $4,137) and the lower line of the ascending channel .
In terms of Elliott Wave theory , it looks like Gold is completing the main wave 4 .
I expect Gold increase from the Support zone($4,193 – $4,137) to Potential Reversal Zone(PRZ) and Resistance zone($4,316 – $4,270) .
First Target: $4,253
Second Target: $4,297
Stop Loss(SL): $4,133
Please respect each other's ideas and express them politely if you agree or disagree.
Gold Analyze (XAUUSD), 1-hour time frame.
Be sure to follow the updated ideas.
Do not forget to put a Stop loss for your positions (For every position you want to open).
Please follow your strategy; this is just my idea, and I will gladly see your ideas in this post.
Please do not forget the ✅ ' like ' ✅ button 🙏😊 & Share it with your friends; thanks, and Trade safe.

GOLD BUY Gold looking to buy and recollect it’s move to the upside , so will be using a buy stop to catch a trade and correct the previous error where it missed (TAKE PROFIT) by a few inches

Short-term selling plan for gold!Entry: 4120
🎯 Final Target: 4088
❌ Stop-Loss: (Add your SL)
📊 Market Analysis
Gold is showing a clear shift in momentum as price faces rejection near the upper resistance zone. Sellers are stepping in around 4120, signaling potential downside pressure.
A break and hold below this level strengthens the bearish outlook, suggesting that the market may retrace toward the lower liquidity zone around 4088. The intraday structure is weakening, with bearish candles forming and buyers failing to push higher. This behavior supports the idea of a short-term corrective move.
Traders should monitor for retests of the 4120 zone, rejection wicks, or declining bullish volume to confirm continuation toward the target area.

GOLD FREE SIGNAL|SHORT|
✅XAUUSD momentum shifted sharply after tapping the supply block, driving price into a clean displacement swing. With liquidity resting below, continuation toward the lower imbalance remains likely. Time Frame 1H.
—————————
Entry: 4084$
Stop Loss: 4110$
Take Profit: 4050$
Time Frame: 2H
—————————
SHORT🔥
✅Like and subscribe to never miss a new idea!✅


GOLD I Weekly CLS I Model 2 - Target 50% I Eventually ATH...Hi friends, new range created. As always we are looking for the manipulation in to the key level around the range. Don't forget confirmation switch from manipulation phase to the distribution phase to make the setup valid. Stay patient and enter only after change in order flow. If price reaches 50% of the range take partial or full close.
📌 HTF - Higher Timeframe view
🧩 Complete proces and Strategy explained 👇 Click Below
🎯 Why your market approach also should be mechanical ?
NO Fixed Mechanical Trading Logic - You are guessing random patterns
NO Defined trading plan - Every trade different logic
NO Same logic in each trade - Not possible to backtest
NO Backtests on at least 300 trades - Not knowing Statistics
➡️ No Statistics ➡️ No Edge ➡️ Mindset ProblemS
🧠 Core of mindset problems
If you don't know your statistics on large enough data sample. You don't know your probabilities of win rate once the losing streak happen and it happens to every strategy. You will start doubting, hesitating to take next trade because you don't know statistics of your losses. In the end you will be doubting strategy and then jump to different one. You will be in the endless loop for years, looking for new better strategy. 👊 Your ultimate goal as a trader is not to be a generalist who knows 10 000 patterns. But rather create one system with narrowed criteria of each element of the trade to remove subjective and emotional decisions as much as possible and stick to this system no matter what. Practice it 10 000 times become a MASTER.
✨ Trading Mastery is reflection of your life
Have a longterm plan, No Alcohol & Drugs, Ignore others, Focus on your journey , Backtest regularly, Review your weeks, Journal mistakes, Exercise, Sleep well, Read books, Walks in nature (no phone) , Meditate, Reduce social media time, Spend time with family, Live Life.
Trading is hard, but not impossible. I believe in you 💪
David Perk aka Dave Fx Hunter

GOLD (XAUUSD) - Weekly CLS GOLD (XAUUSD)
On Weekly CLS & an additional 4H CLS nested inside the Weekly range.
On the 4H timeframe, the BPR zone might act as a strong confluence area and may serve as a resistance zone.
🎯 Target: 4189.570

THE KOG REPORT THE KOG REPORT:
Last week was an extremely decent week in Camelot with all Gold targets hitting and completing.
Quick KOG Report this week.
We’re expecting a potential range to form here between the with the key level of support being the 4040 level while 4080 will need an engulfing to attack this region. Above, the bias level is 4095 which we’re looking for the break on to then attempt the 4120-30 region initially. Although we have a reversal in play on most time frames, we would say play caution here as this could just be a swing low in formation before another opportunity for the market to get buyers in higher and flushing again.
RED BOXES:
Break above 4095 for 4104, 4110, 4120 and 4127 in extension of the move
Break below 4080 for 4065, 4055 and 4040 in extension of the move
Please do support us by hitting the like button, leaving a comment, and giving us a follow. We’ve been doing this for a long time now providing traders with in-depth free analysis on Gold, so your likes and comments are very much appreciated.
As always, trade safe.
KOG

Bearish on gold 1 Day between 2 FVG
4h consolidation. it hit a bullish fvg But it broke the trend to the downside. Soi belive we are faking out to the upside till a good pullback took place

Weekly outlook on NQ, ES and Dow. Index Triad NYSEThis week will be a tricky one. I need more data to understand about the expansion on the weekly. We will take it on a day to day basis after each daily closures

Monday's Gold Trading PlanMonday's Gold Trading Plan
As shown in Figure 2h:
Standard Resistance Level: $4130
Resistance Range: $4115-$4130
Standard Support Level: $4060
Bottom Support Level: $3990-$4000
Monday Strategy:
1. Closely monitor fluctuations in the US market, fully testing the validity of the $4115-$4130 resistance range. If this resistance level is confirmed:
Sell: $4115-$4130
Stop Loss: $4140
Target Price 1: $4090-$4070-$4060
Target Price 2: $4000
2. The two support areas for gold on Monday present buying opportunities.
Buy price level 1: $4060-$4080
Buy price level 2: $4000-$4010
Stop loss price level 1: $4050
Stop loss price level 2: $3985
Take profit price levels: $4100-$4150-$4200
huan'ying wishes you a happy weekend and successful trading on Monday!

Gold Weakens: Failed High, Support at RiskThe chart shows that gold is losing bullish momentum after failing to push toward a new Higher High (HH) and instead forming a Lower High (LH), signaling early weakness on the buyer side. The strong rejection at the LH triggered significant selling pressure, driving price back down toward a key support zone. This HH → LH structure suggests the market is shifting toward a potential downtrend, increasing the likelihood of a support break. From a fundamental perspective, the bearish bias is supported by expectations of higher-for-longer Fed interest rates, a strengthening U.S. dollar, and a risk-on environment that reduces demand for safe-haven assets like gold. Together, these technical and fundamental factors create a strong probability of deeper downside if the current support level is broken with a valid move.

How a Single Put Spread Predicted Gold’s BreakdownSo, gold has broken below the previous bearish zone — meaning we now have a bearish sentiment in play (at least according to my classification).
Now, regarding options flow:
On the chart, I’ve highlighted those lucky (or rather, well-informed) players who entered with a Put Spread — just before the correction started.
Perfect timing.
Their ideal target?
$3,950 — to be reached within 8 days, right around expiry.
Or at least close enough for maximum profit.
p.s. Just to be clear:
We are not teaching options trading as such — even though much of my methodology is built on options market data.
What we are doing is showing you how to read the option sentiment and use that insight to trade more effectively on the markets you already know — like spot Forex.
It’s about understanding why price moves — before it does.
We believe that trading without using options sentiment analysis is similar to fishing with a fishing rod🤦🏻♂️ on the shore while your neighbor has arrived at the river with a sonar on a boat.
We are on that boat, and we want to help you make better trading decision.💰


XAUUSD UPTREND AFTER LONG DOWN TREND This chart shows Gold respecting a long-term ascending trendline after a sharp drop. Price is currently hovering just above the green support zone, and the Ichimoku cloud suggests a possible recovery if buyers step back in. A break and bounce from the trendline could trigger a move toward the marked resistance levels. The chart highlights two upside zones where price may react if bullish momentum builds.
Targets Shown on the Chart
Target 1 4,170.681 -
Target 2 4,249.203
Do you think Gold will hold this trendline and climb toward the targets, or will sellers push it lower?

I can’t eat corn, but I can trade it!Yep I am slightly allergic to corn. So instead of eating it, I trade it…

XAUUSD | Rejection From Premium Zone — Targeting Sell-Side LiqGold has pulled into a premium retracement zone (0.5–0.618 Fib) aligning perfectly with the Daily Wick 50% + previous structure flip level (4,122 zone).
This zone acted as a strong supply block, causing an immediate reaction, confirming bearish order flow.
Price is currently forming distribution under the premium zone, signaling potential continuation downward.
🔍 Detailed Breakdown:
HTF Bias: Bearish below 4,122
Retracement: Into 0.5–0.618 Fib + Daily Wick 50%
Zone of Interest: 4,122 – 4,110 (strong rejection zone)
Current Structure: Lower highs forming → distribution
Liquidity Targets:
4,027 (first liquidity pocket)
4,005 (major sell-side liquidity)
4,000 – 3,995 (extended target if momentum accelerates)
📉 Bearish Confirmation:
A clean rejection from the premium zone + multiple liquidity sweeps at the top indicates smart money shifting direction.
📌 What I’m Watching:
If XAU retests the 4,110–4,122 zone and fails to break above structure →
Expecting a clean sell-off into sell-side liquidity levels.
📚 Concepts Used: Liquidity | Imbalance | SMC | Premium vs Discount | Fib Retracement | Market Structure Shift

What's the outlook for gold next week? Strategy Update
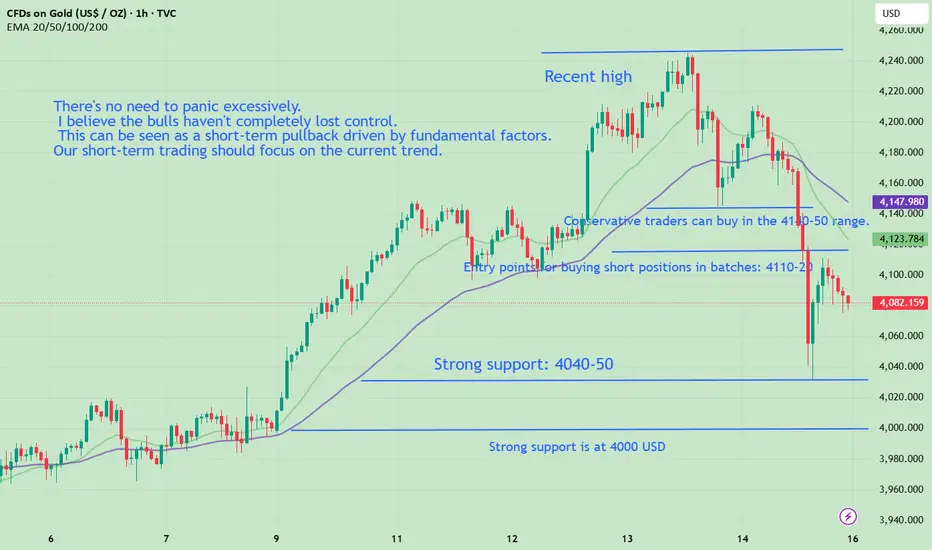
After Friday's sharp drop, gold may rebound at the beginning of the week, followed by a test of its strength. From a technical analysis perspective, the daily chart closed bearish, indicating significant downward pressure and strong short-term upward momentum. Monday's market is likely to remain bearish. Gold's rebound to around $4110-$4120 is a key resistance zone from the previous period and near the high of Thursday morning's rebound, making it highly likely to encounter resistance. Aggressive traders could consider a small short position, while more conservative traders should wait for a rebound to the $4140-$4150 range before entering short positions, as this is the upper edge of the previous consolidation range. Based on the current trend, key support is between $4050 and $40, with strong support at $4000. The previous low is at $3990. If this support level holds, the market may continue to consolidate. A break below this support level could weaken bullish sentiment.
Despite Friday's significant market volatility, our trading went very smoothly. I focus on short-term trading and clear market analysis. In short-term trading, there are no markets that rise or fall forever, only optimal entry points at specific moments. Finding the rhythm and following the trend is the essence of trading. On Friday, after the Asian market opened, we shorted at 4209 and then sold at 4190. Many friends questioned this, but I want to say, don't regret selling too early. We set profit targets and risk controls for every trade. Once the profit target was reached, we sold. After all, technical analysis becomes ineffective in the face of news. We should be grateful that we maintained four profitable short-term trades during this major market move, including both long and short positions, instead of missing the entire downtrend. You can check the historical recommendations to verify their accuracy. Although I am a professional trader, I don't need to strive to buy at the lowest and sell at the highest point on every trade. After all, I'm just a trader, not God! So we need to adjust our mindset and only earn the profits we deserve. Overall, this week's operations were quite profitable, and we will continue to work hard next week.
There's no need to panic excessively. I believe the bulls haven't completely lost control; this can be seen as a short-term pullback driven by fundamental factors. The possibility of a medium- to long-term peak in gold is unlikely; the overall bullish trend in the long term remains unchanged. The long-term bullish outlook persists because current external factors, such as geopolitical tensions, tariffs and trade tensions, the Fed's halt to tapering, and continued central bank gold purchases, do not support a medium-term peak in gold. Although the subsequent release of data following the US government shutdown may be mixed, potentially delaying the Fed's rate cuts, the overall trend of de-dollarization will not change. The current decline is merely a correction within the medium-term bullish trend.
This is just a general pre-market analysis; it will be updated based on actual market movements after the market opens. If you are unsure about precise trading strategies, try my method: first, use a small position to test the market, then add to your position during pullbacks. This way, you won't miss any opportunities. If you are truly unsure when, where, and how to trade, let's work together to flexibly and steadily pursue greater returns in the ever-changing market!
Gold Price Retest Setup – Key Supply Zones in FocusGold (XAUUSD) has broken below its ascending structure, forming a clear weak low and shifting into a bearish environment. Price is now attempting a recovery toward two major supply zones highlighted on the chart.
The first reaction zone sits near 4099–4121, where sellers may re-enter. If this level is breached, price could extend toward the upper supply zone around 4160+, where a deeper retracement is expected.
Market structure shows earlier BOS, CHoCH, and a clear EOH, confirming the bearish shift. Until a strong reversal forms, rallies into marked supply levels may act as sell opportunities
Gold has broken its bullish trendline and formed a weak low, confirming bearish control. Price is now pulling back toward the 4099–4121 supply zone, where the first rejection is likely. If buyers push higher, the next strong supply sits near 4160, expected to cap any deeper retracement. Until these zones break with strength, rallies remain sell-biased.
