NATGAS Set To Fall! SELL!
My dear followers,
I analysed this chart on NATGAS and concluded the following:
The market is trading on 4.577pivot level.
Bias - Bearish
Technical Indicators: Both Super Trend & Pivot HL indicate a highly probable Bearish continuation.
Target - 4.474
About Used Indicators:
A super-trend indicator is plotted on either above or below the closing price to signal a buy or sell. The indicator changes color, based on whether or not you should be buying. If the super-trend indicator moves below the closing price, the indicator turns green, and it signals an entry point or points to buy.
Disclosure: I am part of Trade Nation's Influencer program and receive a monthly fee for using their TradingView charts in my analysis.
———————————
WISH YOU ALL LUCK
Futures market

USOIL The Target Is UP! BUY!
My dear friends,
USOIL looks like it will make a good move, and here are the details:
The market is trading on 57.97 pivot level.
Bias - Bullish
Technical Indicators: Supper Trend generates a clear long signal while Pivot Point HL is currently determining the overall Bullish trend of the market.
Goal - 58.98
About Used Indicators:
Pivot points are a great way to identify areas of support and resistance, but they work best when combined with other kinds of technical analysis
Disclosure: I am part of Trade Nation's Influencer program and receive a monthly fee for using their TradingView charts in my analysis.
———————————
WISH YOU ALL LUCK

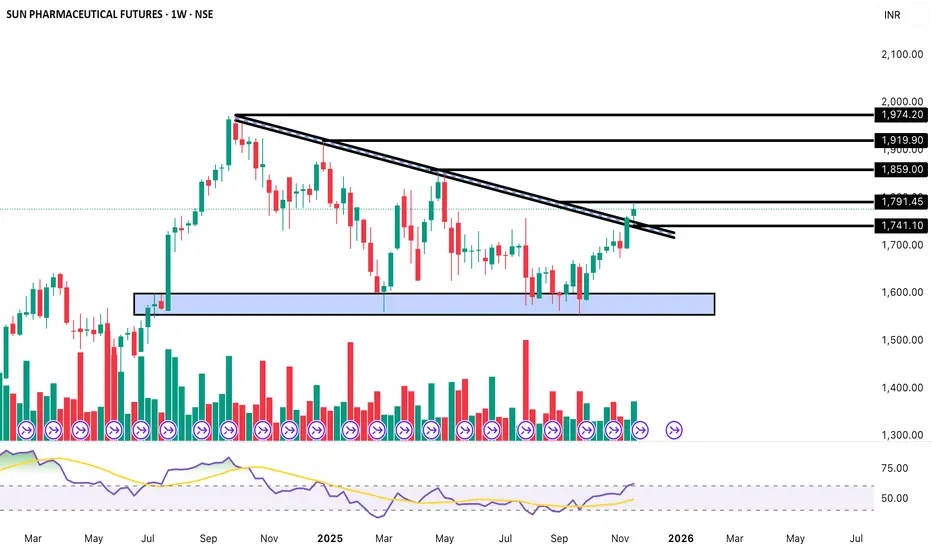
Major Trendline Breakout on Weekly | Multi-Month Rally Setup📌 Buy Zone (Weekly Breakout Confirmation):
₹1,780 – ₹1,795
🎯 Targets (Positional):
T1 – ₹1,859
T2 – ₹1,919
T3 – ₹1,974
🛡️ Stop-Loss (Weekly):
₹1,740 (below retest + trendline confluence)
⏳ Duration:
4–8 weeks (Positional swing)
Unique target systemWhen I was first learning technical analysis, I discovered something novel. I had never seen anything like it, but I was new to trading and figured it was a fluke. But now I’m all in.
Nothing is 💯. But check this out…
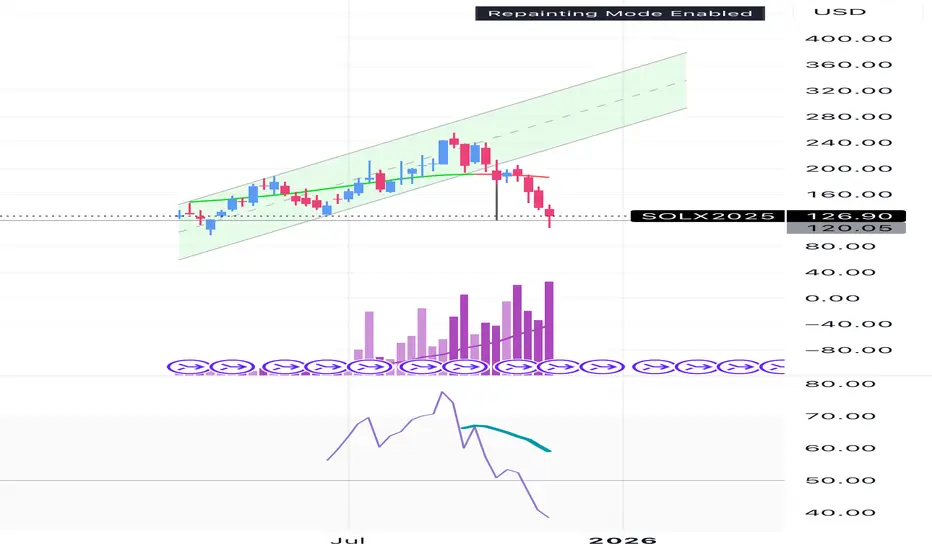
If an asset trades in a CONSISTENT UPTREND CHANNEL and then breaks down from that channel, do this:
1. Measure the vertical height of the channel
2. Use that vector height and move it to the exact spot where the asset broke down from the channel
3. The bottom of that marker is the target
This worked nearly perfectly on BABA and also on several other charts. I haven’t needed to use it lately bc everything has been on an upward trajectory. Now that there may be some downside moves, I’m definitely checking this strategy on each chart.
Caveats:
If the uptrend isn’t consistent, it doesn’t work.
If the downside target is totally unrealistic, it prob won’t work.
Crypto— BTC especially—moved down 1/2 of the channel height on prior moves.
I always use volume to help guide my moves. If the downside target is hit and no volume comes in, I’m just gonna watch & wait.


XAUUSD – ACCUMULATION TRIANGLE ON D1💛 XAUUSD – ACCUMULATION TRIANGLE ON D1, AWAITING A NEW BREAKOUT THIS WEEK 🎯
🌤 Overview of the New Week
Hello everyone, Lana here 💬
Gold, after a very strong rise from the 3,500 region to above 4,400, is entering a "resting" phase on the D1 frame: the price continuously tests the upward trendline but has not yet broken it to confirm a downtrend.
The market is clearly waiting for a real breakout before forming a new medium-term wave.
Next week, we have CPI and PPI – important inflation data that could act as a catalyst to push gold out of the current accumulation zone.
💹 Technical Analysis (Daily Triangle)
On the D1 frame, when connecting the descending peaks and ascending bottoms, gold is in a narrowing triangle pattern.
The upward trendline below is still maintained, indicating that the medium-term trend has not reversed.
Below are important zones:
≈ 3,890: if the price closes below this area, it could confirm medium-term weakening.
Fibonacci & psychological resistance zone 3,800–3,900: strong support, confluence with old price structure.
POC Volume Profile around 3,650: if a deep decline scenario occurs, this will be the next price attraction zone.
Above, the old peak zone around 4,300–4,400 remains a large liquidity zone, a natural target if gold breaks the upper edge of the triangle.
In summary: the more compressed the triangle, the stronger the breakout – the direction will depend heavily on CPI/PPI data & Fed expectations.
🎯 Reference Trading Plan (Medium-Term)
💖 Scenario 1 – Maintain Uptrend (priority when the trendline is not broken)
Observe the reaction at the D1 upward trendline (area around 4,000).
If the price continuously bounces from the trendline and stays above the 3,890 area, you can:
Prioritize buying according to the trend at support retests on H4–H1.
Medium-term targets: 4,150 → 4,250 → 4,300–4,400 if the triangle breaks upwards.
💢 Scenario 2 – Triangle Breaks, Shifts to Medium-Term Decline
If D1 closes below 3,890:
Consider this a signal confirming medium-term weakening.
Prioritize selling at newly formed resistance zones.
Step-by-step targets: 3,800 → 3,700 (POC) → 3,500 (strong previous support).
In both scenarios, specific entry points should be refined on smaller frames (H4, H1) based on price action/OB/FVG.
⚠️ Note News & Risk Management
Next week's CPI & PPI could be the "final blow," pushing gold out of the triangle – volatility can be wide and fast, spreads may widen.
Last week's NFP news hardly created big waves for gold after the US government shutdown, indicating the market is holding strength waiting for more important data.
🌷 Conclusion & Interaction with LanaM2
Gold on D1 is in the final stage of the accumulation triangle – this is a time where patient observation is as important as a beautiful entry point 💛
Next week, I will continue to update daily details on smaller frames so everyone can have more specific entry points.

XAUUSD BULLISH VIEW🔥 Current Market Structure
Previous trend was bearish, but now market shows early signs of accumulation + bullish shift.
Multiple BOS (Break of Structure) to the upside confirm that sellers are losing strength.
Last sweep of liquidity happened at the swing low near 4018 zone, followed by a sharp bullish reaction → strong signal of demand presence.
📌 Key Zones Marked on Chart
🟢 Demand Zone (High Probability)
4018 – 3994
Price reacted from this zone with high volume → institutional buys.
🔴 Supply Zone (Next Upside Target)
4114 – 4108
Price is likely to mitigate this imbalance before making further decision.
🟡 Mid-Range Support
4064 / 4058
Price is currently retesting this Breaker Block (BB) → if held, bullish continuation expected.
🎯 Expected Move (Your projection is correct)
📌 Scenario in play:
Hold above 4058 – 4064
Bullish displacement to 4114 – 4108 supply
If supply gets consumed → next major target:
4157
4212 – 4209 (HTF liquidity pool)
🚨 When the Bullish Bias Fails
Bullish idea invalid only if:
❌ Price closes below 4058
Next drop targets:
4018
3994 demand for next buy setup
📍 Trading Plan (Smart Money Approach)
Action Zone Confirmation
Look for Buy 4058 – 4064 (BB retest) M5/M15 BOS + FVG entry
TP1 4108 – 4114 Partial booking
TP2 4157 Fibonacci + liquidity target
TP3 4212 Extreme liquidity sweep
⛔Do not sell blindly until supply zone proves rejection with BOS to downside.
🔊 Summary
✔ Market is shifting to bullish
✔ Demand is respected with strong volume reaction
✔ Current retracement = re-accumulation before next leg up
📌 If price holds above 4058 → gold will push toward 4108 → 4157 → 4212.
(( THIS IS WHAT I AM SEEING IN GOLD AS IT HAS MADE MSS IN 1HR AND RETESTING ITS BB , SO LET'S SEE WHAT HAPPENS.
IF IT GOES UP SO WE CAN SEE A TARGET TO 4150 AND AGAINF FURTHER,,
ALSO 4151-4160 CAN ACT AS A RESISTANACE AND WE CAN GET A RETRACEMENT
ALSO 4151-4160 IF THIS LEVEL BREAKS THEN CAN SEE FOR 4265-4275 LEVEL.
ALSO I CAN BE WRONG ))

Gold is facing short-term downward pressure.
I. Core Fundamental Drivers
1. Macro Sentiment & Policy Expectations
Fed Policy Signals:
The probability of a December rate cut has plummeted from 90% to 27%. Hawkish officials emphasize the lack of "clean data" to support further easing, curbing market optimism.
Next week's PCE inflation data becomes the key anchor: A softer reading could reignite bets on rate cuts, weighing on the USD and risk-free rates, thereby boosting gold. A stronger-than-expected reading would reinforce the hawkish stance.
Contradictory Economic Data:
Economic activity shows resilience, but weak consumer confidence persists. If this continues, it could drag down Q4 GDP and amplify safe-haven demand.
Fiscal & Liquidity Risks:
The government funding bill only extends until January 30th, failing to resolve the shutdown risk fundamentally. Coupled with scarce liquidity during the Thanksgiving holiday, market volatility is prone to amplification.
2. Geopolitics & Capital Flows
Ukraine-Russia Peace Talks: Any substantive progress would boost risk appetite, diminishing gold's safe-haven appeal.
Gold Attribute Shift: The recent pullback in gold prices from $4100 to around $4000, without showing traditional safe-haven resilience, reflects potential exhaustion from the previous rally and capital rotation towards risk assets.
II. Key Technical Signals
1. Bull-Bear Battle Range
Monthly/Weekly Charts: Both show doji candlesticks, indicating indecision. The longer-term uptrend remains intact, but short-term corrective pressure is building.
Core Trading Range:
Upper Resistance: 4100-4130 (Break above targets 4150-4200)
Lower Support: 4020-4000 (Break below targets 3950-3886)
4-Hour Triangle Convergence: Nearing the apex. A breakout could trigger a $200-level unilateral move.
2. Short-Term Momentum Structure
Moving Average System: The 1-hour chart shows a golden cross, but the price is capped by resistance at $4100. A breakout with volume is needed to confirm short-term upward momentum.
Key Pivot Levels:
Bullish Defense: 4020 (range low), 4000 (psychological level)
Bearish Defense: 4100 (multiple failed tests), 4130 (previous high, dense resistance)
III. Comprehensive Trading Strategy
1. Range-Trading Tactics (Before Breakout)
Long Opportunities (Buy Dips):
Entry Zone: 4020-4030
Stop Loss: Below 4010
Target: 4080-4100 (partial profit-taking), break above targets 4130
Short Opportunities (Sell Rallies):
Entry Zone: 4110-4120
Stop Loss: Above 4130
Target: 4060-4040, break below targets 4030
2. Breakout Follow-Through Strategies
Break Above 4130:
Enter long on a pullback near $4100, target 4150-4170.
Break Below 4000:
Enter short lightly on a rebound near $4020, target 3950-3930, with 3886 as the extreme target.
3. Risk Control Essentials
Position Management:
Range-bound: Single position ≤ 5% of capital. Breakout: ≤ 8%.
IV. Key Event Watchlist
Thursday US PCE Inflation Data (Crucial for December rate cut expectations)
Speeches from Fed Officials (Monitor the balance between hawks and doves)
Ukraine-Russia Negotiation Developments (A sudden peace deal could trigger a gold sell-off)
Black Friday Retail Sales Data (Reflects US economic resilience)
Summary
Gold is currently at an inflection point where policy expectations and technical patterns converge. In the short term, treat 4020-4130 as the core range, adhering to selling rallies and buying dips before a clear breakout. Once PCE data or geopolitical events trigger a directional move, follow through decisively. From a medium-to-long-term perspective, the bull market structure remains valid if the previous low of 3886 holds. However, in the short term, be wary of violent whipsaws caused by liquidity traps.

Gold's bullish and bearish trends were perfectly timed this weekGold Technical Analysis: Gold prices have been fluctuating between 4000 and 4110 in recent days, lacking a clear direction. This volatile market requires both caution and opportunity searching. Neither long nor short positions are inherently wrong; the key is precise entry points. Based on this week's closing price, gold reached a high of 4101 before retracing and closing at 4065. Next week, continue to monitor the range-bound movement. The monthly chart for gold may close with a doji, and next week will likely see continued range-bound trading. The weekly chart also shows a doji, indicating no clear direction. While the overall trend remains bullish, the pullback is not yet complete. Looking at the weekly chart alone, next week we temporarily recommend buying low and selling high within the 4110-4020 range until it is broken. A break above this range could lead to 4130-4150 or even 4200, while a break below could target 4000-3980. Strong support is at 3930, with an extreme low around 3886. The daily chart closed with a doji on Friday, so continue with a range-bound trading strategy on Monday.
Looking at the 4-hour chart, it is currently consolidating near the end of a triangle pattern. Once it breaks out effectively, there is an estimated profit potential of nearly $250. Before the breakout, operate within the trading range. Go long near the lower edge of the range around 4020 and go short near the upper edge around 4110. Go short a little earlier, around 4100. On the hourly chart, the moving averages are crossing upwards, indicating a bullish alignment. Currently, 4020 is a key short-term support level. If it holds, it will likely remain within the range. A break below this level could see strong support at the 4000 mark. The 4110 level also presents significant resistance; several attempts to break through have failed. However, this level is expected to gradually narrow over time. The longer the consolidation period, the stronger the subsequent breakout. The fundamentals of the bull market remain unchanged, and there is still room for further upward movement. In summary, the recommended trading strategy for gold is to primarily buy on dips and secondarily sell on rallies. The key resistance level to watch in the short term is around 4100-4110, while the key support level is around 4020-4000. Traders must follow the market closely, manage their positions carefully, and strictly adhere to stop-loss orders. Avoid holding losing positions. For specific trading instructions, please refer to the bottom notifications.

XAUUSD Update GOLD ConsolidationOn last week, we could see Gold makes a sideways are between 4130 - 4023 area.
Movement in this area creates a triangle pattern, indicated by a breakout at the top.
Next week, we have 4130 resistance level.
If 4130 is broken , the price has the potential to move towards the next resistance level, 4160 - 4175 level ( Fibonacci 62% area ).
Have a blessing week ahead !

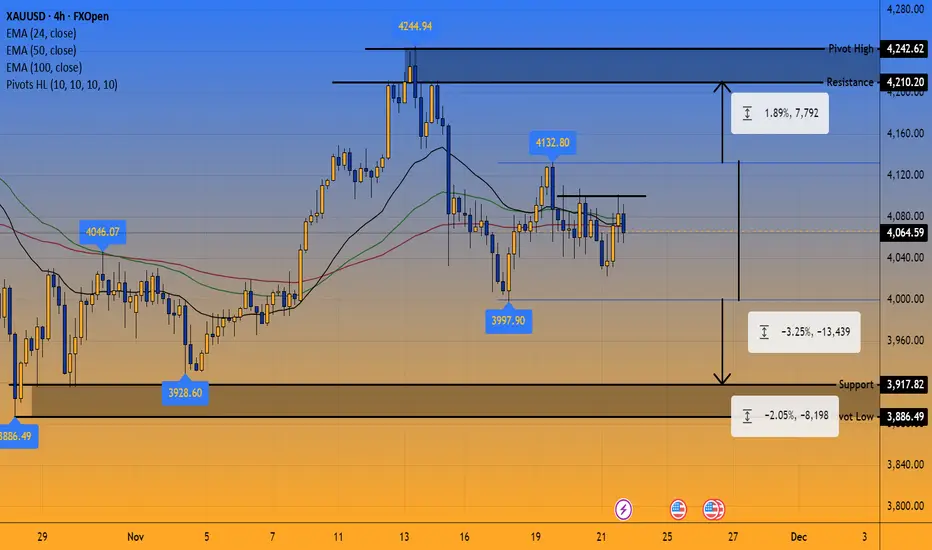
Gold Thoughts, Ideas and Forecast (1 Week)Daily:
The Trading Range is very clear, upper band 4210.20 lower band 3917.82, within that range there is a smaller trading range(D3997.90,U4132.80), which could provide good trading opportunities in the current state of congestion. The Volume(20MA) has been low and steady in the past week, not giving much clues at this point. NEUTRAL
4H:
Very Well defined side trend, there are opportunities to trade both inside and outside the current trading range(rejections/breakouts). EMA(24,50,100) are all flat confirming the current congestion. NEUTRAL
1H:
On a closer look things are a little bit more messy, couple of notes that took my attention are level 4100 which has rejected three times already, and also the small bullish momentum on Friday. NEUTRAL
The Plan:
My bias is NEUTRAL for either side, so I will be looking for clues near the key levels combined with volume analysis.
LONGS
3997.90 Rejection, Support of the small range, target 4064.59(range mid level)
4131.95 Breakout, Resistance of the small range, Target 4210.20
3917.82 Rejection, Support of the outer range, Target 3997.90
SHORTS
4131.95 Rejection, Resistance of the small range, Target 4064.59(range mid level)
4210.20 Rejection, Resistance of outer range, Target 4131.95
3997.90 Breakout. Support of the small range, target 3917.82
Best of Luck.
Thank you for reading.

Report 22/11/25Report Summary
Christine Lagarde’s Frankfurt speech formalizes what the data have been hinting at: Europe’s export-led growth model has decoupled from global demand and is now a vulnerability. She urged governments to remove internal barriers in the single market and to lean into domestic demand as the new shock absorber. The ECB has paused after an eight-cut cycle, but the thrust of her remarks puts the onus on fiscal integration and micro reforms, not more rate relief. This lands alongside three market-moving developments: Brussels pressing ahead with a plan to mobilize frozen Russian assets to finance Ukraine, Washington’s partial rollback of the 40% tariff on selected Brazilian food imports, and Tokyo’s large fiscal push as JGB yields hit multi-decade highs. Together they imply stickier cross-currents: Europe wrestling with low trend growth and a tougher industrial mix, the U.S. mixing selective de-tariffing with broader protectionism, and Japan attempting stimulus while its term premium normalizes. Expect risk to trade on policy credibility and relative growth rather than a one-way “soft landing” narrative. The equity tape’s chop around AI bellwethers and a stronger dollar late in the week are consistent with that rotation.
Europe: growth model reset, policy friction, and banks
Lagarde described years of inaction and underscored that countries with large manufacturing bases have endured a “prolonged slump in industrial production,” urging policymakers to strengthen domestic demand and finally dismantle internal-market barriers, an ECB analysis equates those frictions to triple-digit tariff equivalents on services and mid-double-digits on goods. That is a blunt acknowledgment that Europe’s external-surplus model is out of date. For markets, it argues for a lower equilibrium EUR growth premium, a flatter inflation impulse than the U.S., and a wider distribution of outcomes driven by fiscal execution rather than monetary easing. Near-term, this mix supports high-quality, cash-rich defensives over cyclicals in European indices and keeps peripheral spreads sensitive to any backsliding on reform. Banks are the swing factor: an ECB supervisory push to relax national “traps” on capital/liquidity movements and to look more favorably on waivers would improve cross-border ROE and M&A math, but needs EU-level follow-through to be durable.
Brussels, meanwhile, intends to proceed with its “reparations loan” architecture using income from immobilized Russian assets to back a ~€140 bn package for Kyiv. The alternative floated in a new U.S. peace proposal, channeling assets into U.S.-led investment vehicles, raises transatlantic coordination risk. Markets will read any legal or political challenges (especially from euro-area custodians) as headline risk for euro-denominated collateral and for EU cohesion; domestically it complicates budget arithmetic. Watch for periodic volatility in European financials around legal milestones.
U.S.: tariffs, growth mix, and the “don’t over-price cuts” message
The White House carved out exemptions from the 40% tariff on some Brazilian agricultural goods (coffee, beef, fruits/spices), citing initial progress in talks. Practically, this trims an upside tail for certain U.S. food CPI components in early 2026 and marginally eases inventory and hedging stress for grocers and CPGs. It does not negate the broader protectionist stance, so supply-chain rerouting and tariff-arbitrage behaviors continue. Equities responded with another choppy session as AI-linked megacaps whipsawed and the cash dollar found support. The broader investment takeaway aligns with the buy-side’s recent warnings: market-implied Fed cuts are still vulnerable to upside growth/AI-capex surprises; don’t over-rely on policy easing to carry multiples.
Japan: big fiscal, bigger yields, and an FX dilemma
Prime Minister Sanae Takaichi unveiled a roughly ¥21.3 trn (~$135 bn) stimulus centered on energy subsidies and household support, set against talk of a supplemental budget materially larger than investors first expected. JGB yields have surged to levels last seen in the GFC era as markets price a thicker fiscal risk premium and a BoJ that is stepping back from heavy-handed duration absorption; 10-years have probed ~1.78–1.80%, and 30-years hit fresh cycle highs. Foreign participation has jumped as rule changes and relative value versus global curves improved the appeal of long-dated paper. Net-net, Japan’s rates are now sufficiently “real” to anchor some domestic bid for the yen, yet the fiscal impulse and sticky U.S. growth keep USDJPY biased higher unless the MoF leans in. This “tug-of-war” puts a volatility floor under the pair for now.
Commodities and strategic raw materials: policy puts
Two policy arcs matter for raw materials. First, the EU’s intent to coordinate purchases and stockpile critical minerals (with funding and even price-floor concepts) to reduce vulnerability to U.S.–China frictions signals a multi-year European demand backstop for lithium, copper and rare earths. If delivered, it supports higher floor prices and may re-rate selected EU-listed miners/refiners as “policy beneficiaries.” Second, western coordination against subsidized Asian steel overcapacity is gathering momentum through the OECD forum, implying firmer anti-dumping actions and a bid for regional steel spreads. Together with China’s active reserve-build in oil, Beijing is adding new storage capacity through 2026, these dynamics argue for firmer term structures in industrials and a damped downside in crude on inventory diplomacy.
U.S. tech & regulation: antitrust and audit plumbing
In the background, the court’s rejection of the FTC’s monopoly case against Meta reduces breakup risk for one of Big Tech’s key ad platforms and softens the perceived regulatory overhang for the complex, at least near-term. For multiples, that’s modestly supportive on dips, though the medium-term capex/depreciation cycle still drives earnings quality.
Asset-by-asset implications
XAUUSD (gold): Europe’s structural growth reset plus EU legal frictions over Russian assets keep a bid under geopolitical/rule-of-law hedges even as U.S. real yields remain elevated. The Japanese stimulus-plus-yield surge adds a second-order tail (policy error hedging). Expect dip-buyers near prior breakout areas if DXY consolidates; rallies fade if U.S. growth upside reins in 2026 cut pricing.
S&P 500 / Dow Jones: Index internals matter more than headline levels. AI capex continues to cushion top-line growth and cash flows for cloud-exposed names, but elevated depreciation and inventory-of-compute will pressure operating leverage into 2026. The tariff tweak on Brazilian food is small beer for margins but incrementally helpful for staples. Expect continued factor rotation: quality balance sheets and cash generative megacaps over cyclicals tied to EU industrial demand; domestics over exporters while the dollar stays firm.
USDJPY: The fiscal package’s duration supply and higher JGB term premium pull the yen two ways: structurally supportive over multi-quarters, tactically bearish as U.S.–Japan rate differentials remain wide. Intervention risk rises if one-way momentum resumes; look for MoF verbal cues around round numbers and volatility spikes. Base case: broader 152–160 ranges until either BoJ hikes again or U.S. disinflation accelerates.
DXY (Dollar Index): With Europe signaling a growth-model rethink and Japan absorbing higher yields without a decisive BoJ tightening, the dollar retains carry and growth advantages into year-end. The risk to that stance is a clearer softening in U.S. labor data or an AI-capex slowdown. Near-term, event risk around data delays and policy headlines will continue to whipsaw positioning.
Crude oil: China’s active reserve-build and capacity additions to its stockpiles set a floor under demand dips, while U.S.–Saudi commercial ties continue to channel capital into AI/datacenter and potentially defense-energy linkages. Absent fresh supply shocks, policy-driven inventory accumulation argues against a sustained break lower in Brent through winter shoulder months.
Strategic forecasts, fiscal/political implications, risks & opportunities
Over the next one to three quarters, Europe’s growth premium probably compresses further unless there is credible movement on single-market liberalization; watch for concrete proposals to cut services-market barriers and to green-light cross-border banking waivers—these would be the first “proof points” the equity market will pay for. U.S. policy will remain selectively protectionist, so supply chains keep optimizing for tariff maps; today’s Brazil carve-outs are tactical and inflation-messaging friendly, not a regime change. Japan’s pivot is real: larger fiscal outlays financed down the curve and a BoJ that is less of a marginal buyer re-anchor the JGB market and raise the bar for USDJPY upside persistence, an FX vol-selling regime is less attractive.
Principal macro risks: legal blowback and tit-for-tat around Russian asset income (euro-market plumbing risk); a “growth scare” in Europe that forces fiscal loosening without reform; U.S. AI-capex disappointment that compresses equity risk premia; and a disorderly yen rally if MoF intervenes into a thin tape. Principal opportunities: European bank re-rating if capital-mobility waivers gain real traction; U.S. staples and grocers benefiting from lower imported food-cost pressure at the margin; long-duration JGBs in tactical windows as foreign demand stabilizes auctions; and selected miners/refiners tied to EU critical-mineral stockpiling plans.
Cross-asset satellites tied to this tape
European banks are a convex opportunity if, and only if, there is real progress on waiving national capital/liquidity traps and enabling cross-border balance-sheet mobility. I would accumulate a starter position in the Euro Stoxx Banks basket on dips with a tight catalyst leash: if we do not get concrete supervisory steps or Brussels-level support in the next policy window, step aside. A credible waiver regime raises steady-state ROE and re-opens M&A optionality; no progress leaves them as duration-and-cycle plays with headline risk from the Ukraine-assets scheme.
EU miners and refiners linked to critical raw materials benefit from Brussels’ plan to coordinate purchases and stockpile. Express this with a barbelled approach: hold a core in diversified EU-listed producers and rent higher-beta lithium names around EU announcements and off-take news, hedging the China-demand tail with short Asian steel or chemical proxies when the OECD “excess capacity” process heats up. If the EU couples purchasing with price-floor mechanisms, the skew turns more structural.
Japanese duration is a tactical rather than strategic long. Foreign demand has returned at the long end, but issuance will rise with the supplemental budget and the BoJ is stepping back from heavy purchases. The cleaner trade is a curve expression: look to re-enter 10s30s steepeners on pullbacks, and pair them with a small long-yen options overlay to capture the “policy surprise” tail.
Immediate catalysts and what to watch
The next two to six weeks revolve around four decision nodes. First, the ECB’s December meeting and any staff work released on internal-market frictions; evidence of a concrete plan to lower services barriers would be the first durable bullish impulse for European cyclicals, while more rhetoric with no road map sustains the defensive bias. Second, EU Council discussions on using income from immobilized Russian assets to back Ukraine’s financing package; legal or political cracks, especially from euro-area custodians, would pressure EU financials on headlines even if the architecture survives. Third, Tokyo’s final supplemental-budget size and JGB issuance plan; anything that pushes duration supply materially higher without a BoJ counter-signal should keep USDJPY volatile and JGBs heavy, while a measured package with credible funding calms both. Fourth, U.S. macro prints and AI-capex updates from the cloud majors; upside growth surprises argue for trimming rate-cut pricing and favor the dollar and quality stocks, while misses finally give breath to duration and to gold.
Risk controls
If the U.S. labor market weakens decisively and the Fed’s reaction function turns more dovish than the buy-side now expects, the dollar leg higher will stall; in that case, cut the core DXY long, flip crude from range-trade to accumulation, and let gold run with trailing stops. If the EU produces a real, time-bound plan to dismantle internal barriers and if supervisors fast-track capital-waiver pilots, rotate from defensives to EU cyclicals and add banks tactically. If MoF intervenes repeatedly and the BoJ tightens ahead of schedule, stand down on USDJPY longs and look for a sequence of lower highs to sell rallies instead. If AI-capex guidance falters, expect a factor-wide de-rating; lean on the S&P hedges, reduce cloud beta and keep staples and healthcare as ballast.

Xauusd Possible Scenarios (Next 24–48 Hours)1. Market Structure
Gold recently made a strong bullish rally (left side of chart), followed by a sharp correction and is now consolidating in a sideways range.
Current structure shows:
Lower highs forming
Higher lows weakening
Price compressing → triangle / squeeze zone
This indicates indecision and a potential big breakout coming soon.
📈 Bullish Scenario
Gold climbs back above 4106, holds, and breaks the trendline.
Target 1: 4150
Target 2: 4200
Target 3: 4250
Bullish trigger: Break and close above 4120 on 4H.
📉 Bearish Scenario
If price breaks 4000 – 4030 support:
Target 1: 3985
Target 2: 3920
Target 3: 3870
Bearish trigger: Strong 4H candle close below 4025.
For More Updates Stay Tuned

Gold lower?Likely to go lower if we break to the downside of this consolidation.
Potential to break 3,887 level coming week

Natural Gas - Wave iii Top Forming, Wave iv Pullback expected?Natural Gas appears to be completing Wave iii near major resistance, with a brief Wave iv pullback expected before a final Wave v push to the upside.

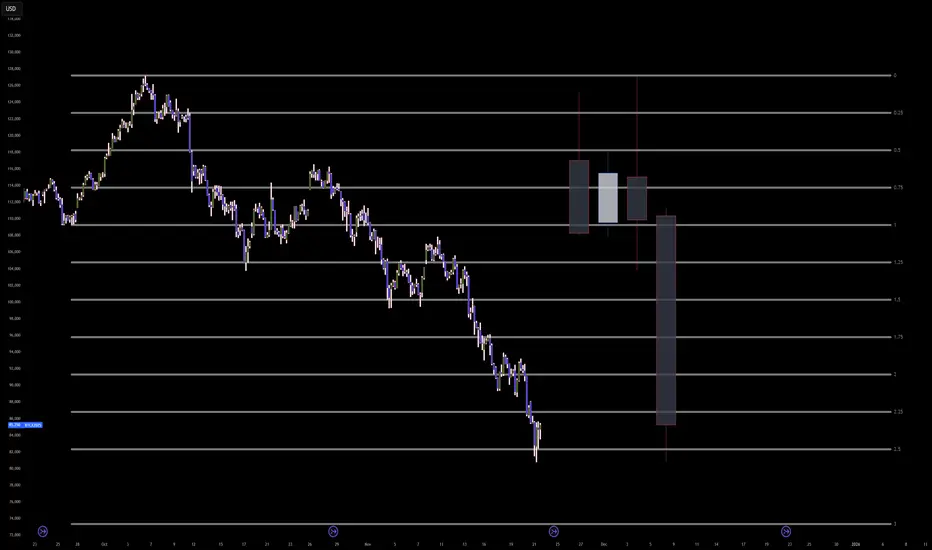
BTC CME Futures: The Capitulation Buy SetupSimply:
The logic here is simple.
Bitcoin has dropped too far and too fast.
We are currently hitting a major mathematical exhaustion point (the 2.5 Standard Deviation line).
At the same time, we are entering that big blue support box between 78k and 82k where the massive rally started earlier this year.
This is not a crash anymore; it is a bear trap.
Retail traders are panic selling right at the bottom, which provides the liquidity for big players to buy.
We are setting a limit order to catch the final wick down before the bounce.
Entry: 81,250 (Buy Limit)
Stop Loss: 77,500 (If it goes below here, the setup is wrong)
Target: 94,000 (The bounce back to equilibrium)
Don't chase the red candles.
Let the price come to you, fill the order, and wait for the squeeze.
____
Advanced:
The algorithm is currently executing a terminal volatility expansion into the 2.5 Standard Deviation extremity to finalize the Macro Sell Model and engineer a generational Smart Money Reversal.
The present liquidation cascade is not a crash but a precise, mathematically ordained delivery of price into the deep discount 'Blue Box' accumulation array to harvest the final sell-side liquidity before the grand repricing event.
Entry: 81,250.00 (Limit Order - 4,000 points below market)
Stop loss: 77,500.00 (3,750 points)
Take profit: 94,000.00 (12,750 points)
Risk to reward ratio: 3.40R
The Opportunity
The Bitcoin algorithm has been running a high-velocity sell program from the 126,000.00 highs, systematically dismantling every bullish PD Array.
However, we have now breached the Event Horizon. The price is magnetically drawn to the confluence of the 2.5 Standard Deviation projection and the historical Accumulation Block (78k-82k) originating from the early 2025 impulse.
This zone represents the 'Algorithmic Floor'—a region of maximum discount where institutional order flow must pivot from distribution to accumulation to close massive short positions and defend the macro bull trend.
The Entry
Do not chase the current candle. The algorithm demands a touch of the 2.5 Standard Deviation level at approximately 80,800.00 - 81,200.00 to complete the fractal expansion.
We place our limit order at 81,250.00 to front-run the absolute mathematical bottom, capitalizing on the 'Capitulation Wick' that will clear the final trailing stops.
This entry is timed for the CME close/open gap or the weekend volatility injection, which often targets these extreme deviation levels to trap late bears before a violent Monday reversal.
The Invalidation
The reversal thesis is ontologically corrupted if price displaces below the 3.0 Standard Deviation level and the bottom of the accumulation block at 74,000.00.
A sustained closure below this level signifies a total failure of the macro structure and a transition into a secular bear market, invalidating the accumulation narrative.
This would shift the probability manifold to the Primary Antithetical Chain, targeting the 60,000.00 liquidity void.
Key Trajectory Waypoints
Target 1: 86,000.00 | Type: Immediate Rebalance (2.25 SD) | Probability: 90% | ETA: 24 Hours
Target 2: 90,500.00 | Type: Internal Bearish Breaker | Probability: 75% | ETA: 3-5 Days
Target 3: 94,000.00 | Type: Equilibrium / FVG Fill | Probability: 60% | ETA: 1-2 Weeks
The Shadow Reality
A 25% probability exists for the antithetical reality: The Abyss Cascade.
In this scenario, the 2.5 SD level fails to provide a reaction, and the algorithm enters a 'Free Fall' discovery mode targeting the 3.0 SD at 74,000.00 immediately.
This reality is confirmed if price slices through 80,000.00 with no wick response.
___
tags: BITSTAMP:BTCUSD COINBASE:BTCUSD INDEX:BTCUSD BINANCE:BTCUSD
USOIL Is Very Bearish! Sell!
Please, check our technical outlook for USOIL.
Time Frame: 15m
Current Trend: Bearish
Sentiment: Overbought (based on 7-period RSI)
Forecast: Bearish
The market is approaching a significant resistance area 57.983.
Due to the fact that we see a positive bearish reaction from the underlined area, I strongly believe that sellers will manage to push the price all the way down to 57.471 level.
P.S
We determine oversold/overbought condition with RSI indicator.
When it drops below 30 - the market is considered to be oversold.
When it bounces above 70 - the market is considered to be overbought.
Like and subscribe and comment my ideas if you enjoy them!

Supply & Demand vs Support & Resistance — Beyond the Lines“Two traders can look at the same level.
One sees a line.
The other sees the reason behind it.”
Most beginners start with Support & Resistance.
Advanced traders shift into Supply & Demand.
Both seem similar… and in some cases, they are the same.
But the difference lies in why price reacts — not just where.
Let’s break this down clearly.
1. Support & Resistance: The Surface Layer
Support and resistance are simple horizontal reaction levels.
Support
A price level where the market tends to bounce upward.
Resistance
A price level where the market tends to reject downward.
These levels represent crowd behavior.
Retail traders love them — which is why they often turn into liquidity pools.
Strength: easy to spot, widely used
Weakness: easily manipulated because stops cluster there
2. Supply & Demand: The Deeper Institutional Layer
Supply & Demand zones are created by imbalances — strong, one-sided moves driven by institutional orders.
To make the concept crystal clear:
Demand Zone
The last bearish candle (or group of candles) before a strong impulsive move upward, caused by institutional buying and imbalance.
Supply Zone
The last bullish candle (or group of candles) before a strong impulsive move downward, caused by institutional selling and imbalance.
These zones show where institutional buying or selling actually started.
Strength: precise entries, strong reaction zones
Weakness: requires deeper understanding and confirmation
3. How They Connect
This is where most traders get confused.
Support/Resistance = the reaction.
Supply/Demand = the reason for the reaction.
Many times:
A support level is formed because a demand zone sits right below it.
A resistance level is formed because a supply zone sits above it.
So yes — in many cases:
Demand = Support
Supply = Resistance
But only when the reaction was created by institutional imbalance.
4. When They Are NOT the Same
This is the part traders often miss.
❌ Support is NOT demand when:
• Price bounced many times (retail clustering)
• No strong bullish impulse originated there
• Candle structure shows hesitation, not institutional entry
This is just retail support, not a demand zone.
❌ Resistance is NOT supply when:
• Price tapped repeatedly (equal highs)
• No sharp drop came from that level
• The zone lacks displacement or imbalance
This is simply retail resistance, not a supply zone.
5. How to Use Both for Maximum Clarity
Here’s the practical way to combine them:
Use Support/Resistance to understand where retail will react.
Use Supply/Demand to understand where institutions will react.
Best workflow:
• Mark higher timeframe Supply/Demand
• Mark intraday Support/Resistance
• Wait for price to move between these layers
• Look for confirmation (ChoCH/BOS) at the real institutional zone
• Avoid taking trades directly at retail S/R without deeper context
This gives you direction, patience, and precision.
Example (XAUUSD)
Refer to M15 chart above:
Price respected an intraday support level,
but the real reversal happened only after tapping the demand zone below it,
where imbalance and institutional orders existed.
Support showed the bounce.
Demand explained the bounce.
One shows the line.
The other shows the truth behind the line.
📘 Shared by @ChartIsMirror
Do you trade with support and resistance, supply and demand, or a mix of both?
Share what you see — your approach reveals how you read the market’s story.

GOLD HIT TP XAUUSDGold acted well and held on to the structure, will keep trading simple and easy and wait for another opportunity

TECHNICAL ANALYSIS OF GOLD FOR SHORT OPPORTUNITY
📈 Gold Technical Analysis (1h Chart)
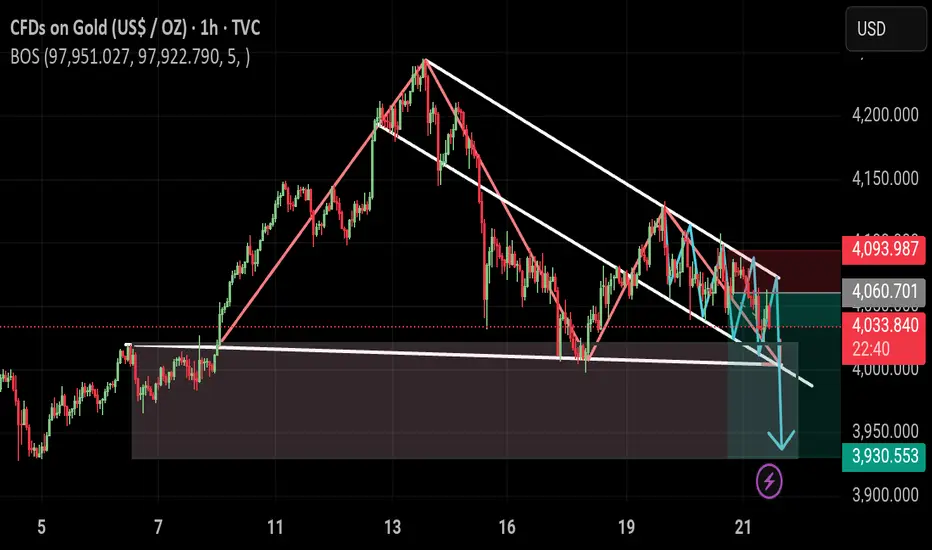
The chart shows a distinct price pattern and a potential trading setup following a significant rally.
Key Observations
Prior Movement: The price made a sharp upward move, peaking around $4,200 (on November 13th), followed by a clear downtrend.
Correction/Pattern: Since the peak, the price action has formed a Descending Channel (or potential Bear Flag) indicated by the two parallel white trendlines. This suggests a corrective phase after the initial rally.
Support Zone: There is a significant Horizontal Support Zone highlighted by the shaded brown rectangle, roughly between $3,950 and $4,000, which corresponds to a previous area of consolidation/resistance (around November 7th-9th) that was broken to the upside. The price has recently tested the upper boundary of this zone.
Recent Action: The price is currently near the lower boundary of the descending channel and appears to be testing both the channel support and the upper boundary of the horizontal support zone.
Trading Setup
The chart features an active Short (Sell) setup, indicating a bearish bias:
Entry Price: $4,060.701 (The price is currently $4,035.592, suggesting the entry was taken earlier or the current price is the market price).
Stop Loss (Red Area): Set at $4,093.987. This is placed just above the recent swing high within the descending channel, protecting against a bullish breakout.
Take Profit (Green/Teal Area): Set at $3,930.553. This target aims for a move that breaks below the horizontal support zone and potentially reaches the prior consolidation lows.
Risk/Reward Ratio: The size of the red box (risk) versus the size of the teal box (reward) suggests a favorable risk/reward ratio for this trade.
Conclusion
The overall pattern suggests that Gold is undergoing a healthy correction within a descending channel. The active trade is betting on a breakout below the channel and the key horizontal support zone ($3,950 - $4,000) to confirm a deeper correction. If the price fails to break lower and instead breaks above the descending channel, the short position would be stopped out, potentially signaling a continuation of the prior uptrend.
Would you like a summary of the next most likely price movements based on this pattern?