OPEN-SOURCE SCRIPT
Custom RSI with RMA Smoothing
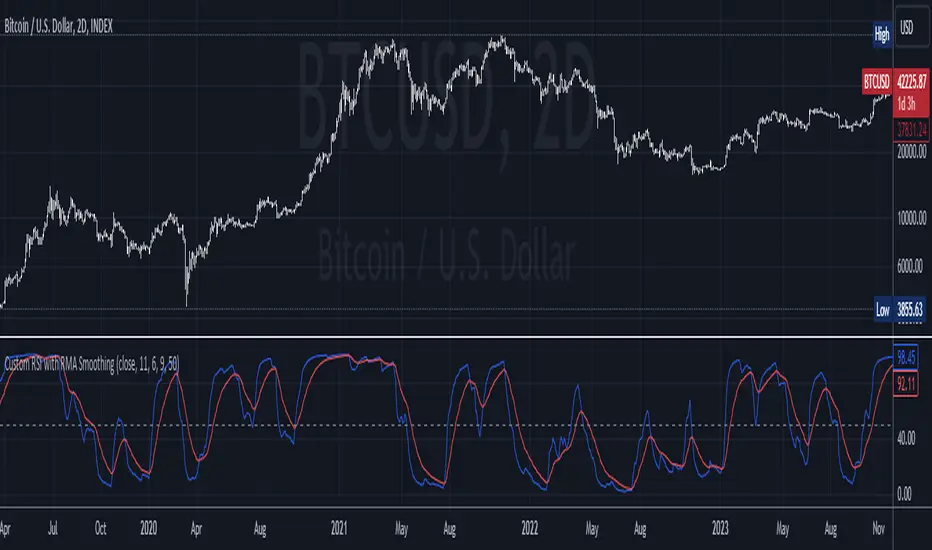
Custom RSI with RMA Smoothing is smoothing the classic Relative Strength Index to enhance the effectiveness of using the RSI for trend-following through noise reduction.
Principle:
1. RSI is smoothed by the Rolling Moving Average (RMA) and averaged Gains & Losses instead of the classic RSI calculation.
2. A RMA is plotted over the RSI where the crossovers can be entry and exit points.
How is RSI smoothed by the RMA:
1. Outside the common price sources a few new options like hhhlc or hlcc can be chosen where the emphasis is more on the high or the close of the chosen period.
2. Calculation of Price Change: After selecting the price source, the indicator calculates the price change by subtracting the previous period's price from the current price.
3. RMA Smoothing of Price Change: The key step in smoothing the RSI is the application of the Running Moving Average (RMA) to the price change. The length of this RMA is set by the user and determines the extent of smoothing. RMA is a type of moving average that gives more weight to recent data points, making it more responsive to new information while still smoothing out short-term fluctuations.
4. Determining Gains and Losses: The smoothed price change is then used to calculate the gains and losses for each period. Gains are considered when the smoothed price change is positive, and losses when it is negative.
5. Averaging Gains and Losses: These gains and losses are further smoothed by calculating their respective RMAs over the user-defined RSI length. This step is crucial as it dampens the impact of short-term price spikes and drops, giving a more stable and reliable measure of price momentum.
6. RSI Calculation: The standard RSI formula (100 - [100 / (1 + (average gain / average loss))]) is then applied to these smoothed values. This results in the initial RSI value, which is already more stable than a typical RSI due to the previous smoothing steps.
7. Final RMA Smoothing of RSI: In a final layer of refinement, the RSI itself is smoothed using another RMA, over a length specified by the user. This additional smoothing further reduces the impact of short-term volatility and sharp price movements, providing a more coherent and interpretable RSI line.
Open-source script
In true TradingView spirit, the creator of this script has made it open-source, so that traders can review and verify its functionality. Kudos to the author! While you can use it for free, remember that republishing the code is subject to our House Rules.
Disclaimer
The information and publications are not meant to be, and do not constitute, financial, investment, trading, or other types of advice or recommendations supplied or endorsed by TradingView. Read more in the Terms of Use.