PROTECTED SOURCE SCRIPT
Ekoparaloji Trend Candles
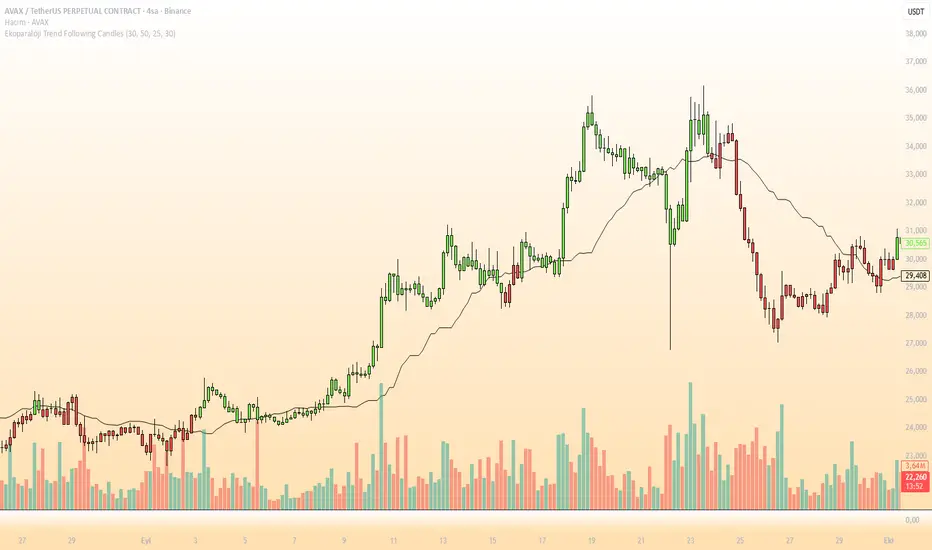
Ekoparaloji Trend Following Candles
🎯 What Does It Do?
This indicator is a candle coloring system that helps you easily identify trend direction. Complex calculations run in the background, and you simply follow the candle colors to understand trend strength.
🎨 How to Use
Read the Candle Colors:
🟢 GREEN CANDLES → Strong uptrend
Look for buying opportunities
Hold your long positions
🔴 RED CANDLES → Strong downtrend
Look for selling opportunities
Consider short positions
Color changes → Potential trend reversal signal
Review your positions
📈 Important: The White Line
The line on the chart is a dynamic support/resistance level:
Price above the line → Bullish zone
Price below the line → Bearish zone
⚙️ Customize Settings
You can adjust 4 parameters in the indicator settings:
Faster signals → Decrease periods (e.g., 20)
Smoother signals → Increase periods (e.g., 50)
Tip: Start with default settings, then optimize for your trading style.
💡 Strategy Tips
✅ Green to red transition → Take profit or exit signal
✅ Red to green transition → Look for entry opportunities
✅ Confirm with other indicators (RSI, MACD, volume, etc.)
✅ Always use stop-loss orders
⚠️ Warning!
No indicator is 100% accurate
Don't trade based solely on this indicator
Risk management should always be your priority
For educational purposes only, not financial advice
Happy trading! 📊
Protected script
This script is published as closed-source. However, you can use it freely and without any limitations – learn more here.
e-mail: ekoparaloji@gmail.com
X : Ekoparaloji
Yotube: youtube.com/@Ekoparaloji
Instagram : Ekoparaloji
X : Ekoparaloji
Yotube: youtube.com/@Ekoparaloji
Instagram : Ekoparaloji
Disclaimer
The information and publications are not meant to be, and do not constitute, financial, investment, trading, or other types of advice or recommendations supplied or endorsed by TradingView. Read more in the Terms of Use.