OPEN-SOURCE SCRIPT
Rate of Change of OBV with RSI Color
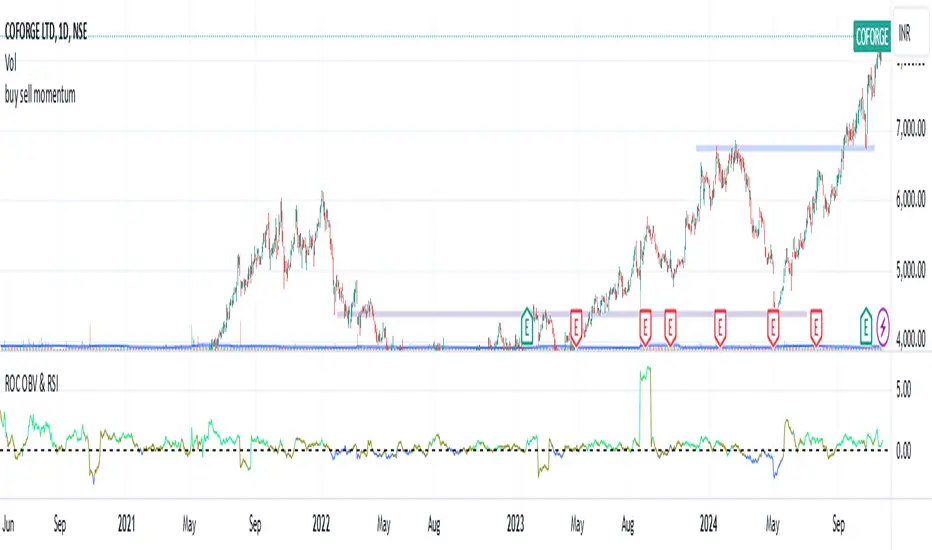
This indicator combines three popular tools in technical analysis: On-Balance Volume (OBV), Rate of Change (ROC), and Relative Strength Index (RSI). It aims to monitor momentum and potential trend reversals based on volume and price changes.
Calculation:
ROC(OBV) = ((OBV(today) - OBV(today - period)) / OBV(today - period)) * 100
This calculates the percentage change in OBV over a specific period. A positive ROC indicates an upward trend in volume, while a negative ROC suggests a downward trend.
What it Monitors:
OBV: Tracks the volume flow associated with price movements. Rising OBV suggests buying pressure, while falling OBV suggests selling pressure.
ROC of OBV:
Measures the rate of change in the OBV, indicating if the volume flow is accelerating or decelerating.
RSI: Measures the strength of recent price movements, indicating potential overbought or oversold conditions.
How it can be Used:
Identifying Trend Continuation: Rising ROC OBV with a rising RSI might suggest a continuation of an uptrend, especially if the color is lime (RSI above 60).
Identifying Trend Reversal: Falling ROC OBV with a declining RSI might suggest a potential trend reversal, especially if the color approaches blue (RSI below 40).
Confirmation with Threshold: The horizontal line (threshold) can be used as a support or resistance level. Bouncing ROC OBV off the threshold with a color change could suggest a pause in the trend but not necessarily a reversal.
When this Indicator is Useful:
This indicator can be useful for assets with strong volume activity, where tracking volume changes provides additional insights.
It might be helpful during periods of consolidation or trend continuation to identify potential breakouts or confirmations.
Open-source script
In true TradingView spirit, the creator of this script has made it open-source, so that traders can review and verify its functionality. Kudos to the author! While you can use it for free, remember that republishing the code is subject to our House Rules.
Disclaimer
The information and publications are not meant to be, and do not constitute, financial, investment, trading, or other types of advice or recommendations supplied or endorsed by TradingView. Read more in the Terms of Use.