OPEN-SOURCE SCRIPT
Label_Trades Enter your trade information to display on chart
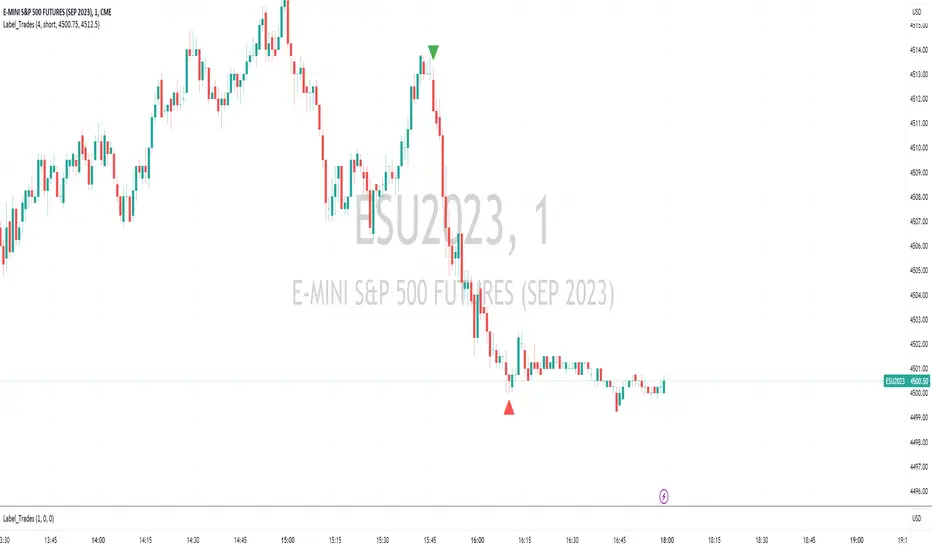
This indicator is an overlay for your main chart. It will display your trade entry and trade close positions on your chart.
After you place the indicator on you shart you will need to enter the trade information that you want to display.
You can open thte input setting by clicking on the gear sprocket that appears when you hover your mouse over the indicator name. There are 7 seting you will want to fill in.
Date and Time Bought
Date and Time Sold
Trade Lot Size
Select whether the trades was 'long' or 'short'
The price for buying the Trade
The price for selling the Trade
On the third tab
The code is straightforward. Using a conditional based on whtehr the trade was 'long' or 'short' determines where the labels will be placed and whether they show a long trade or short trade. It also displays a tool tip when you hover over the label. The tooltip will display the number of lots bought or sold and the price.
The lable.new() function is the meat of the indicator. I will go over a line to explainthe options available.
Pinscript manual(tradingview.com/...v5/Introduction.html)
The function parameters can be called out as in the example above or the values can be placed comma seperated. If you do the latter you must enter the parameters in order. I like anming the parameters as I place them so I can easily see what I did.
label.new(
x=t_bot, // x is the time the transaction occured
y=na, // y is the for the y-axis it is not used here so 'na' tells pinescript to ignore the parameter
xloc=xloc.bar_time, // x_loc is specifying that x is a time value
yloc=yloc.belowbar, // y-loc specifies to place the label under the bar. There are other locations to use. See language reference ((tradingview.com/...script-reference/v5/)
style=label.style_triangleup, // This parameter selects the lable style. There are many other style to use, see the manual.
color=color.green, // the Label fill color
size=size.small, // the label size
tooltip=str.tostring(lot_size) + " lots bought at $" + str.tostring(bot_val)) // Some parameters are tricky. This one needs to be a string but we are using an integer value(lot_size) and a float value(bol_val). They are all concatenated via the "+" sign. In oorder to do this the numeric values need to be cast or converted into strings. The string function str.tostring() does this.
Open-source script
In true TradingView spirit, the creator of this script has made it open-source, so that traders can review and verify its functionality. Kudos to the author! While you can use it for free, remember that republishing the code is subject to our House Rules.
Disclaimer
The information and publications are not meant to be, and do not constitute, financial, investment, trading, or other types of advice or recommendations supplied or endorsed by TradingView. Read more in the Terms of Use.