PROTECTED SOURCE SCRIPT
Updated FiFto -Stock movement % calc
Indicator Overview:
The script creates an overlay on your chart to display two key features:
Burst Power Calculation: A measure of significant price moves (5%, 10%, 19%) with counts of occurrences for each move type.
SL/Target Info: Displays stop-loss (SL) quantities and target percentages based on your risk parameters.
These features are displayed in a customizable table and offer real-time data for analysis.
Inputs:
Burst Power Inputs:
Lookback Period: Specifies the timeframe to calculate price moves for. You can choose from options like "3 Months", "6 Months", "1 Year", etc.
Display Mode: You can choose to display the table in "Full" mode (showing all relevant data) or "Mini" mode (showing only basic information).
Show Latest Date: Toggles whether the table includes a column showing the date of the latest move.
Dark Mode: Switches the colors of the table between light and dark modes for better visibility.
Closing Threshold: Defines how close the closing price must be to the high of the bar to consider it valid for analysis.
Table Settings:
Table Size: Allows you to select the table size from options like "small", "normal", "large", etc.
Table Position: Lets you choose where the table is positioned on the screen (top, middle, or bottom of the chart).
Table Font Size: Adjusts the font size of the text in the table (small, normal, or large).
Disable Table Colors: If true, the table will not use colors for cells, giving a more neutral appearance.
SL/Target Settings:
Show SL/Target Info: Whether to include Stop-Loss and Target information in the table.
Risk Amount: The monetary value you're willing to risk on a trade. This is used to calculate the stop-loss quantity.
SL Percentage: The percentage below the entry point at which the stop-loss will be triggered.
Target Percentage: The percentage above the entry point at which the target will be set.
Style Settings:
These settings define the appearance of the table, including colors and fonts. The table will adjust based on your color preferences (dark mode or light mode), with options for customizing background colors, text colors, and border styles.
Burst Power Calculation:
This part of the script calculates the Burst Power value based on price movements and updates the table with:
Counts of Price Moves:
5% or more
10% or more
19% or more
Burst Power Value: A weighted value calculated by summing the counts of each price move, with different weights for each move type:
5% moves contribute 1/5
10% moves contribute 1/2
19% moves contribute 1/0.5
Max Price Move: Tracks the maximum price move (and its timestamp) for the current period.
Logic:
For each bar, it checks if the price moved by 5%, 10%, or 19% or more, and updates the respective count and date of the last occurrence of each price move.
It calculates a "Burst Power" value based on the occurrences of these price moves and assigns a color to indicate how strong the burst power is.
Stop-Loss (SL) and Target Calculation:
This part calculates the quantity of the asset you can purchase based on your risk amount and stop-loss percentage:
One-Hour High: Tracks the highest price over the past hour (using 60-minute candles).
Target Price: Sets a target price based on the daily close and the target percentage input.
SL Quantity: The amount of the asset you can risk given the stop-loss points and your risk amount.
Target Percent Remaining: Shows how much of your target is left to reach, based on the one-hour high price.
Table Display Logic:
This is the most important part of the indicator because it determines how the data is displayed on the chart in a table. Here's a breakdown:
Column and Row Setup:
Based on the display mode (Full or Mini), it adjusts the number of rows and columns in the table.
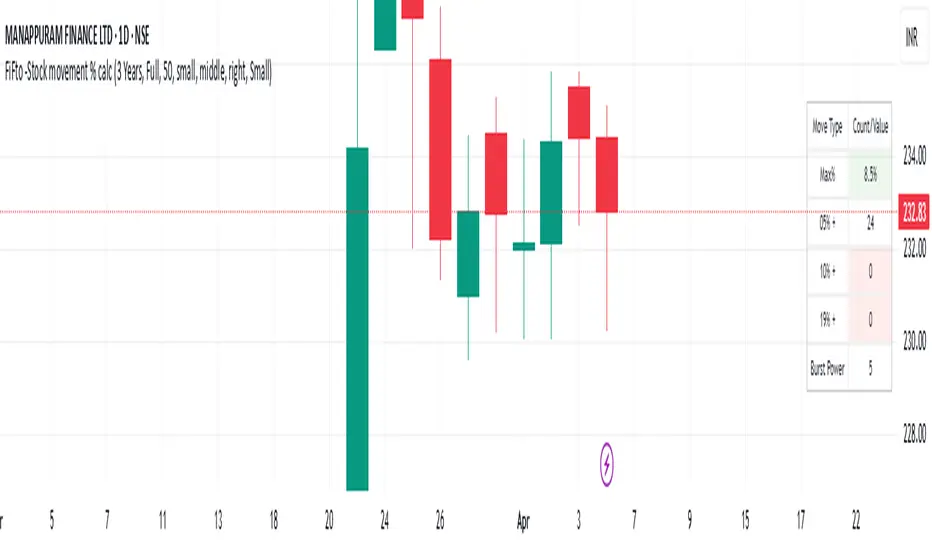
The columns display the types of data (e.g., "Max%", "05% +", "Burst Power", etc.), while the rows show the values of those parameters.
If "Show Latest Date" is enabled, an additional column will show the date of the last occurrence for each price move.
Burst Power and SL/Target Info:
The table displays the following information:
Max % Move: The largest price move observed.
Burst Power: A score indicating the strength of the price move (calculated from 5%, 10%, and 19% price moves).
SL Quantity: The quantity you can trade based on your risk and stop-loss.
Target % Left: The remaining percentage to reach the target price.
The table updates whenever the barstate is the last and the selected timeframe is active.
Table Position:
The table position is adjustable based on the inputs (top, middle, bottom), allowing you to control where the table appears on the screen.
Changes Made for Timeframe Flexibility:
The table and all its calculations previously only displayed when the chart was in a daily timeframe (timeframe.isdaily). This behavior has been removed.
No Timeframe Dependency: The table now displays regardless of which timeframe you are viewing. If you switch to another timeframe (e.g., 15-minute, 1-hour), the table will still appear without needing to be modified. The table will display in all timeframes you choose.
How to Use:
Install the Script: Add this script to your chart in TradingView as a custom indicator.
Customize Settings: Use the inputs in the settings panel to adjust your preferred values for lookback period, risk amount, SL percentage, target percentage, and other table display options.
Analyze the Data: Watch the table update with real-time data as you analyze price movements. The table will show the frequency and magnitude of price bursts, along with risk and target data to help you make better trading decisions.
The script creates an overlay on your chart to display two key features:
Burst Power Calculation: A measure of significant price moves (5%, 10%, 19%) with counts of occurrences for each move type.
SL/Target Info: Displays stop-loss (SL) quantities and target percentages based on your risk parameters.
These features are displayed in a customizable table and offer real-time data for analysis.
Inputs:
Burst Power Inputs:
Lookback Period: Specifies the timeframe to calculate price moves for. You can choose from options like "3 Months", "6 Months", "1 Year", etc.
Display Mode: You can choose to display the table in "Full" mode (showing all relevant data) or "Mini" mode (showing only basic information).
Show Latest Date: Toggles whether the table includes a column showing the date of the latest move.
Dark Mode: Switches the colors of the table between light and dark modes for better visibility.
Closing Threshold: Defines how close the closing price must be to the high of the bar to consider it valid for analysis.
Table Settings:
Table Size: Allows you to select the table size from options like "small", "normal", "large", etc.
Table Position: Lets you choose where the table is positioned on the screen (top, middle, or bottom of the chart).
Table Font Size: Adjusts the font size of the text in the table (small, normal, or large).
Disable Table Colors: If true, the table will not use colors for cells, giving a more neutral appearance.
SL/Target Settings:
Show SL/Target Info: Whether to include Stop-Loss and Target information in the table.
Risk Amount: The monetary value you're willing to risk on a trade. This is used to calculate the stop-loss quantity.
SL Percentage: The percentage below the entry point at which the stop-loss will be triggered.
Target Percentage: The percentage above the entry point at which the target will be set.
Style Settings:
These settings define the appearance of the table, including colors and fonts. The table will adjust based on your color preferences (dark mode or light mode), with options for customizing background colors, text colors, and border styles.
Burst Power Calculation:
This part of the script calculates the Burst Power value based on price movements and updates the table with:
Counts of Price Moves:
5% or more
10% or more
19% or more
Burst Power Value: A weighted value calculated by summing the counts of each price move, with different weights for each move type:
5% moves contribute 1/5
10% moves contribute 1/2
19% moves contribute 1/0.5
Max Price Move: Tracks the maximum price move (and its timestamp) for the current period.
Logic:
For each bar, it checks if the price moved by 5%, 10%, or 19% or more, and updates the respective count and date of the last occurrence of each price move.
It calculates a "Burst Power" value based on the occurrences of these price moves and assigns a color to indicate how strong the burst power is.
Stop-Loss (SL) and Target Calculation:
This part calculates the quantity of the asset you can purchase based on your risk amount and stop-loss percentage:
One-Hour High: Tracks the highest price over the past hour (using 60-minute candles).
Target Price: Sets a target price based on the daily close and the target percentage input.
SL Quantity: The amount of the asset you can risk given the stop-loss points and your risk amount.
Target Percent Remaining: Shows how much of your target is left to reach, based on the one-hour high price.
Table Display Logic:
This is the most important part of the indicator because it determines how the data is displayed on the chart in a table. Here's a breakdown:
Column and Row Setup:
Based on the display mode (Full or Mini), it adjusts the number of rows and columns in the table.
The columns display the types of data (e.g., "Max%", "05% +", "Burst Power", etc.), while the rows show the values of those parameters.
If "Show Latest Date" is enabled, an additional column will show the date of the last occurrence for each price move.
Burst Power and SL/Target Info:
The table displays the following information:
Max % Move: The largest price move observed.
Burst Power: A score indicating the strength of the price move (calculated from 5%, 10%, and 19% price moves).
SL Quantity: The quantity you can trade based on your risk and stop-loss.
Target % Left: The remaining percentage to reach the target price.
The table updates whenever the barstate is the last and the selected timeframe is active.
Table Position:
The table position is adjustable based on the inputs (top, middle, bottom), allowing you to control where the table appears on the screen.
Changes Made for Timeframe Flexibility:
The table and all its calculations previously only displayed when the chart was in a daily timeframe (timeframe.isdaily). This behavior has been removed.
No Timeframe Dependency: The table now displays regardless of which timeframe you are viewing. If you switch to another timeframe (e.g., 15-minute, 1-hour), the table will still appear without needing to be modified. The table will display in all timeframes you choose.
How to Use:
Install the Script: Add this script to your chart in TradingView as a custom indicator.
Customize Settings: Use the inputs in the settings panel to adjust your preferred values for lookback period, risk amount, SL percentage, target percentage, and other table display options.
Analyze the Data: Watch the table update with real-time data as you analyze price movements. The table will show the frequency and magnitude of price bursts, along with risk and target data to help you make better trading decisions.
Release Notes
Bug Update -FixedProtected script
This script is published as closed-source. However, you can use it freely and without any limitations – learn more here.
Disclaimer
The information and publications are not meant to be, and do not constitute, financial, investment, trading, or other types of advice or recommendations supplied or endorsed by TradingView. Read more in the Terms of Use.
Protected script
This script is published as closed-source. However, you can use it freely and without any limitations – learn more here.
Disclaimer
The information and publications are not meant to be, and do not constitute, financial, investment, trading, or other types of advice or recommendations supplied or endorsed by TradingView. Read more in the Terms of Use.