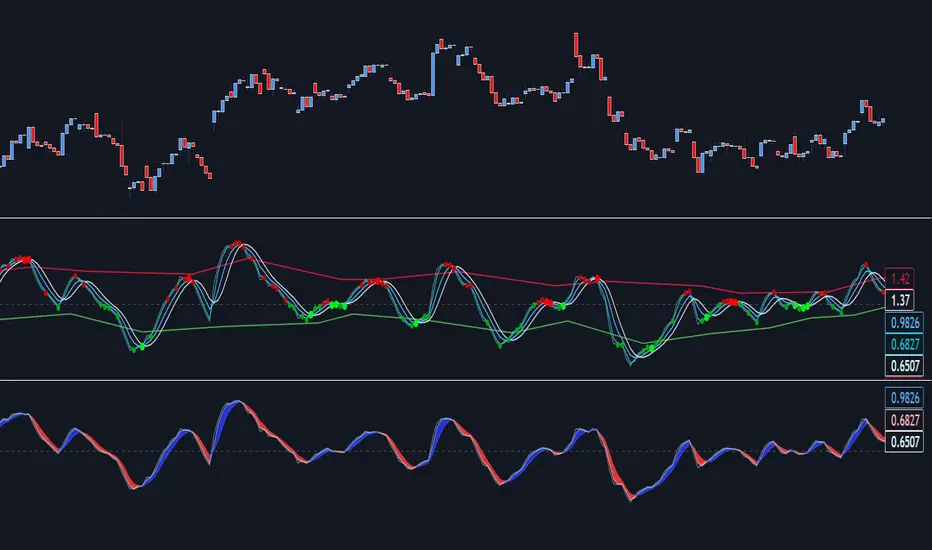
TradingWhale - Trend Momentum Algo (premium)

- Minimizing the ‘noise’ of normal price fluctuations of the underlying securities and exposing their natural oscillations and patterns while still providing quick response time at the edge of trend reversals.
-Providing accurate signals for trend-reversals before they happen so traders can maximize profit and reduce risk. To be fully transparent, this can’t always be achieved for every ticker and every time frame.
-Optimizing entry and exit for both long and short positions and thus improving the risk/reward ratio of the trade. We strongly believe in buying into weakness and selling into strength at the point of trend reversal, so we designed indicators with that goal in mind. We urge our users not to underestimate the impact this strategy can have on trading results. It is even more important when trading options and other highly leveraged instruments.
Btw, we would never ask our users to use our indicators with esoteric chart types such as Heikin Ashi, Renko, Kagi, Point & Figure, and Range, which produce unrealistic results. We prefer candles with no wick. Also see our disclaimer at the bottom.
-----
Trend Momentum Algo
This indicator accurately identifies the current trend’s changes in momentum for the underlying security. The proprietary algorithm is based on a momentum oscillator in combination with multiple EMA signal lines. In the standard setting users will only see a blue or red indicator area and the curvature of the indicator. In the detailed view, all lines are exposed.
Benefits
- Correctly identifies changes in trend strength
- Provides early warning signs of an expiring trend
- Works for all timeframes
- Settings for simplified and detailed view
- By itself it can be used as a profit-taking indicator
Signals
- Reversal of the indicator
- Change of color indicates accelerating trend strength or weakness
- Approaching the center line, just before crossing (crossing from above is a signal to go short, crossing from below is a signal to go long)
- Works best in combination with our other indicators
- In the detailed view (all plotting options de-selected), when the outer momentum trendline crosses over the orange line and before crossing the green line is often times a good place to go long or short.
Considerations
When the indicator is further away from the center line after big price moves, indicator reversal and/or color change should not by itself be used as an entry signal for a long or short position. In these cases the indicator is prone to being too early and price can still move in the same direction for quite a while before reversing.
-----
A friendly word of advice / Disclaimer
Successful trading requires more than professional indicators. It requires things like knowledge, discipline and constant learning, having a plan and executing accordingly. It requires risk management (ie. setting stop losses), position-sizing and many other things being properly managed. That is to say, no indicator in the world can by itself make you a successful trader or investor, just like an great kitchen knife doesn’t make you a chef and a Formula 1 car doesn’t make you a professional race driver. What our indicators can do is provide you with the context to better understand market patterns and use them to make high-probability trades confidently.
For those new to trading or technical analysis, we always recommend a demo account until you feel confident in using our indicators.
- These points mark important price levels that allow good points of entry or exit
- The bigger and lighter colored dots are 'safer' than smaller, darker dots
- This has to be evaluated based on underlying and in conjunction with other indicators, such as our Long & Short Entry & Exit Optimizer and others.
- being able to define what lines exactly you can see (kept some of it black box previously)
- lines for the average pivot highs/lows, with L/R settings and lookback period. I prefer L/R ==1 and Lookback == 3 for the most part, but you can play around with that.
- also fine-tuned automatic adjustment of everything based on the underlying (very large price differences in the underlying previously required changing settings all the time to not get too many / too few MMC dots.
- Ability to combine three lines into an average (you can pick one of them more than once, if desired)
- More pre-set alert options will show up in alert screen
Invite-only script
Only users authorized by the author have access to this script, and this usually requires payment. You can add the script to your favorites, but you will only be able to use it after requesting permission and obtaining it from its author — learn more here. For more details, follow the author's instructions below or contact tradingw999 directly.
Note that this private, invite-only script has not been reviewed by script moderators, and its compliance with House Rules is undetermined. TradingView does NOT recommend paying for or using a script unless you fully trust its author and understand how it works. You may also find free, open-source alternatives in our community scripts.
Author's instructions
Warning: please read our guide for invite-only scripts before requesting access.
Disclaimer
Invite-only script
Only users authorized by the author have access to this script, and this usually requires payment. You can add the script to your favorites, but you will only be able to use it after requesting permission and obtaining it from its author — learn more here. For more details, follow the author's instructions below or contact tradingw999 directly.
Note that this private, invite-only script has not been reviewed by script moderators, and its compliance with House Rules is undetermined. TradingView does NOT recommend paying for or using a script unless you fully trust its author and understand how it works. You may also find free, open-source alternatives in our community scripts.
Author's instructions
Warning: please read our guide for invite-only scripts before requesting access.