OPEN-SOURCE SCRIPT
Multi Timeframe EMA
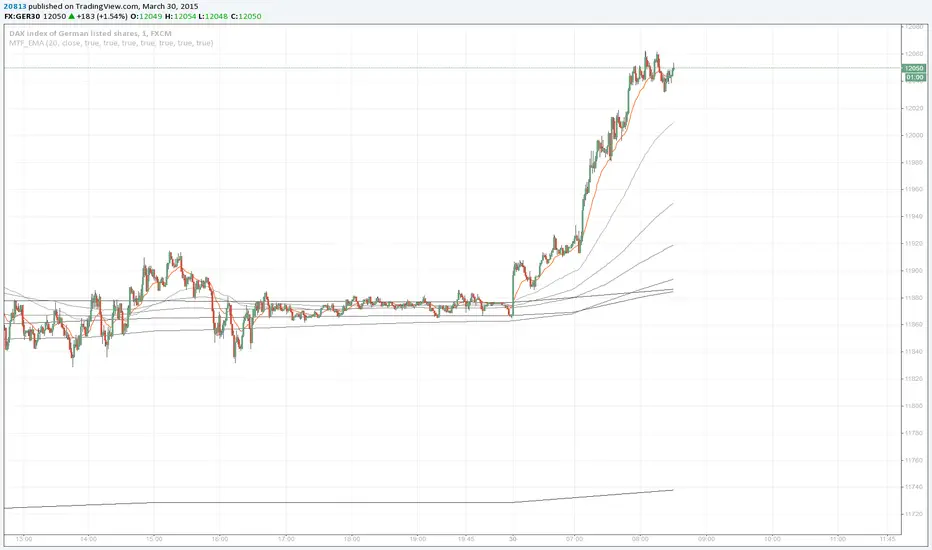
Improved Version of tradingview.com/v/K0YQ1EPH/
Changes:
- smoothed the lines of the higher timeframes
Changes:
- smoothed the lines of the higher timeframes
Open-source script
In true TradingView spirit, the creator of this script has made it open-source, so that traders can review and verify its functionality. Kudos to the author! While you can use it for free, remember that republishing the code is subject to our House Rules.
Disclaimer
The information and publications are not meant to be, and do not constitute, financial, investment, trading, or other types of advice or recommendations supplied or endorsed by TradingView. Read more in the Terms of Use.