OPEN-SOURCE SCRIPT
Updated + Detrended Price Oscillator
According to TradingView the Detrended Price Oscillator is an oscillator that removes trend from price in order to more clearly show an instrument's cyclical
highs and lows so that an investor or trader may more easily time when to buy or sell the underlying instrument. Accordingly, it is not meant to be used as a way of gauging momentum, however, I find it perfectly suitable for the task (at least when used "un-centered" which is how it comes by default here). If you wish to read up more on the DPO just search for it under indicators. It's built in, so you'll find all the information you need on it there. Or check investopedia.
On to the good stuff. What have I done and how does this work?
As un-centered you can use it just like any other momentum oscillator. Price above the zero line is bullish and below is bearish, generally speaking.
I've added two moving averages that you can turn on or off, and choose amongst various types and lengths. Both of these are colored based on trend.
The DPO is also colored based on trend, with a neutral color based on where the DPO is relative to the primary MA and the zero line.
Candles are colored in the same way that the DPO is.
I've added Bollinger Bands because they could be useful on an indicator like this.
All the alert conditions you could dream of.
With this set to centered you will notice that the DPO is not inline with current price. That is intentional, as it's only designed to look at historical price
data to time highs and lows of price movement. As such, I don't recommend using this when set to centered, at least if you're trading crypto. The price volatility
perhaps makes for inconsistent timing of cyclical highs and lows, or perhaps it's the rather brief amount of time cryptocurrencies have been in existence.
I do not know. Just stick to using it un-centered.

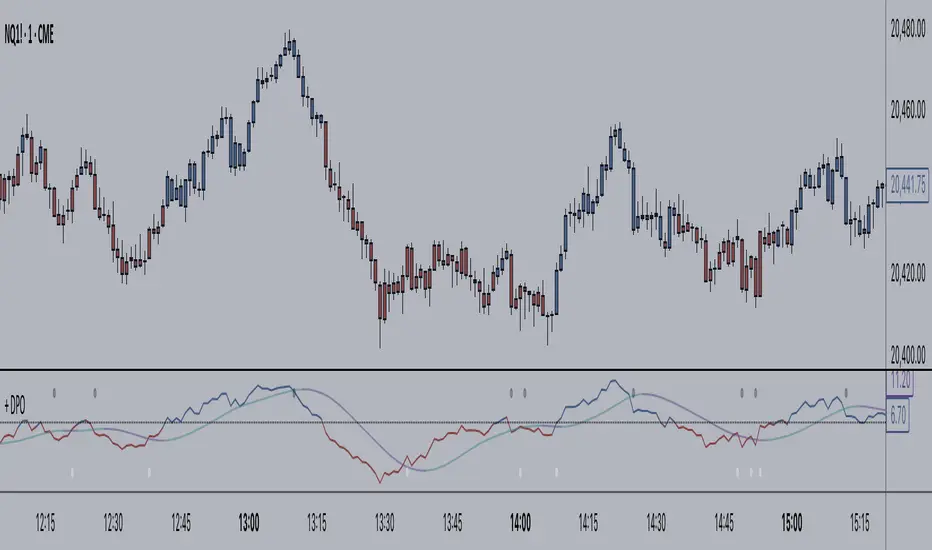
The above image shows the indicator with Bollinger Bands turned on and the MA's turned off. Also, you should note that the candle color and DPO color is based on the primary moving average you are using. If you want consistency, and want to use the Bollinger Bands, then keep your primary moving average set as a 20 SMA, as that is the basis for Bollinger Bands.
Hope this is helpful to you. Definitely pair it with an additional indicator like an RSI, or my +ADP. I like to use something rangebound to compare its signals to.
highs and lows so that an investor or trader may more easily time when to buy or sell the underlying instrument. Accordingly, it is not meant to be used as a way of gauging momentum, however, I find it perfectly suitable for the task (at least when used "un-centered" which is how it comes by default here). If you wish to read up more on the DPO just search for it under indicators. It's built in, so you'll find all the information you need on it there. Or check investopedia.
On to the good stuff. What have I done and how does this work?
As un-centered you can use it just like any other momentum oscillator. Price above the zero line is bullish and below is bearish, generally speaking.
I've added two moving averages that you can turn on or off, and choose amongst various types and lengths. Both of these are colored based on trend.
The DPO is also colored based on trend, with a neutral color based on where the DPO is relative to the primary MA and the zero line.
Candles are colored in the same way that the DPO is.
I've added Bollinger Bands because they could be useful on an indicator like this.
All the alert conditions you could dream of.
With this set to centered you will notice that the DPO is not inline with current price. That is intentional, as it's only designed to look at historical price
data to time highs and lows of price movement. As such, I don't recommend using this when set to centered, at least if you're trading crypto. The price volatility
perhaps makes for inconsistent timing of cyclical highs and lows, or perhaps it's the rather brief amount of time cryptocurrencies have been in existence.
I do not know. Just stick to using it un-centered.
The above image shows the indicator with Bollinger Bands turned on and the MA's turned off. Also, you should note that the candle color and DPO color is based on the primary moving average you are using. If you want consistency, and want to use the Bollinger Bands, then keep your primary moving average set as a 20 SMA, as that is the basis for Bollinger Bands.
Hope this is helpful to you. Definitely pair it with an additional indicator like an RSI, or my +ADP. I like to use something rangebound to compare its signals to.
Release Notes
added a second DPO that can be used to measure momentum vs the first one and the chartadded plot shapes for DPO+MA crosses
added background stripes for DPO+DPO crosses, and an alert condition for that
Release Notes
some very important updates here!first, I changed the way neutral candles are colored. Previously it was with regard to the DPO's relation to the primary and secondary moving averages. This doesn't make much sense to me because in my opinion the center line (in my way of thinking the neutral point for market momentum) is the more relevant factor than the secondary MA, so now the candles are colored in the exact same way the DPO is, and that is with the DPO's relation to the primary MA and the center line.
second, I saw that I had a question from a user about the use of the secondary DPO. And, while understanding the use myself, I realized that my implementation of DPO+DPO crosses was WRONG for the intended use of the second DPO. Partly this came to me while thinking of the use of the center line, and while changing the colored candles. So now the crossing of the two DPO's is of no relevance (it often gave false signals anyway). So where is this all going? The use of the secondary DPO is to act as an additional filter the way a longer lookback moving average might when overlaid on a chart. I set the default setting of the second DPO to 89 (a fib number), and the point of it is, if you so wish to use it this way, to act as a filter for which direction you wish to trade. If it is above the center line then you can use dips on the faster DPO as signals to buy, and vice versa for shorting. You can make up your own set of rules for reversal trading a trend, or for ranging markets, though I think the Bollinger Bands that I updated (there are two of different deviations with a fill in between them -- I've also done away with the fill between top and bottom bands) should help with that.
With the change in how I've approached the momentum issue between the two different DPO's and the centerline, I've removed the background stripes from the DPO+DPO cross (they were useless) and added background stripes for DPO centerline crosses as this is a MUCH more useful feature.
Lastly, I neatened up the inputs screen and changed some verbiage. Pretty much just cosmetic details, but I think it provides a more intuitive, pleasant experience with the indicator.
That's all! Thanks! And happy trading!
Release Notes
just changed some verbiageRelease Notes
removed neutral color for second DPO plot. not sure why I had that in there, other than just copying the primary DPO code. it's just not relevant though, so now it's either bullish or bearish based on the centerline.moving averages off by default now, but ribbon visible.
Release Notes
Changed up the color scheme to take advantage of some of the changes TradingView has made to pinescript to make charts more eye-catching and attractive, while also (hopefully) providing more visual data through color. I've done this with a few of my other indicators, and anything I produce going forward should look similar.Added Donchian Channel Bands with adjustable band thickness.
Explanation for one way of looking at your chart with this indicator.
Release Notes
I just changed 'power' to a float from an integer so that you can fine tune the moving average more. It was something that someone pointed out to me in a comment of another indicator I released.Release Notes
I've added auto-plotting divergences across most of my indicatorsThis is with the default settings of the divergence indicator. If you want fewer--but, I think, more high quality--divergences showing use a higher number. Detrended price oscillator can show divergences that last quite a long time, so you need to be careful taking trades off them, in my opinion.
Release Notes
added alerts for divergences, removed separate bullish/bearish moving average crosses, kept moving average crosses for both bull and bearRelease Notes
converted to version 5added a couple more moving averages
added color swatches for oscillator/moving average cross symbols
added color and candle color option for oscillator being only either above or below the zero line
Release Notes
I'm publishing updates to all of my indicators, so I'm just going to comment on everything here since most of the updates are common across most of my indicators.Specific to the Detrended Price Oscillator I've removed the option for using it "centered" because no one uses it like that anyway.
User Non-Visible Updates (basically backend stuff that makes:
- changes in code legibility and consistency across all indicators (basically standardizing the coding across as many indicators as possible)
- implementation of libraries into my indicators; which helps significantly in doing what I typed above; which in turn will make creating any new indicators, if they are of the type to use these libraries, much simpler
- updated descriptions for all indicators, which should (it's possible I've forgotten things) reflect changes I've made recently and any I may have made in the past after first publication (this is very minor, but as I was changing so much I thought I may as well--I don't intend to update these much, if at all, in the future)
User Visible Updates:
- as I mentioned everything now uses my moving averages library and volatility bands library--this cuts down the total amount of code significantly, and has made it easier for me to add moving averages, or volatility bands to these indicators because I only had to/have to add it one time (to the library) rather than multiple times across all indicators*
- since creating these libraries I've added several new moving averages (Kaufman Adaptive, Laguerre Filter, McGinley Dynamic (doesn't work for all), and Zero-lag) to them while retaining all the previous with the exception of the UMA, which wasn't implemented consistently across all indicators anyway
- eliminated having two Bollinger Bands with different standard deviations and a fill between them in exchange for one with the band fill implementation that I use on my Donchian Channels Bands
- part of my code consistency across all indicators resulted in a much needed organization of the 'style' tab
*(affects all but the Wavetrend Oscillator, Wavetrend Oscillator Overlay, Jurik KDJ, Average Candle Bodies Range, Bollinger Bands Width, ALMA Trend Detector, Ultimate Moving Average, Donchian Channels, and Dynamic Donchian Channels)
Release Notes
Amazing to get two indicator published in one day. Although it's a lot of copy and pasting then replacing at the moment. Anyhow, lots of updates.- updated to pine v6
- brought code more in alignment with TradingView recommendations
- updated to switch operations for selecting moving averages, donchian channel and bollinger bands. This just cuts down on a lot of code and makes the code itself easier to read.
- I did not eliminate the secondary oscillator, though I was tempted. Just not sure how useful it is, but maybe some people like it, and it's a pretty simple thing to leave so, yeah, whatever.
- like every other indicator that has used it, I've eliminated color.gradient from the code, which means you don't get pretty gradient colors when using 'Range' and other color references. My apologies to those who enjoyed that, but part of these updates is cleaning up the UI in the Inputs tab, and getting rid of color inputs was part of that, and due to the way pinescript works, the only way I could eliminate color inputs was to eliminate gradient colors.
- updated divergences code to the latest by TradingView. Hopefully this is an upgrade for those who use them.
- added color by timeframe. There is a tooltip for this, but basically if you're on a daily tf and you select weekly for a higher tf, the dpo and bars will be colored based on where the current dpo is (on the daily tf) relative to the levels and things on the weekly. So like if the dpo is below the signal line (if you're using it) but above the centerline on the daily, but it is above both on the weekly the dpo color and bar color will reflect this (dpo being bullish on the weekly).
I think that's about all.
As always, enjoy responsibly. :)
Release Notes
- fixed a color issue with the smoothed version of the dpo and the signal lineRelease Notes
This is the final update (at least for the next many many months) for all the indicators I have updated in 2025. It seemed like every time I updated and published one, because they have so many similarities between them, and the large amount of copying and pasting I did, I would identify things that I messed up or decided I wanted changed while updating the next one. I have now gone through all of them with a fine-tooth comb, as the saying goes, so that code should be consistent across all of them. That's basically it. Functionally, nothing has changed since I began updating these this year. These changes are so minor you probably won't even notice them.Open-source script
In true TradingView spirit, the creator of this script has made it open-source, so that traders can review and verify its functionality. Kudos to the author! While you can use it for free, remember that republishing the code is subject to our House Rules.
Disclaimer
The information and publications are not meant to be, and do not constitute, financial, investment, trading, or other types of advice or recommendations supplied or endorsed by TradingView. Read more in the Terms of Use.
Open-source script
In true TradingView spirit, the creator of this script has made it open-source, so that traders can review and verify its functionality. Kudos to the author! While you can use it for free, remember that republishing the code is subject to our House Rules.
Disclaimer
The information and publications are not meant to be, and do not constitute, financial, investment, trading, or other types of advice or recommendations supplied or endorsed by TradingView. Read more in the Terms of Use.