OPEN-SOURCE SCRIPT
Updated Normalized DEMA Oscillator SD| QuantEdgeB
📊 Introducing Normalized DEMA Oscillator SD (NDOSD) by QuantEdgeB
🛠️ Overview
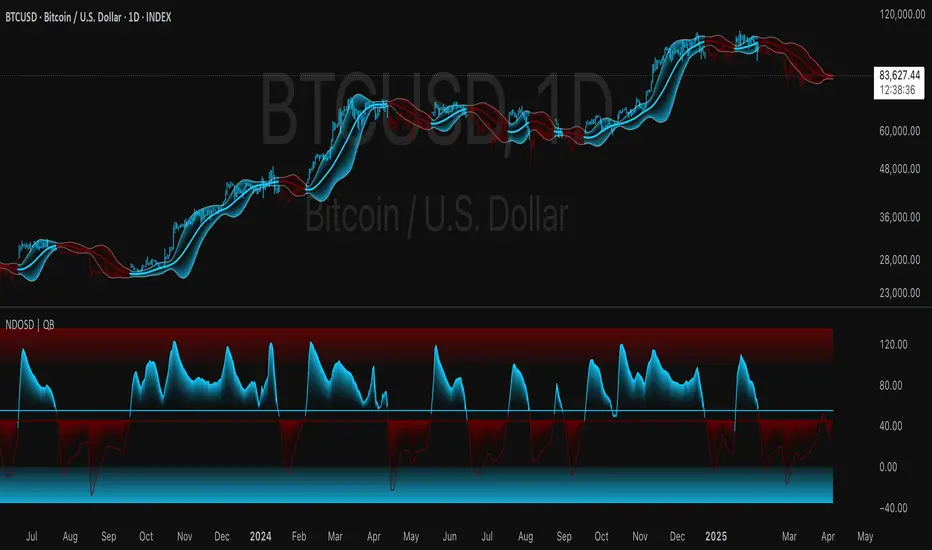
Normalized DEMA Oscillator SD (NDOSD) is a powerful trend and momentum indicator that blends DEMA-based smoothing with a standard deviation-based normalization engine. The result is an oscillator that adapts to volatility, filters noise, and highlights both trend continuations and reversal zones with exceptional clarity.
It normalizes price momentum within an adaptive SD envelope, allowing comparisons across assets and market conditions. Whether you're a trend trader or mean-reverter, NDOSD provides the insight needed for smarter decision-making.
✨ Key Features
🔹 DEMA-Powered Momentum Core
Utilizes a Double EMA (DEMA) for smoother trend detection with reduced lag.
🔹 Normalized SD Bands
Price momentum is standardized using a dynamic 2× standard deviation range—enabling consistent interpretation across assets and timeframes.
🔹 Overbought/Oversold Detection
Includes clear OB/OS zones with shaded thresholds to identify potential reversals or trend exhaustion areas.
🔹 Visual Trend Feedback
Color-coded oscillator zones, candle coloring, and optional signal labels help traders immediately see trend direction and strength.
📐 How It Works
1️⃣ DEMA Calculation
The core of NDOSD is a smoothed price line using a Double EMA, designed to reduce false signals in choppy markets.
2️⃣ Normalization with SD
The DEMA is normalized within a volatility range using a 2x SD calculation, producing a bounded oscillator from 0–100. This transforms the raw signal into a structured format, allowing for OB/OS detection and trend entry clarity.
3️⃣ Signal Generation
• ✅ Long Signal → Oscillator crosses above the long threshold (default: 55) and price holds above the lower SD boundary.
• ❌ Short Signal → Oscillator drops below short threshold (default: 45), often within upper SD boundary context.
4️⃣ OB/OS Thresholds
• Overbought Zone: Above 100 → Caution / Consider profit-taking.
• Oversold Zone: Below 0 → Watch for accumulation setups.
⚙️ Custom Settings
• Calculation Source: Default = close
• DEMA Period: Default = 30
• Base SMA Period: Default = 20
• Long Threshold: Default = 55
• Short Threshold: Default = 45
• Color Mode: Choose from Strategy, Solar, Warm, Cool, Classic, or Magic
• Signal Labels Toggle: Show/hide Long/Short markers on chart
👥 Ideal For
✅ Trend Followers – Identify breakout continuation zones using oscillator thrust and SD structure
✅ Swing Traders – Catch mid-trend entries or mean reversion setups at OB/OS extremes
✅ Quant/Systemic Traders – Normalize signals for algorithmic integration across assets
✅ Multi-Timeframe Analysts – Easily compare trend health using standardized oscillator ranges
📌 Conclusion
Normalized DEMA Oscillator SD is a sleek and adaptive momentum toolkit that helps traders distinguish true momentum from false noise. With its fusion of DEMA smoothing and SD normalization, it works equally well in trending and range-bound conditions.
🔹 Key Takeaways:
1️⃣ Smoother momentum tracking using DEMA
2️⃣ Cross-asset consistency via SD-based normalization
3️⃣ Versatile for both trend confirmation and reversal identification
📌 Disclaimer: Past performance is not indicative of future results. No trading strategy can guarantee success in financial markets.
📌 Strategic Advice: Always backtest, optimize, and align parameters with your trading objectives and risk tolerance before live trading.
Let me know if you want a strategy script or publish-ready layout for TradingView next!
🛠️ Overview
Normalized DEMA Oscillator SD (NDOSD) is a powerful trend and momentum indicator that blends DEMA-based smoothing with a standard deviation-based normalization engine. The result is an oscillator that adapts to volatility, filters noise, and highlights both trend continuations and reversal zones with exceptional clarity.
It normalizes price momentum within an adaptive SD envelope, allowing comparisons across assets and market conditions. Whether you're a trend trader or mean-reverter, NDOSD provides the insight needed for smarter decision-making.
✨ Key Features
🔹 DEMA-Powered Momentum Core
Utilizes a Double EMA (DEMA) for smoother trend detection with reduced lag.
🔹 Normalized SD Bands
Price momentum is standardized using a dynamic 2× standard deviation range—enabling consistent interpretation across assets and timeframes.
🔹 Overbought/Oversold Detection
Includes clear OB/OS zones with shaded thresholds to identify potential reversals or trend exhaustion areas.
🔹 Visual Trend Feedback
Color-coded oscillator zones, candle coloring, and optional signal labels help traders immediately see trend direction and strength.
📐 How It Works
1️⃣ DEMA Calculation
The core of NDOSD is a smoothed price line using a Double EMA, designed to reduce false signals in choppy markets.
2️⃣ Normalization with SD
The DEMA is normalized within a volatility range using a 2x SD calculation, producing a bounded oscillator from 0–100. This transforms the raw signal into a structured format, allowing for OB/OS detection and trend entry clarity.
3️⃣ Signal Generation
• ✅ Long Signal → Oscillator crosses above the long threshold (default: 55) and price holds above the lower SD boundary.
• ❌ Short Signal → Oscillator drops below short threshold (default: 45), often within upper SD boundary context.
4️⃣ OB/OS Thresholds
• Overbought Zone: Above 100 → Caution / Consider profit-taking.
• Oversold Zone: Below 0 → Watch for accumulation setups.
⚙️ Custom Settings
• Calculation Source: Default = close
• DEMA Period: Default = 30
• Base SMA Period: Default = 20
• Long Threshold: Default = 55
• Short Threshold: Default = 45
• Color Mode: Choose from Strategy, Solar, Warm, Cool, Classic, or Magic
• Signal Labels Toggle: Show/hide Long/Short markers on chart
👥 Ideal For
✅ Trend Followers – Identify breakout continuation zones using oscillator thrust and SD structure
✅ Swing Traders – Catch mid-trend entries or mean reversion setups at OB/OS extremes
✅ Quant/Systemic Traders – Normalize signals for algorithmic integration across assets
✅ Multi-Timeframe Analysts – Easily compare trend health using standardized oscillator ranges
📌 Conclusion
Normalized DEMA Oscillator SD is a sleek and adaptive momentum toolkit that helps traders distinguish true momentum from false noise. With its fusion of DEMA smoothing and SD normalization, it works equally well in trending and range-bound conditions.
🔹 Key Takeaways:
1️⃣ Smoother momentum tracking using DEMA
2️⃣ Cross-asset consistency via SD-based normalization
3️⃣ Versatile for both trend confirmation and reversal identification
📌 Disclaimer: Past performance is not indicative of future results. No trading strategy can guarantee success in financial markets.
📌 Strategic Advice: Always backtest, optimize, and align parameters with your trading objectives and risk tolerance before live trading.
Let me know if you want a strategy script or publish-ready layout for TradingView next!
Release Notes
added custom color settingsOpen-source script
In true TradingView spirit, the creator of this script has made it open-source, so that traders can review and verify its functionality. Kudos to the author! While you can use it for free, remember that republishing the code is subject to our House Rules.
🔹 Get access to our premium tools:
whop.com/basetrustcapital 💎
🔹 Unlock our free toolbox:
tradinglibrary.carrd.co/ 🛠️
Disclaimer: All resources and indicators provided are for educational purposes only
whop.com/basetrustcapital 💎
🔹 Unlock our free toolbox:
tradinglibrary.carrd.co/ 🛠️
Disclaimer: All resources and indicators provided are for educational purposes only
Disclaimer
The information and publications are not meant to be, and do not constitute, financial, investment, trading, or other types of advice or recommendations supplied or endorsed by TradingView. Read more in the Terms of Use.
Open-source script
In true TradingView spirit, the creator of this script has made it open-source, so that traders can review and verify its functionality. Kudos to the author! While you can use it for free, remember that republishing the code is subject to our House Rules.
🔹 Get access to our premium tools:
whop.com/basetrustcapital 💎
🔹 Unlock our free toolbox:
tradinglibrary.carrd.co/ 🛠️
Disclaimer: All resources and indicators provided are for educational purposes only
whop.com/basetrustcapital 💎
🔹 Unlock our free toolbox:
tradinglibrary.carrd.co/ 🛠️
Disclaimer: All resources and indicators provided are for educational purposes only
Disclaimer
The information and publications are not meant to be, and do not constitute, financial, investment, trading, or other types of advice or recommendations supplied or endorsed by TradingView. Read more in the Terms of Use.