OPEN-SOURCE SCRIPT
Updated RSI in pane and 3 EMAs on chart
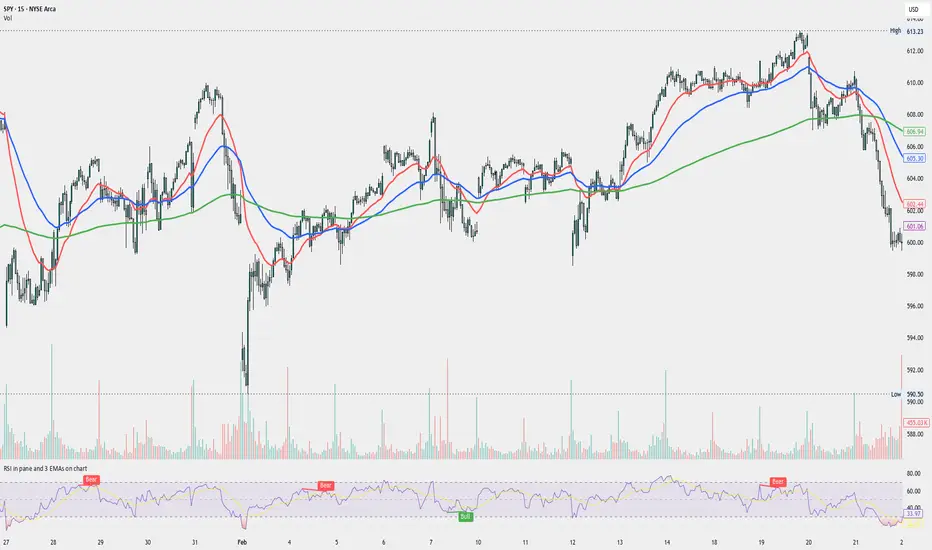
Custom RSI in Pane + 3 EMAs on Chart — with Optional RSI Divergence Detection
Features
RSI Divergence Detection
3 EMA Trend Indicators on Price Chart
Why use this script?
Gives a full view of trend + momentum without cluttering the main price chart, and it helps confirm entries and exits by observing RSI behavior alongside EMAs. The optional divergence detection can act as a signal for potential exhaustion or reversal (not entry signals on their own). It is a Good fit for traders who use RSI zones, divergences, and EMA structure in their decision-making, both for intra-day and swing trades (where it performs best).
How to use
Combines RSI in a separate pane with 3 EMAs on the chart and optional RSI-based divergence detection. Useful for analyzing both momentum and trend structure.
Features
- RSI Pane
- Custom RSI calculation (not built-in ta.rsi) with adjustable source and length
- Overlay optional moving average (SMA, EMA, SMMA/RMA, WMA, VWMA, or Bollinger Bands) Overbought/oversold gradient fill for visual clarity (70 / 30 zones)
- Midline (50) for neutral RSI territory
RSI Divergence Detection
- Optional: toggle on/off with one input
- Regular Bullish Divergence: Price makes a lower low, RSI makes a higher low
- Regular Bearish Divergence: Price makes a higher high, RSI makes a lower high
- Customizable lookback for pivot detection
- Visual markers and labels plotted on RSI
- Built-in alert conditions for both divergence types
3 EMA Trend Indicators on Price Chart
- Three customizable EMAs (default: 20, 50, 200)
- Color-coded and clearly plotted on main chart
- Use to determine short/mid/long-term trend bias
- No repainting or smoothing artifacts
Why use this script?
Gives a full view of trend + momentum without cluttering the main price chart, and it helps confirm entries and exits by observing RSI behavior alongside EMAs. The optional divergence detection can act as a signal for potential exhaustion or reversal (not entry signals on their own). It is a Good fit for traders who use RSI zones, divergences, and EMA structure in their decision-making, both for intra-day and swing trades (where it performs best).
How to use
- Add this script to your chart. EMAs will appear on the main price chart; RSI and divergence will appear in a separate pane.
- Adjust RSI and MA settings to fit your trading style (e.g., fast RSI for scalping, slower for swing)
- Enable "Show Divergence" if you want visual alerts and markers
- Use alerts to get notified when a divergence occurs without watching the chart
Always check the divergences on different time frames to validate the setup, and do not consider them valid on small time frames (<15 minutes).Built for traders who want both momentum and trend context in a single tool — without clutter, repainting, or noise. I created this script to streamline my own analysis and avoid switching between multiple indicators. It's not meant to be a "signal generator" but a visual assistant for making better decisions. If you find it useful or have feedback, feel free to reach out.
Release Notes
OverviewThis indicator merges a custom-built RSI panel (with optional MA or Bollinger Band overlays and automated divergence scanning) with three EMAs on the main chart. It delivers both momentum and trend context in one lightweight tool.
---
Key Features
Custom RSI Calculation
- - Uses RMA smoothing for gains/losses rather than built-in `ta.rsi` for more consistent readings
- - Select any data source (close, open, high, low, etc.) and period
Flexible Overlays on RSI
- Overlay SMA, EMA, SMMA (RMA), WMA, VWMA, or Bollinger Bands
- Adjust period and, for BB, the standard-deviation multiplier
- Colored fill between overbought/oversold zones (70/30) for quick visual cues
Automated Divergence Detection
- Toggle on/off with a single input
- Detects regular bullish divergence (price ↓↓, RSI ↑↓) and bearish divergence (price ↑↑, RSI ↓↑)
- User-settable lookback for pivot highs/lows and bar-range limits
- On-chart markers with labels and built-in `alertcondition` calls
Triple EMA Trend Lines
- Plot three EMAs (default 20, 50, 200) directly on price
- Distinct colors for short, medium, long-term bias
- No repainting or smoothing artifacts
---
How It Works
1. RSI Panel
- Computes RSI by smoothing price changes via `ta.rma`
- Applies optional overlay (MA or BB) to the RSI series
2. Divergence Logic
- Scans for pivot highs/lows over your chosen lookback window
- Flags divergence when price and RSI move in opposite directions
- Marks pivots on the RSI pane and triggers alerts
3. EMA Trend Lines
- Calculates EMAs on the main chart to confirm momentum signals
---
Usage Instructions
1. Add the indicator; RSI appears in its own pane, EMAs overlay your price chart.
2. Set RSI Length and Source to match your style (e.g. shorter for scalping).
3. Choose an Overlay Type and configure its period (and BB multiplier if used).
4. Enable Show Divergence, then set Pivot Lookback and Bar Range.
5. Use the built-in alerts to catch divergence without staring at the screen.
6. Combine divergence signals with EMA bias for entry/exit decisions (avoid relying on divergence alone on timeframes under 15 min!!).
---
Position Management Guidelines
You can use this tool to manage entries, scaling, and exits:
Entry Confirmation
- In an uptrend (price above medium & long EMAs), wait for a bullish RSI divergence to confirm a long entry.
- In a downtrend (price below medium & long EMAs), look for bearish divergence before initiating a short.
Scaling In
- Add to positions when RSI crosses above 50 after a bullish divergence and price holds above the short EMA.
- For shorts, scale in when RSI falls below 50 after bearish divergence and price remains below the short EMA.
Profit Scaling / Partial Exit
- When RSI approaches overbought (>70) in an uptrend, consider closing a tranche of longs (especially if price stalls at a key EMA).
- If bearish divergence appears while in profit, use it to justify reducing exposure.
Full Exit Rules
- Close longs if price breaks below the short EMA and RSI also moves below 50 after a confirmed bearish divergence.
- Liquidate shorts when price moves above the short EMA and RSI crosses above midline following a bullish divergence.
Monitoring Open Trades
- Watch RSI zones: extended extremes (>80 or <20) often precede pullbacks—tighten stops or trim positions.
- Use EMA crossovers (short crossing medium or medium crossing long) as a signal to shift bias or exit entirely.
Alerts can notify you of these events, ensuring you act even if you’re away from the screen.
NOTE: I strongly suggest testing different configuration for different instruments (indexes, stocks, crypto, forex), in particular for the EMA lenghts and the right MA/Bollinger bands to be used with RSI. The default parameters seem to work well for me for high-volume stocks on the US market.
---
What Makes It Original
- Custom smoothing of RSI via RMA for a more reliable momentum measure
- Integrated overlay options (MA + BB) on the RSI itself—rare in community scripts
- Built-in divergence engine with user-defined parameters and alert support
- Position management section offers concrete guidelines for entries, scaling, and exits
I built this to consolidate trend, momentum, and risk control in one script. Let me know in comments if you have questions or doubts.
Open-source script
In true TradingView spirit, the creator of this script has made it open-source, so that traders can review and verify its functionality. Kudos to the author! While you can use it for free, remember that republishing the code is subject to our House Rules.
Disclaimer
The information and publications are not meant to be, and do not constitute, financial, investment, trading, or other types of advice or recommendations supplied or endorsed by TradingView. Read more in the Terms of Use.