BTC DCA Risk Metric StrategyBTC DCA Risk Strategy - Automated Dollar Cost Averaging with 3Commas Integration
Overview
This strategy combines the proven Oakley Wood Risk Metric with an intelligent tiered Dollar Cost Averaging (DCA) system, designed to help traders systematically accumulate Bitcoin during periods of low risk and take profits during high-risk conditions.
Key Features
📊 Multi-Component Risk Assessment
4-Year SMA Deviation: Measures Bitcoin's distance from its long-term mean
20-Week MA Analysis: Tracks medium-term momentum shifts
50-Day/50-Week MA Ratio: Captures short-to-medium term trend strength
All metrics are normalized by time to account for Bitcoin's maturing market dynamics
💰 3-Tier DCA Buy System
Level 1 (Low Risk): Conservative entry with base allocation
Level 2 (Lower Risk): Increased allocation as opportunity improves
Level 3 (Extreme Low Risk): Maximum allocation during rare buying opportunities
Buys execute every bar while risk remains below thresholds, enabling true DCA accumulation
📈 Progressive Profit Taking
Sell Level 1: Take initial profits as risk increases
Sell Level 2: Scale out further positions during elevated risk
Sell Level 3: Final exit during extreme market conditions
Sell levels automatically reset when new buy signals occur, allowing flexible re-entry
🤖 3Commas Integration
Fully automated webhook alerts for Custom Signal Bots
JSON payloads formatted per 3Commas API specifications
Supports multiple exchanges (Binance, Coinbase, Kraken, Gemini, Bybit)
Configurable quote currency (USD, USDT, BUSD)
How It Works
The strategy calculates a composite risk metric (0-1 scale):
0.0-0.2: Extreme buying opportunity (green zone)
0.2-0.5: Favorable accumulation range (yellow zone)
0.5-0.8: Neutral to cautious territory (orange zone)
0.8-1.0+: High risk, profit-taking zone (red zone)
Buy Logic: As risk decreases, position sizes increase automatically. If risk drops from L1 to L3 threshold, the strategy combines all three tier allocations for maximum exposure.
Sell Logic: Sequential profit-taking ensures you capture gains progressively. The system won't advance to Sell L2 until L1 completes, preventing premature full exits.
Configuration
Risk Metric Parameters:
All calculations use Bitcoin price data (any BTC chart works)
Time-normalized formulas adapt to market maturity
No manual parameter tuning required
Buy Settings:
Set risk thresholds for each tier (default: 0.20, 0.10, 0.00)
Define dollar amounts per tier (default: $10, $15, $20)
Fully customizable to your risk tolerance and capital
Sell Settings:
Configure risk thresholds for profit-taking (default: 1.00, 1.50, 2.00)
Set percentage of position to sell at each level (default: 25%, 35%, 40%)
3Commas Setup:
Create a Custom Signal Bot in 3Commas
Copy Bot UUID and Secret Token into strategy inputs
Enable 3Commas Alerts checkbox
Create TradingView alert: Condition → "alert() function calls only", Webhook → api.3commas.io
Backtesting Results
Strengths:
Systematically buys dips without emotion
Averages down during extended bear markets
Captures explosive bull run profits through tiered exits
Pyramiding (1000 max orders) allows true DCA behavior
Considerations:
Requires sufficient capital for multiple buys during prolonged downtrends
Backtest on Daily timeframe for most reliable signals
Past performance does not guarantee future results
Visual Design
The indicator pane displays:
Color-coded risk metric line: Changes from white→red→orange→yellow→green as risk decreases
Background zones: Green (buy), yellow (hold), red (sell) areas
Dashed threshold lines: Clear visual markers for each buy/sell level
Entry/Exit labels: Green buy labels and orange/red sell labels mark all trades
Credits
Original Risk Metric: Oakley Wood
Strategy Development & 3Commas Integration: Claude AI (Anthropic)
Modifications: pommesUNDwurst
Disclaimer
This strategy is for educational and informational purposes only. Cryptocurrency trading carries substantial risk of loss. Always conduct your own research and never invest more than you can afford to lose. The authors are not financial advisors and assume no responsibility for trading decisions made using this tool.
3commas

ICT Smart Money Trading Suite PRO [SwissAlgo]ICT SMC Trading Suite Pro
Structure Detection. Imbalance Tracking. Trade Planning. Contextual Alerts.
Why This Integrated System Was Built
The ICT/SMC methodology requires tracking multiple analytical components simultaneously - a process prone to manual errors, time inefficiency, and visual clutter . This indicator consolidates these elements into a single, unified system , providing rules-based validation for experienced ICT traders who may struggle with execution speed, consistency, and manual calculations.
-----------------------------------------------------------------
What This Indicator Does
ICT/SMC methodology involves tracking multiple analytical components simultaneously. This indicator consolidates them into a single system.
Common challenges when applying ICT manually:
1️⃣ Structure Identification
Determining which pivots qualify as external (macro) structure versus internal (micro) structure requires consistent rules. Inconsistent structure identification affects the detection of the relevant trading range for entries , Change of Character (ChoCH) , and Break of Structure (BoS) . Accurate structure identification is paramount ; a faulty reading invalidates the entire ICT thesis for the current swing. While no automated system can replace human judgment, the indicator provides you with a rules-based starting point for structural analysis. The key goal is to help you find and map the relevant structural leg to focus on.
2️⃣ Chart Organization
Drawing Fibonacci retracements, Fair Value Gaps, Order Blocks, and other imbalances manually creates visual complexity that can obscure the analysis. The indicator addresses this by striving to show all imbalances in a consistent, unified, and understandable visual way , using color coding and z-order layering to maintain clarity even when multiple components are active.
3️⃣ Imbalance Tracking
ICT methodology requires monitoring a vast array of institutional footprints : Fair Value Gaps (FVG), Order Blocks (OB), Breaker Blocks (BB), Liquidity Pools (LP), Volume Imbalances, Wick Imbalances, and Kill Zone ranges. Tracking all these simultaneously and manually monitoring their mitigation status is highly time-intensive and prone to oversight . The indicator constantly scans and tracks all key imbalance types for you, automatically updating their status and creating a dynamic, real-time visual heatmap of unmitigated institutional inefficiency.
4️⃣ Trade Calculation
Determining structure-based Stop Loss (SL) placement, calculating multiple Take Profit (TP) levels with accurate position-sizing splits, and computing the final blended Risk-to-Reward (R:R) ratio involves multiple time-sensitive, manual calculations per setup . The indicator automates this entire trade calculation process for you, instantly providing the necessary pricing (entry, SL, TP), sizing, and performance projections, and mitigating the risk of execution error .
5️⃣ Condition Monitoring
ICT setups often require specific technical conditions to align: price reaching discount Fibonacci levels (0.618-0.882 for shorts, 0.118-0.382 for longs), EMA crossovers confirming momentum, or structural shifts (ChoCH/BoS). Identifying these moments requires continuous chart observation across multiple assets and timeframes.
This indicator includes an alert system that monitors these technical conditions and sends notifications when they occur (real-time). The alert system is designed to minimize spam. This allows traders to review potential setups on demand rather than through continuous observation - particularly relevant for those monitoring multiple instruments or trading sessions outside their local timezone.
-----------------------------------------------------------------
Intended Use
This indicator is designed for traders who:
♦ Apply ICT/SMC methodology - Familiarity with concepts such as Fair Value Gaps, Order Blocks, Liquidity Pools, market structure, and discount/premium zones is assumed. The indicator does not teach these concepts but provides tools to apply them.
♦ Trade on intraday to swing timeframes - The structure detection and Fibonacci zone mapping work across multiple timeframes. Recommended primary timeframe: 1H (adjustable based on trading approach).
♦ Prefer systematic entry planning - The trade calculation feature computes stop loss, take profit levels, and risk-to-reward ratios based on structure and Fibonacci positioning. Suitable for traders who use defined entry criteria.
♦ Monitor multiple instruments or sessions - The alert functionality notifies when specific technical conditions occur (discount zone entries, EMA crossovers, structure changes), reducing the need for continuous manual monitoring.
♦ Use trade execution platforms - The trade summary table displays pre-formatted values (entry, SL, TP levels with quantity splits) that can be manually input into trading platforms or bot services like 3Commas.
-----------------------------------------------------------------
How To Use
Step 1: Structure Analysis
The indicator automatically detects external and internal market structure using pivot analysis. Structure lines are color-coded: red for bearish structure, green for bullish. External pivots are marked with larger triangles, internal pivots with smaller markers. The pivot length parameters (default: 20/20) can be adjusted in settings to align with your structural analysis approach and the asset you are analyzing.
Step 2: Define Your Trading Zone
Use the "Start Swing" and "End Swing" date inputs to mark the beginning and end of the (external) structural leg you wish to analyze. The indicator calculates Fibonacci retracement levels based on these points and color-codes the zones:
* Green zones: Discount area (0.618-0.882 for bearish / 0.118-0.382 for bullish)
* Yellow zones: Premium area (0.786-1.0 for bearish / 0.0-0.214 for bullish)
* Red zones: Extension area beyond structure (potential fake-out zones)
Step 3: Review Imbalances
The indicator identifies and displays multiple imbalance types:
🔥 Volume imbalances (from displacement candles based on PVSRA methodology)
🔥 Fair Value Gaps (FVG)
🔥 Order Blocks (OB) and Breaker Blocks (BB)
🔥 Liquidity Pools (LP) at equal highs/lows
🔥 Wick imbalances (exceptional wick formations)
🔥 Kill Zone liquidity from specific trading sessions (Asian, London, NY AM)
Volume Imbalances
Fair Value Gaps
Order Blocks
Liquidity Pools
Wick Imbalances
Kill Zone Imbalances
According to ICT methodology, imbalances act as price magnets - areas where price tends to return for mitigation. When multiple imbalances overlap at the same price level, this creates a confluence zone with a higher probability of price reaction .
Imbalances are displayed as gray boxes , creating a visual heatmap of institutional inefficiencies. When imbalances overlap, the zones appear darker due to layering, and labels combine to show confluence (e.g., "FVG + OB" or "Vol + LP").
Heatmap of Imbalances
User can view each type alone, or all together (heatmap)
Each imbalance type is tracked until mitigated by price according to ICT principles and can be toggled on/off independently in settings.
Step 4: Reference Levels & Sessions
The indicator displays additional reference data:
🔥 Daily Pivot Points (PP, R1-R3, S1-S3) calculated from previous day
🔥Average Daily Range (ADR) projected from the current day's extremes
🔥 Daily OHLC levels: Today's Open (DO), Previous Day High (PDH), Previous Day Low (PDL)
🔥Session backgrounds (optional): Color-coded boxes for Asian, London, NY AM, and NY PM sessions
Sessions
While these are not ICT-specific imbalances, they represent widely-watched price levels that often attract institutional activity and can act as additional reference points for support, resistance, and liquidity targeting.
All reference levels can be toggled independently in settings.
Step 5: Momentum Reference
EMA 14 and EMA 21 lines are displayed for momentum analysis. When EMA 14 enters discount zones and crosses EMA 21, a triangle marker appears on the chart. This indicates a potential alignment of structure and momentum conditions.
Step 6: Trade Planning
Input your intended entry price in the "Entry Price" field along with your margin and leverage parameters. The indicator automatically calculates all trade parameters:
* Stop loss level (based on Fibonacci structure - typically at 1.118 extension)
* Three take profit levels (TP1, TP2, TP3) with position quantity splits
* Risk-to-reward ratio (blended across all three targets)
* Projected profit/loss values in both dollars and percentage
All calculated values are displayed both visually on the chart (as horizontal lines with labels) and in a formatted Trade Summary table. The table organizes the information for quick reference: entry details, take profit levels with quantities, stop loss parameters, and performance projections.
This pre-calculated data can be manually copied into trading platforms or bot services (such as 3Commas Smart Trades) without requiring additional calculations.
Step 7: Alert Configuration
Create alerts using TradingView's alert system (select "Any alert() function call"). The indicator sends notifications when:
* Price reaches specific discount Fibonacci levels (0.618, 0.786, 0.882 for shorts / 0.382, 0.214, 0.118 for longs)
* EMA 14/21 crossovers occur within discount zones
* Change of Character (ChoCH) is detected
* Break of Structure (BoS) is detected
Note: Alerts require active TradingView alert functionality. Update alerts when changing your trading zone parameters.
-----------------------------------------------------------------
Key Features
Structure & Zone Analysis
* Automated structure detection with external/internal pivots and zig-zag visualization
* Fibonacci retracement mapping with color-coded discount/premium zones
* Visual zone classification: Green (optimal discount), Yellow (premium), Red (fake-out risk)
ICT Imbalances Heatmap
* Volume imbalances (PVSRA displacement candles)
* Fair Value Gaps (FVG)
* Order Blocks (OB) and Breaker Blocks (BB)
* Liquidity Pools (LP) at equal highs/lows
* Wick imbalances (exceptional wick formations)
* Kill Zone liquidity (Asian, London, NY AM sessions)
* Confluence detection with combined labels and visual layering
Reference Levels
* Daily Pivot Points (PP, R1-R3, S1-S3)
* Average Daily Range (ADR) projections
* Daily OHLC levels (DO, PDH, PDL)
* Session backgrounds for kill zones
Trade Planning Tools
* Automated stop loss calculation based on Fibonacci structure
* Three-tier take profit system with position quantity splits
* Risk-to-reward ratio calculation (blended across all targets)
* P&L projections in dollars and percentages
* Trade Summary table formatted for manual platform entry
Momentum & Signals
* EMA 14/21 overlay for momentum analysis
* Visual crossover markers (triangles) in discount zones
* Change of Character (ChoCH) detection and labels
* Break of Structure (BoS) detection and labels
Chart Enhancements
* Higher timeframe candle overlay (5m to Monthly)
* PVSRA candle coloring (volume-based)
* Symbol legend for quick reference
* Customizable visual elements (toggle all components independently)
Alert System
* Discount zone entry notifications (Fibonacci level monitoring)
* EMA crossover signals within discount zones
* Structure change alerts (ChoCH and BoS)
* Configurable via TradingView alert functionality
Alert Functionality
The indicator includes an alert system that monitors technical conditions continuously.
When configured, alerts notify users when specific events occur:
❗ Discount Zone Monitoring
When EMA 14 crosses into key Fibonacci levels (0.618, 0.786, 0.882 for bearish structure / 0.382, 0.214, 0.118 for bullish structure), an alert is triggered. Example: Trading BTC and ETH simultaneously - instead of monitoring both charts for zone entries, alerts notify when either asset reaches the specified level.
❗ Momentum Alignment
When EMA 14 crosses EMA 21 within discount zones, an alert is sent. Example: Monitoring setups across multiple timeframes (1H, 4H, Daily) - alerts indicate when momentum conditions align on any timeframe being tracked.
❗ Structure Changes
Change of Character (ChoCH) and Break of Structure (BoS) events trigger alerts. Example: Trading during the Asian session while located in a different timezone - alerts notify of structure changes occurring outside active monitoring hours.
Configuration
Alerts are set up through TradingView's native alert system. Select "Any alert() function call" when creating the alert.
⚠️ Note: Alert parameters are captured at creation time, so alerts must be updated when changing trading zone settings (Start/End Swing dates) or any other parameter.
How to Create Alerts
Step 1: Open Alert Creation
Click the "Alert" button (clock icon) in the top toolbar of TradingView, or right-click on the chart and select "Add Alert."
Step 2: Configure Alert Condition
* In the alert dialog, set the Condition dropdown to select this indicator
* Set the alert type to ⚠️ " Any alert() function call "
* This configuration allows the indicator to trigger alerts based on its internal logic
Step 3: Set Alert Timing
* Timeframe: Same as chart
* Expiration: Choose "Open-ended (when triggered)" to keep the alert active until conditions occur
* Message tab: choose a name for the alert
Step 4: Notification Settings
Configure how you want to receive notifications:
* Popup within TradingView
* Email notification
* Mobile app push notification (requires TradingView mobile app)
Step 5: Create
Important Notes:
* Alert parameters are captured at creation time . If you change your trading zone (Start/End Swing dates) or entry price, delete the old alert and create a new one .
* One alert per chart: Create separate alerts for each instrument and timeframe you're monitoring.
* TradingView alert limits apply based on your TradingView subscription tier.
What Triggers Alerts: This indicator sends alerts for four key event types:
1. Discount Zone Entry - EMA 14 crossing key Fibonacci levels
2. Momentum Crossover - EMA 14/21 crossovers within discount zones
3. Change of Character (ChoCH) - Structure reversal detected
4. Break of Structure (BoS) - Trend continuation confirmed
All four conditions are monitored by a single alert configuration .
-----------------------------------------------------------------
Recommended Settings
* Timeframe : 1H works well for most assets
* Theme : Dark mode recommended
* Structural Pivots : Default 20/20 captures reasonable structure; adjust to match your analysis
-----------------------------------------------------------------
Chart Elements Guide
♦ Structure Visualization
Zig-zag lines
Automated structure detection - green lines indicate bullish structure, red lines indicate bearish structure. Thick lines represent external structure , thin faded lines show internal structure .
Triangle markers
Large triangles mark external pivots (swing highs/lows), small triangles mark internal pivots.
Fibonacci Zones
* Green zones: Discount area - potential entry zones (0.618-0.882 for shorts / 0.118-0.382 for longs)
* Yellow zones: Premium area - higher extension zones (0.786-1.0 for shorts / 0.0-0.214 for longs)
* Red zones: Fake-out risk area - price beyond structural extremes (above 1.0 for shorts / below 0.0 for longs)
* White dashed lines: Individual Fibonacci levels (1.0, 0.882, 0.786, 0.618, 0.5, 0.382, 0.214, 0.118, 0.0)
♦ Imbalance Heatmap
Gray boxes with dotted midlines
Unmitigated imbalances create a visual heatmap. Overlapping imbalances appear darker due to layering.
Combined labels
When multiple imbalances overlap, labels show confluence (e.g., "FVG + OB", "Vol + LP + Wick")
Types displayed : Vol (Volume), FVG (Fair Value Gap), OB (Order Block), BB (Breaker Block), LP (Liquidity Pool), Wick, KZ (Kill Zone)
♦ Momentum Indicators
* Red line: EMA 14
* Yellow line: EMA 21
* Small triangles on price: Crossover signals - red triangle (bearish crossover), green triangle (bullish crossover) when occurring within discount zones
♦ Structure Change Markers
* Labels with checkmarks/crosses: ChoCH (Change of Character) and BoS (Break of Structure) events (Green label with ✓: Bullish ChoCH or BoS, Red label with ✗: Bearish ChoCH or BoS)
♦ Trade Planning Lines (when entry price is set)
* Blue horizontal line: Entry price
* Green dashed lines: TP1 and TP2
* Green solid line: TP3 (final target)
* Red horizontal line: Stop Loss level
TP levels and SL are calculated based on the structure range, entry price, and mapped trading zone, and aim to achieve a minimum risk: reward ratio of 1:1.5 (R:R)
♦ Colored background zones:
Green shading between entry and TP3 (profit zone), red shading between entry and SL (loss zone)
♦ Reference Levels
* Orange dotted lines with labels: Daily Pivot Points (PP, R1-R3, S1-S3)
* Purple dotted lines with labels: ADR High and ADR Low projections
* Cyan dotted lines with labels: DO (Daily Open), PDH (Previous Day High), PDL (Previous Day Low)
♦ Session Backgrounds (optional)
* Yellow shaded box: Asian session (19:00-00:00 NY time)
* Blue shaded box: London session (02:00-05:00 NY time)
* Green shaded box: NY AM session (09:30-11:00 NY time)
* Orange shaded box: NY PM session (13:30-16:00 NY time)
♦ Trade Summary Table (top-right corner)
Displays a complete trade plan with sections:
* Sanity Check: Plan validation status
* Setup: Trade type, leverage, entry price, position size
* Take Profit: TP1, TP2, TP3 with prices, percentages, and quantity splits
* Stop Loss: SL price and type
* Performance: Potential profit/loss, ROI, and risk-to-reward ratio
♦ HTF Candle Overlay (optional, displayed to the right of the current price)
* Larger candlesticks representing higher timeframe price action
* Green bodies: Bullish HTF candles
* Red bodies: Bearish HTF candles
* Label shows selected timeframe (e.g., "HTF→ D" for daily)
♦ Legend Table (bottom-right corner)
Quick reference guide explaining all symbol abbreviations and color codes used on the chart.
-----------------------------------------------------------------
Methodology & Calculation Details
This indicator consolidates multiple ICT/SMC analytical components into a single integrated system. While individual elements could be created separately, this integration provides automated coordination between components , consistency, and reduces chart complexity.
Structure Detection External and internal pivots
Are identified using fractal pivot analysis with configurable lookback periods (default: 20 bars for both). A pivot high is confirmed when the high at the pivot bar exceeds all highs within the lookback range on both sides. Pivot lows use inverse logic. Structure lines connect validated pivots, with color coding based on price direction (higher highs/higher lows = bullish, lower highs/lower lows = bearish).
Fibonacci Retracement Calculation
Users define two swing points via date/time inputs. The indicator calculates the price range between these points and applies standard Fibonacci ratios (0.0, 0.118, 0.214, 0.382, 0.5, 0.618, 0.786, 0.882, 1.0, plus extensions at 1.118, 1.272, -0.118, -0.272). Zone classification is based on ICT discount/premium principles: 0.618-1.0 range for bearish setups, 0.0-0.382 for bullish setups.
Imbalance Identification
Volume Imbalances : Detected using PVSRA (Price, Volume, Support, Resistance Analysis) methodology. Candles are classified based on the percentile ranking of volume and price range over a 1344-bar lookback period. Type 1 imbalances require ≥95th percentile in both volume and range; Type 2 requires ≥85th percentile. Additional filters include body-to-range ratio (≥50% for Type 1, ≥30% for Type 2) and ATR validation.
Fair Value Gaps (FVG) : Identified when a three-candle sequence shows a price gap: low > high for bullish FVG, high < low for bearish FVG. The middle candle must close beyond the gap edge. Mitigation occurs when the price retraces into the gap.
Order Blocks (OB) : Detected by identifying the last opposing candle before a significant price move. When price breaks a swing high/low, the algorithm scans backwards to find the candle with the highest high (bearish OB) or lowest low (bullish OB) before the breakout. When an OB is breached, it converts to a Breaker Block (BB).
Liquidity Pools (LP) : Identified by detecting equal highs or equal lows using a tolerance threshold based on ATR. Pivot highs/lows within this tolerance range are grouped. Equal highs create Buy-Side Liquidity (BSL) zones above the level; equal lows create Sell-Side Liquidity (SSL) zones below the level.
Wick Imbalances: Flagged when a candle's wick exceeds 1.0x ATR and comprises >50% of the total candle range. These represent rapid rejections or absorption events.
Kill Zone Liquidity: Tracks the high/low range during specific ICT-defined sessions (Asian: 19:00-00:00 NY, London: 02:00-05:00 NY, NY AM: 09:30-11:00 NY). At session close, BSL and SSL zones are created above/below the session range.
Change of Character (ChoCH) & Break of Structure (BoS)
ChoCH is detected when price breaks counter to the established structure (bearish structure broken upward = bullish ChoCH; bullish structure broken downward = bearish ChoCH). BoS occurs when price breaks in the direction of the established trend (bearish structure breaking lower = bearish BoS; bullish structure breaking higher = bullish BoS).
Trade Calculations
Stop Loss and Take Profit levels are calculated based on the entry position within the Fibonacci zone structure:
* Premium entries (0.786-1.0 for shorts / 0.0-0.214 for longs): SL at 1.118/-0.118 extension, TP structure weighted toward zone extremes
* Golden entries (0.618-0.786 for shorts / 0.214-0.382 for longs): SL at 1.0/0.0 boundary, TP structure balanced across range
Risk-to-reward ratios are calculated as blended values across all three take profit levels, weighted by position quantity splits.
Reference Level Calculations
* Pivot Points: Standard formula using previous day's high, low, and close: PP = (H + L + C) / 3
* Support/Resistance: R1 = 2×PP - L, S1 = 2×PP - H, with R2/S2 and R3/S3 calculated using range extensions
* ADR: 14-period simple moving average of daily high-low range, projected from current day's extremes
Momentum Analysis
EMA 14 and EMA 21 use standard exponential moving average calculations. Crossovers are detected when EMA 14 crosses EMA 21 within user-defined discount zones, with directional confirmation (cross under in bearish discount = short signal; cross over in bullish discount = long signal).
Why This Integration Matters
While components like EMA crossovers, pivot detection, or Fibonacci retracements exist as separate indicators, this system provides:
1. Coordinated Analysis : All components reference the same structural framework (user-defined trading zone)
2. Automated Mitigation Tracking : Imbalances are monitored continuously and removed when mitigated according to ICT principles
3. Contextual Alerts : Notifications are triggered only when conditions align within the defined structural context
4. Trade Parameter Automation : Stop loss and take profit calculations adjust dynamically based on entry positioning within the structure
5. Consistent Visual Display : All elements use a unified color scheme, labeling system, and z-order layering. This eliminates visual conflicts that occur when stacking multiple independent indicators (overlapping lines, label collisions, inconsistent transparency levels, conflicting color schemes).
This consolidation reduces the need to manually coordinate 8-10 separate indicators, eliminates redundant calculations across disconnected tools, and maintains visual clarity even when all components are displayed simultaneously.
-----------------------------------------------------------------
Disclaimer
1. Indicator Functionality and Purpose
This indicator is solely a technical analysis tool built upon established methodologies (Smart Money Concepts/ICT) and statistical calculations (Pivots, Fibonacci, EMAs). It is designed to assist experienced traders in visualizing complex data, streamlining the analytical workflow, and automating conditional alerting.
The indicator is NOT:
♦ Financial Advice: It does not provide personalized investment recommendations, solicited advice, or instruction on buying, selling, or holding any financial instrument.
♦ A Guarantee of Profit: The presence of a signal, alert, or trade plan output by this tool does not guarantee that any trade will be profitable.
♦ A Predictor of Future Prices: The tool calculates probabilities and potential scenarios based on historical data and current structure; it does not predict future market movements.
2. General Trading Risks and Capital Loss
♦ All trading involves substantial risk of loss. You may lose some or all of your initial capital. Leveraged products, such as futures, CFDs, and margin trading, carry a high degree of risk and are not suitable for all investors.
♦ Risk Acknowledgment: By using this indicator, you acknowledge and accept that you are solely responsible for all trading decisions, and you bear the full risk of any resulting profit or loss.
♦ Risk Management is Crucial: This indicator is an analytical tool only. You must employ independent risk management techniques (position sizing, stop-loss orders) tailored to your personal financial situation and risk tolerance.
3. Calculation Limitations and Non-Real-Time Data
The calculations performed by this indicator are based on the data provided by your charting platform (e.g., TradingView).
♦ Data Accuracy: The accuracy of the outputs (e.g., Price Delivery Arrays, Pivots, P&L projections) is dependent on the accuracy and real-time nature of the underlying market data feed.
♦ Latencies: Trade alerts and signals may be subject to minor delays due to server processing, internet connectivity, or charting platform performance. Do not rely solely on alerts for execution.
♦ Backtesting and Performance: Any depiction of past performance, including data visible on the chart, is not indicative of future results. Trading results will vary based on market conditions, liquidity, and execution speed.
4. Software and Platform Disclaimer
"As Is" Basis: The indicator is provided on an "as is" basis without warranties of any kind, whether express or implied. The author does not guarantee the script will be error-free or operate without interruption.
Third-Party Integration: This indicator is not affiliated with, endorsed by, or connected to TradingView, 3Commas, or any other broker or execution platform. All third-party names are trademarks of their respective owners. The formatting of the Trade Summary Table for 3Commas is for user convenience only.
5. Required Competency (User Responsibility)
This indicator is built on the assumption that the user is an experienced trader with a working understanding of the complex concepts being visualized (ICT/SMC, FVG, Order Blocks, Liquidity, etc.). The indicator does not teach these concepts.
You Must Always Do Your Own Research (DYOR) before making any trading decision based on signals or visualization provided by this tool.
By installing and using this indicator, you explicitly agree to these terms and assume full responsibility for all trading activity.

Livermore's Pyramiding Trading - 3Commas [SwissAlgo]
📊 J. LIVERMORE'S PYRAMIDING TRADING - 3Commas Integrated
A Trading Approach Inspired by Jesse Livermore's Position Building Principles
━━━━━━━━━━━━━━━━━━━━━━━━━━━━━━━━━━━━━━━━━━━
DISCLAIMER
This indicator is an educational tool based on historical trading principles. Past performance is not indicative of future results. Trading involves substantial risk of loss. Only trade with capital you can afford to lose. You are responsible for all trading decisions.
━━━━━━━━━━━━━━━━━━━━━━━━━━━━━━━━━━━━━━━━━━━
📚 WHO WAS JESSE LIVERMORE?
Jesse Livermore (1877-1940) was one of the greatest traders in history.
His core insight: "Most traders do everything backward."
♦ "They deploy all capital at once" → Livermore entered with a small fraction of his capital (he started with a 'test position' to validate his trade idea and waited for market confirmation to deploy more, building positions in steps = "pyramiding")
♦ "They average down" (DCA) → Livermore added to trades showing good results only, and never to losing trades, as the trend kept aligning with his trade idea
♦ "They use arbitrary % stops" → Livermore exited when structure appeared broken (he trailed his stop loss to try to protect unrealized profit - if any)
♦ "They take profits too early or set arbitrary TP%" → Livermore let trades showing positive results run until proven wrong (trial take profit)
💬 "I always made money when I was sure I was right before I began. What beat me was not having enough brains to stick to my own game."
— Jesse Livermore
This indicator tries to translate his principles into a SYSTEMATIC FRAMEWORK :
BO = Base Order (first order, base of the pyramid)
PO = Pyramid Orders (additional layers of capital deployed as long as the 'tape' does not invalidate the trade idea)
♦ Test First (BO - 20%) - Small entry to test your idea. If wrong, lose small. If right, can consider pyramiding into strength.
♦ Build Position Size (PO1-3 - 80%) - Add only as trend unfolds favorably (the indicator uses specific Fibonacci levels to track milestones - 0.618, 1.0, 1.272 - and looks for strong confluence among price, volume, trend, momentum, break of resistance/support levels to suggest and trigger actions: entries, exit)
♦ Attempt to Protect Capital - Dynamic stops: the indicator trails the stop loss, to try to protect potential gains from previous steps (if any)
♦ Discipline - Trades fire only when ALL conditions align
━━━━━━━━━━━━━━━━━━━━━━━━━━━━━━━━━━━━━━━━━━━
🎯 INDICATOR FEATURES
You map 3 points on the chart → The indicator generates a systematic trading plan structure based on your wave analysis.
✓ Auto-detects trade direction: Uptrend wave (A➚B➘C) = Long signals | Downtrend wave (A➘B➚C) = Short signals
✓ Entry/exit prices: BO, PO1, PO2, PO3, and dynamic EXIT (trailing stop)
✓ Real-time condition monitoring: Live ✓/✗ checks for each order (price closes + volume + trend + pivot breaks + candle quality + sequence)
✓ Visual trade execution: Green labels mark entries (BO/PO1/PO2/PO3), red labels mark EXIT
✓ Optional 3Commas automation: JSON webhooks for hands-free execution via Signal Bots
⏰ Recommended Timeframes: 1H, 4H, Daily
(Lower timeframes like 15m/5m produce excessive noise and false signals)
💬 "Watch the market leaders, the stocks that have led the charge. That is where the action is and where the money is made."
— Jesse Livermore
━━━━━━━━━━━━━━━━━━━━━━━━━━━━━━━━━━━━━━━━━━━
⚙️ SETUP IN 3 STEPS
🟡 STEP 1: Map Your Wave (Points A → B → C)
Identify a completed wave pattern:
For LONGS:
♦ Point A = Swing low (wave start)
♦ Point B = Swing high (impulse end)
♦ Point C = Pullback low (retrace end - where next wave may begin)
For SHORTS:
♦ Point A = Swing high (wave start)
♦ Point B = Swing low (impulse end)
♦ Point C = Pullback high (retrace end - where next wave may begin)
How to set points:
Settings → Enter dates manually OR drag the vertical lines directly on the chart (easier - just click and drag the pre-mapped A/B/C lines)
Requirements (auto-validated by code):
✓ All dates must be in the past (Point C = completed retrace, not forming)
✓ Clear impulse A→B (minimum 5% move)
✓ Clear retrace B→C (minimum 3% pullback)
───────────────────────────────────────────
🟡 STEP 2: Set Budget & Allocation
Settings → "TRADE PARAMETERS"
♦ Total Budget: $10,000 (example - capital for THIS trade only, not your entire account)
♦ Allocation (must total 100%):
BO = 20% ($2,000) - test position
PO1 = 25% ($2,500) @ Fib 0.618
PO2 = 30% ($3,000) @ Fib 1.0
PO3 = 25% ($2,500) @ Fib 1.272
💬 "It was never my thinking that made big money for me. It was always my sitting. Men who can both be right and sit tight are uncommon."
— Jesse Livermore
───────────────────────────────────────────
🟡 STEP 3: Monitor Your Trade Plan Table
The table (top-right corner) has 4 sections that guide your execution:
BUDGET DEPLOYMENT
♦ Trigger prices for each order (BO auto-calculated at 0.5 Fib between B-C)
♦ Dollar amount per entry
♦ Fibonacci level assigned to each PO
ENTRY/EXIT CONDITIONS
Each column (BO, PO1, PO2, PO3) shows live status (✓ or ✗) for:
♦ Price: 2 consecutive closes (BO) | 3 consecutive closes (POs)
♦ Volume: OBV directional alignment OR volume spike above average
♦ Trend: Normal or Strong Bull/Bear (no entries in Uncertain trend)
♦ Pivot: Nearest resistance (longs) or support (shorts) broken
♦ Clean Candle: Momentum without reversal wicks <30% (POs only)
♦ Sequence: Prior order must have fired first (POs only - no skipping levels)
TRIGGERED?
Shows execution status for each order (✓ = fired, ✗ = waiting)
If using 3Commas: ✓ confirms JSON alert was sent to your bot for real execution
VALIDATIONS
✓ Green = All checks passed, setup is valid
⚠️ Yellow = Warning (e.g., budget doesn't equal 100%, deep retrace)
✗ Red = Error (e.g., dates in wrong order, invalid wave structure)
⚠️ Wait for ALL ✓✓✓✓✓ (or ✓✓✓✓✓✓) to align in a column before that order fires at bar close
💬 "The game of speculation is the most uniformly fascinating game in the world. But it is not a game for the stupid, the mentally lazy, the person of inferior emotional balance, or the get-rich-quick adventurer."
— Jesse Livermore
━━━━━━━━━━━━━━━━━━━━━━━━━━━━━━━━━━━━━━━━━━━
📊 CHART VISUALS - READING THE INDICATOR
Fibonacci Extension Lines
After mapping A-B-C, horizontal lines extend to the right:
♦ Solid green/red lines = Active PO entry levels (0.618, 1.0, 1.272)
♦ Dotted gray lines = Reference Fib levels used for exit tracking (2.0, 2.618, 3.0, etc.)
♦ Labels on right = Show level and price: "Fib 0.618 / $67,324 "
Entry/Exit Price Lines
♦ Thick green line (longs) / red line (shorts) = BO entry price with direction label
♦ Dashed red line = Current EXIT price (your trailing stop loss - appears after BO fires and moves as price extends)
Trade Execution Labels
Visual confirmation when orders fire on the chart:
♦ Green labels (below/above candles) = BO, PO1, PO2, PO3 entries executed
♦ Red label = EXIT triggered (position closed)
Trend Strength Indicator (EMA Line)
The thick colored line shows real-time trend status:
♦ Bright lime = Strong bullish trend
♦ Light green = Normal bullish trend
♦ Bright red = Strong bearish trend
♦ Light red = Normal bearish trend
♦ Gray = Uncertain/weak trend (no entries fire in this state)
Entries require at least Normal trend strength aligned with your trade direction.
💬 "I never argue with the tape. Getting sore at the market doesn't get you anywhere."
— Jesse Livermore
━━━━━━━━━━━━━━━━━━━━━━━━━━━━━━━━━━━━━━━━━━━
🔧 ENTRY LOGIC - TECHNICAL DETAILS
💬 "The big money was never made in the buying or the selling. The big money was made in the waiting."
— Jesse Livermore
───────────────────────────────────────────
🟢 BASE ORDER (BO) - TEST POSITION
BO Price Calculation
Auto-calculated at the 0.5 Fibonacci retracement between Point B and Point C
Formula: (Price B + Price C) / 2
Why this level?
♦ Midpoint between impulse end (B) and retrace end (C)
♦ Breakout above/below suggests retrace may be complete
♦ Designed to help position BO below all Fib extensions (to control sequence issues)
───────────────────────────────────────────
BO Entry Conditions - ALL 5 Must Align:
1️⃣ PRICE: 2 Consecutive Closes Beyond BO
♦ Longs: close > BO AND close > BO
♦ Shorts: close < BO AND close < BO
♦ Why: Designed to confirm breakout commitment and filter fakeouts
2️⃣ TREND: Normal OR Strong Trend Aligned
♦ Detection: 18-period EMA + ADX/DMI + higher timeframe slope
♦ States: Strong Bull/Bear (ADX>30), Normal Bull/Bear (price vs EMA), Uncertain
♦ Confirmation: Requires 3 consecutive bars in the same state (to reduce flip-flop)
♦ BO accepts: Normal OR Strong (you're testing early, basic alignment sufficient)
3️⃣ PIVOT: Nearest Resistance/Support Broken
♦ Storage: 60 most recent pivot highs/lows (dynamic lookback per timeframe)
♦ Longs: Nearest pivot HIGH above BO → must break with 2 closes
♦ Shorts: Nearest pivot LOW below BO → must break with 2 closes
♦ Price Discovery: If no pivot exists beyond BO = auto-pass
♦ Why: Aims to confirm momentum has overcome previous rejection zones
4️⃣ VOLUME: OBV Aligned OR Spike
♦ Directional OBV: OBV > 20-EMA (longs) OR OBV < 20-EMA (shorts)
♦ OR Volume Spike: Current volume > 20-period SMA
♦ Why: Checks for institutional participation signals
5️⃣ VALIDATIONS: Setup Valid (✅)
♦ Dates valid (A < B < C, all in past)
♦ Wave structure valid (min 5% impulse, min 3% retrace)
♦ Budget allocation = 100%
♦ Prices detected at all points
⚠️ BO fires once per bar close. Flag set permanently until trade resets.
───────────────────────────────────────────
🔺 PYRAMID ORDERS (PO1-3) - PYRAMIDING INTO STRENGTH
💬 "Never buy a stock because it has had a big decline from its previous high. The big money was never made in the stock market by buying on declines."
— Jesse Livermore
PO Price Calculation
Fixed Fibonacci extensions from Point C:
Formula: Price C ± (Impulse Range × Fib Level)
Where: Impulse Range = |Price B - Price A|
Default Levels:
♦ PO1 @ Fib 0.618 (Golden Ratio)
♦ PO2 @ Fib 1.000 (Full impulse repeat)
♦ PO3 @ Fib 1.272 (Fibonacci sequence extension)
───────────────────────────────────────────
PO Entry Conditions - ALL 6 Must Align (STRICTER):
1️⃣ PRICE: 3 Consecutive Closes Beyond PO
♦ Longs: close > PO AND close > PO AND close > PO
♦ Shorts: close < PO AND close < PO AND close < PO
♦ Why: Higher conviction needed when adding capital (3 vs 2 closes for BO)
2️⃣ TREND: Same as BO
Normal OR Strong trend must remain aligned with trade direction
3️⃣ PIVOT: Per-Level Pivot Break
♦ Each PO checks its OWN nearest pivot (not shared with BO)
♦ Same 2-close break requirement
♦ PO3 Exception: Price discovery allowed (no pivot required if already profitable)
4️⃣ VOLUME: Same as BO
Sustained confirmation required (not weakening)
5️⃣ CLEAN CANDLE: <30% Reversal Wick (NEW)
♦ Filter: Uses ATR(14) - candles < ATR auto-pass (consolidation noise)
♦ Longs: Upper wick < 30% of candle range (no rejection at top)
♦ Shorts: Lower wick < 30% of candle range (no rejection at bottom)
♦ Why: Don't pyramid into weakness/rejection - only add on clean momentum
♦ Not checked for BO: Test position tolerates some wick risk
6️⃣ SEQUENCE: Prior Order Fired
♦ PO1 requires: BO fired
♦ PO2 requires: PO1 fired
♦ PO3 requires: PO2 fired
♦ Why: No skipping levels - disciplined building only
───────────────────────────────────────────
⚙️ KEY DIFFERENCE:
BO (20% capital) = Lighter requirements, testing your idea early
POs (80% capital) = Stricter requirements, adding only to confirmed winners
♦ BO: 2 closes | POs: 3 closes
♦ BO: No candle check | POs: Clean candle required
♦ BO: Independent | POs: Sequential (must follow order)
♦ BO: No price discovery | PO3: Allows price discovery when profitable
💬 "Profits always take care of themselves, but losses never do. The speculator has to ensure himself against considerable losses by taking the first small loss."
— Jesse Livermore
━━━━━━━━━━━━━━━━━━━━━━━━━━━━━━━━━━━━━━━━━━━
🚪 EXIT LOGIC - TECHNICAL DETAILS
🔴 EXIT PHILOSOPHY
The indicator uses TWO INDEPENDENT EXIT TRIGGERS (whichever fires first):
1) Structural Breakdown
Price breaks through the EXIT level with confirmation
2) Trend Reversal
Trend flips against your position AND price breaks EXIT level
Why two methods?
♦ Structure = price-based protection (hard stop)
♦ Trend = momentum-based exit (early warning when market character changes)
♦ Combined: Exit either when proven wrong (structure) or when conditions no longer favor your direction (trend)
───────────────────────────────────────────
🔴 EXIT PRICE CALCULATION
The EXIT price (your stop loss) adjusts dynamically based on position size:
BEFORE PO3 Fires (Fixed Stops):
♦ BO only = Stop at Point C (small position, tight stop near entry)
♦ PO1 fired = Stop at Fib 0.5 (moved to breakeven zone)
♦ PO2 fired = Stop at Fib 0.786 (protecting partial profits)
AFTER PO3 Fires (Trailing Stops):
♦ Tracking: Monitors the highest Fib reached (longs) or the lowest Fib reached (shorts)
♦ Placement: EXIT moves 1-2 Fib levels below the highest (longs) or above the lowest (shorts)
♦ Example: Price reaches Fib 2.618 → EXIT trails up to Fib 2.0
♦ Purpose: Designed to protect accumulated profits while allowing room for normal pullbacks
💬 "It never was my thinking that made the big money for me. It was always my sitting. Men who can both be right and sit tight are uncommon."
— Jesse Livermore
───────────────────────────────────────────
🔴 EXIT CONDITIONS
Exit Speed (Based on Risk Exposure):
♦ Full position (PO3 fired) = 1 close required (fast exit - more capital at risk)
♦ Partial position (BO/PO1/PO2 only) = 2 closes required (confirmation - less urgency)
METHOD 1: Structural Breakdown
Price violates the EXIT level with clean momentum:
For Longs:
♦ Price closes BELOW EXIT level (1 or 2 closes depending on position size)
♦ Clean candle required (lower wick < 50% of range - no false breakdown)
For Shorts:
♦ Price closes ABOVE EXIT level (1 or 2 closes depending on position size)
♦ Clean candle required (upper wick < 50% of range - no false breakout)
Why clean candle check?
Designed to reduce exits on wicks/fakeouts. If there's a large reversal wick (>50%), it suggests buyers/sellers are defending the level - not a true breakdown.
METHOD 2: Trend Reversal
Market character shifts against your position:
For Longs:
♦ Trend shifts from Bull → Normal Bear OR Strong Bear
♦ AND price breaks below EXIT level (same close requirements)
For Shorts:
♦ Trend shifts from Bear → Normal Bull OR Strong Bull
♦ AND price breaks above EXIT level (same close requirements)
Why this matters?
♦ Proactive exit before structural stop is hit
♦ If the trend that confirmed your entries reverses, the setup is invalidated
♦ Livermore principle: Exit when market proves you wrong, don't wait for max pain
───────────────────────────────────────────
⚠️ EXIT BEHAVIOR
♦ Fires once per bar close (same as entries)
♦ Resets all tracking after exit (ready for fresh trade setup)
♦ Clears flags: boSignalFired, po1/po2/po3SignalFired, highestFib/lowestFib tracking
♦ If using 3Commas: Sends exit_long or exit_short JSON (market order closes 100% position)
💬 "I never argue with the tape. Getting sore at the market doesn't get you anywhere."
— Jesse Livermore
━━━━━━━━━━━━━━━━━━━━━━━━━━━━━━━━━━━━━━━━━━━
🤖 3COMMAS AUTOMATION (OPTIONAL)
💬 "There is the plain fool, who does the wrong thing at all times everywhere, but there is also the Wall Street fool, who thinks he must trade all the time."
— Jesse Livermore
Automation designed to help remove emotion and support disciplined execution.
───────────────────────────────────────────
⚡ QUICK SETUP IN 5 STEPS
STEP 1: Create Your Signal Bots
You need 2 SEPARATE BOTS (one for Longs, one for Shorts):
Go to 3Commas → Bots → Create Bot → Select "Signal Bot"
Basic Settings:
♦ Bot Name: "Livermore Long - " (example: "Livermore Long - BTCUSDT")
♦ Exchange: Your connected exchange
♦ Trading Pair: Must match TradingView chart exactly
♦ Strategy: Custom Signal
♦ Direction: LONG (for first bot) or SHORT (for second bot)
♦ Max Active Deals: 1
⚠️ CRITICAL SETTINGS:
Entry Orders:
♦ Toggle ON: "Entry Orders"
♦ Volume per Order: "Send in webhook, quote"
♦ Why: This lets the indicator control exact $ amounts per order (BO=$2K, PO1=$2.5K, etc.)
♦ If you skip this: Orders will use wrong sizes and break your allocation plan
Exit Orders:
♦ Toggle ON: "Exit Orders"
♦ Volume per Order: "100 Position %"
♦ Why: Closes your entire position when EXIT signal fires
♦ Toggle OFF: "Take Profit" (managed by indicator)
♦ Toggle OFF: "Stop Loss" (managed by indicator)
Click "Start Bot" for both Long and Short bots.
───────────────────────────────────────────
STEP 2: Get Your Bot Credentials
For EACH BOT (Long and Short):
♦ Open the bot → Click "Orders" tab
♦ Scroll down to "Webhook Messages" section
♦ Copy these 3 values:
bot_uuid (long string like: a362cbcf-7e68-4379-a83d-ae6e47dba656)
secret (very long token starting with: eyJhbGciOiJ...)
webhook URL (refer to 3commas to get exact webhook - signal bots)
Note: The secret is usually the same for both bots, but the bot_uuid is different.
───────────────────────────────────────────
STEP 3: Enter Credentials in Indicator
Back in TradingView:
♦ Open indicator Settings
♦ Find section: "1️⃣ INTEGRATE 3COMMAS"
♦ Paste:
Long = Your Long bot UUID
Short = Your Short bot UUID
Secret = Your secret token (same for both)
♦ Click "OK"
The indicator now has everything needed to build JSON payloads.
───────────────────────────────────────────
STEP 4: Create TradingView Alert
This alert bridges TradingView → 3Commas. ONE ALERT HANDLES ALL SIGNALS (BO, PO1, PO2, PO3, EXIT).
How to create:
♦ Right-click chart → "Add Alert" (or click clock icon)
♦ Condition: Select this indicator from dropdown
♦ Trigger: "Any alert() function call"
♦ Alert Name: "Livermore Pyramiding - "
♦ Message: Leave default (indicator sends its own JSON)
♦ Webhook URL: Paste your 3Commas webhook URL from Step 2
♦ ⚠️ Alert Frequency: "Once Per Bar Close" (CRITICAL - controls duplicate orders)
♦ Expiration: Open-ended (or set specific date)
♦ Click "Create"
───────────────────────────────────────────
STEP 5: Test Before Going Live
🧪 NEVER TEST WITH REAL CAPITAL FIRST. Use one of these methods:
Test 1: Check Bot Status
♦ 3Commas → Bots → Both bots show "Active" (green)
♦ Click into each bot → Orders tab → Should say "Waiting for signal"
Test 2: Verify Alert Active
♦ TradingView → Alerts panel (bell icon)
♦ Your alert should show "Active" status
Test 3: Paper Trade / Tiny Position
♦ Use 3Commas paper mode if available, OR
♦ Set Total Budget to $10-50 for first real test
♦ Map a wave that's about to trigger
♦ Watch if orders actually appear on 3Commas
Test 4: Check JSON Format
♦ When alert fires → TradingView Alerts → Click your alert
♦ Look at "History" or "Log"
♦ Verify JSON has: bot_uuid, secret, action, price, amount
───────────────────────────────────────────
🛠️ COMMON ISSUES & SOLUTIONS
✗ Problem: Orders not appearing on 3Commas
Possible causes:
♦ Wrong webhook URL → Must be exact 3Commas URL (check for typos)
♦ Bot paused → Check bot status must be "Active" (green)
♦ Wrong bot UUID → Verify you copied Long UUID for longs, Short UUID for shorts
♦ Secret mismatch → Double-check secret is correct
♦ Exchange API issues → Verify exchange connection in 3Commas settings
How to debug:
♦ 3Commas → Your Signal Bot → Orders tab
♦ Look for "Rejected Signals" section
♦ Should show error messages if webhook failed
───────────────────────────────────────────
✗ Problem: Orders executing at wrong prices
Possible causes:
♦ Limit order not filled → Price gapped through your level before order filled
♦ Slippage on exits → Exits use market orders (intentional - speed over exact price)
♦ Exchange minimums → Some exchanges have minimum order sizes
Solution:
♦ Entries use limit orders (wait for exact price - may not fill if price gaps)
♦ Exits use market orders (prioritize fast execution when structure breaks)
♦ This is INTENTIONAL DESIGN following Livermore's principle: exit when proven wrong
───────────────────────────────────────────
✗ Problem: PO orders firing out of sequence or skipping
Possible causes:
♦ Alert not set to "Once Per Bar Close" → Change alert frequency setting
♦ Multiple alerts running → Delete old/duplicate alerts for this indicator
♦ Conditions changed mid-bar → Indicator only fires at bar close (protective feature)
Solution:
♦ Keep only 1 active alert per indicator instance
♦ Always use "Once Per Bar Close" frequency
♦ Wait for full bar to close before signals can fire
───────────────────────────────────────────
✗ Problem: Bot not closing position on EXIT
Possible causes:
♦ Exit order setting wrong → Check bot settings
♦ Wrong JSON action → Should be "exit_long" or "exit_short"
♦ No position open → Can't close what doesn't exist
Solution:
♦ Verify: Bot Settings → Exit Orders → Volume per Order = "100 Position %"
♦ Check alert history for correct JSON payload
♦ If stuck: Manually close position in 3Commas, then fix settings
♦ Delete and recreate alert if JSON format is wrong
───────────────────────────────────────────
🔒 SECURITY BEST PRACTICES
♦ Never share bot UUID or Secret - Treat them like passwords
♦ Use restricted API keys - Limit to specific pairs, disable withdrawals
♦ Start small - Test with $10-50 first, scale up only after success
♦ Monitor first trades - Don't set-and-forget immediately
♦ Delete old alerts - If you change A/B/C points, delete old alert and create new one
───────────────────────────────────────────
📊 PREFER MANUAL TRADING?
Skip 3Commas entirely and use the indicator for planning only:
♦ Watch Trade Plan table for ✓✓✓✓✓ alignment
♦ Manually place limit orders at displayed prices
♦ Manually move stop loss as EXIT price updates
♦ Manually close when EXIT signal fires
Benefits: Full control, no API concerns, can override based on context
Drawbacks: Must watch chart constantly, emotions can interfere, may miss signals
───────────────────────────────────────────
✅ FINAL CHECKLIST BEFORE LIVE TRADING
✓ Both Signal Bots created (Long + Short)
✓ Entry Orders: Volume = "Send in webhook, quote"
✓ Exit Orders: Volume = "100 Position %"
✓ Take Profit and Stop Loss disabled in bots
✓ Bot UUIDs and Secret entered in indicator
✓ TradingView alert created with correct webhook
✓ Alert frequency = "Once Per Bar Close"
✓ Alert status shows "Active"
✓ Tested with small amounts successfully
✓ Trade Plan table shows ✅ (no validation errors)
✓ Understand your risk per trade
Once all checked: You're ready for automated pyramiding execution.
━━━━━━━━━━━━━━━━━━━━━━━━━━━━━━━━━━━━━━━━━━━
💡 KEY REMINDERS - BEFORE YOU TRADE
💬 "The speculator's chief enemies are always boring from within. It is inseparable from human nature to hope and to fear."
— Jesse Livermore
───────────────────────────────────────────
⚠️ COMMON MISTAKES (AVOID THESE)
Mapping Incomplete Waves
♦ Point C must be in the PAST (completed retrace, not currently forming)
♦ Don't map a wave that's still developing - wait for confirmation
♦ Minimum requirements: 5% impulse (A→B), 3% retrace (B→C)
Ignoring Validation Warnings
♦ Never create alerts when status shows ✗ (red) or ⚠️ (yellow)
♦ Fix all errors first: dates in order, budget = 100%, valid wave structure
♦ Common issues: dates in future, Point C above B (longs) or below B (shorts)
Premature Manual Entries
♦ Don't enter just because price touched the level
♦ Wait for ALL ✓✓✓✓✓ (or ✓✓✓✓✓✓) to align in Trade Plan table
♦ Patience pays - partial confluence = partial edge = higher risk of losing trades
Wrong Timeframe Selection
♦ Avoid: 15m, 5m, 1m (too much noise, false signals)
♦ Use: 1H, 4H, Daily (cleaner structure, better confluence)
♦ Lower timeframes require faster decisions and produce more whipsaws
Over-Risking Capital
♦ Trade budget ≠ Account size
♦ Never risk capital you can't afford to lose
♦ One bad trade should NOT destroy your account
───────────────────────────────────────────
✅ LIVERMORE PRINCIPLES IN ACTION
Confirmation > Prediction
♦ Don't predict where price will go
♦ Wait for price to INDICATE direction via pivots + volume + trend
♦ Test first (BO 20%), build only when confirmed (POs 80%)
💬 "A man must believe in himself and his judgment if he expects to make a living at this game."
Pyramid on Strength, Never Weakness
♦ Add only when: 3 closes + clean candles + volume + pivot breaks
♦ Never average down (DCA into losers)
♦ If BO wrong, take small loss fast - don't hope and add more
💬 "Never buy a stock because it has had a big decline from its previous high."
Respect Market Structure
♦ Pivots = where smart money previously acted (support/resistance)
♦ Breaking them = momentum overcoming barriers
♦ Entering before pivot break = entering into known rejection zones
Trend is Your Friend
♦ Never pyramid against the trend
♦ If trend shifts to Uncertain or reverses → no new entries
♦ Exit when trend proves you wrong (don't fight it)
💬 "I never argue with the tape. Getting sore at the market doesn't get you anywhere."
Discipline > Emotion
♦ Can't "almost" have all conditions met
♦ Either 100% aligned (all ✓) or you wait
♦ No exceptions, no "this time is different"
♦ Automation designed to help remove emotion - consider using 3Commas
💬 "It never was my thinking that made the big money for me. It always was my sitting."
───────────────────────────────────────────
🎯 FINAL THOUGHT
This indicator is a SYSTEMATIC FRAMEWORK, not a magic solution. It translates Livermore's century-old principles into actionable rules:
♦ Test small, build big
♦ Add to winners, cut losers fast
♦ Let structure guide exits
♦ Stay disciplined when emotions scream
The market will test your patience, discipline, and conviction. The indicator aims to reduce guesswork - but YOU still need to:
♦ Find valid wave structures
♦ Choose appropriate market conditions
♦ Size positions properly
♦ Accept losses as part of the game
💬 "The game of speculation is the most uniformly fascinating game in the world. But it is not a game for the stupid, the mentally lazy, the person of inferior emotional balance, or the get-rich-quick adventurer."
— Jesse Livermore

Altcoins Exit Executor: 3Commas-Integrated [SwissAlgo]Title: Altcoins Exit Executor: 3Commas-Integrated
Plan and Execute your Altcoins Exits via 3Commas Integration
------------------------------------------------------------------
1. Facing These Struggles?
You're holding a portfolio of altcoins, and the question keeps nagging you: when should you exit? how?
If you're like many crypto traders, you might recognize these familiar struggles:
The Planning Problem : You know you should have an exit strategy, but every time you sit down to plan it, you get overwhelmed. Should you sell at 2x? 5x? What about that resistance level you spotted last month? You end up postponing the decision again and again.
The Execution Headache : You use 3Commas (or an Exchange directly) for your trades, but setting up Smart Trades for multiple coins means endless manual data entry. Price levels, percentages, quantities - by the time you finish entering everything, the market may have already moved.
The Portfolio Scale Problem : Managing 5 altcoins is challenging enough, but what about 15? Or 30? The complexity grows exponentially with each additional position. What started as a manageable analysis for a few coins becomes an overwhelming juggling act that may lead to rushed decisions or complete paralysis.
The Consistency Challenge : You approach each coin differently. Maybe you're conservative with one position and aggressive with another, without any systematic reasoning. Your portfolio becomes a patchwork of random decisions rather than a coherent strategy. With dozens of positions, maintaining any consistent approach becomes nearly impossible.
The "What If" Anxiety : What happens if the market crashes while you're sleeping? You know you should have stop-losses, but setting them up properly across multiple positions feels overwhelming. The more coins you hold, the more potential failure points you need to monitor.
The Information Overload : You collect multiple data points, but how do you synthesize all this information into actionable exit points? Multiply this analysis across 20+ different altcoins, and the task becomes nearly impossible to execute consistently.
This indicator may help address these challenges by providing you with:
A systematic approach to analyzing potential resistance levels across multiple technical frameworks. All potential resistances (including Fibonacci levels) are calculated automatically
Tools to structure your exit plan with clear take-profit levels and position sizing
Automated generation of 3Commas 'Smart Trades' that match your exit strategy exactly, without manual entry
Optional emergency exit protection that could potentially guard against sudden market reversals (exit managed within the 3Commas 'Smart Trade' itself)
A consistent methodology you can apply across your entire altcoin portfolio, regardless of size
The goal is to transform exit planning from a source of stress and procrastination into a structured, repeatable process that may help you execute your trading plan in a consistent fashion, whether you're managing 3 coins or 30.
------------------------------------------------------------------
2. Is this for You?
This indicator is designed for cryptocurrency traders who:
Hold a portfolio of multiple altcoins (typically 5+ positions)
Are actively seeking a systematic solution to plan and execute exit strategies
Have an active 3Commas account connected to their exchange
Understand 3Commas basics: Smart Trades, API connections, and account management
Have an account tier that supports their portfolio size (3Commas Free Plan: up to 3 trades/alts, Pro Plan: up to 50+ trades/alts)
Important: This tool provides analysis and automation assistance, not trading advice. All exit decisions require your individual judgment and proper risk management.
If you don't use 3Commas, you may still find value in the resistance analysis components, though the automated execution features require a 3Commas account and basic platform knowledge.
------------------------------------------------------------------
3. How does it work?
This indicator streamlines your exit planning process into four steps:
Step 1: Analyze Your Coin & Define Exit Plan
The indicator automatically calculates multiple types of resistance levels that may act as potential exit points:
Fibonacci Extensions (projected resistance from recent price swings)
Fibonacci Retracements (resistance from previous cycle highs)
Major Pivot Highs (historical price rejection points)
Volume Imbalances (PVSRA analysis showing institutional activity zones)
Price Multipliers (2x, 3x, 4x, 5x psychological levels)
Market Trend Analysis (bull/bear market strength assessment)
You can view all resistance types together or focus on specific categories to identify potential exit zones.
Step 2: Enter Your Exit Plan.
Define your sequential take-profit strategy:
Set up to 5 take-profit levels with specific prices
Assign percentage of coins to sell at each level
Add your total coin quantity and average entry price
Optionally enable emergency exit (stop-loss) protection. The indicator validates your plan in real-time, ensuring percentages sum to 100% and prices follow logical sequences.
Step 3: Connect with 3Commas
Relay Secret
3Commas API keys (Public and Private)
Account ID (your exchange account on 3Commas)
Step 4: Generate Smart Trade on 3Commas
Create a TradingView alert that automatically:
Sends your complete exit plan to 3Commas
Creates a Smart Trade with all your take-profit levels
Includes stop-loss protection if enabled
Requires no manual data entry on the 3Commas platform
The entire process is designed to streamline the time required to move from analysis to execution, providing a standardized methodology across your altcoin positions.
User Experience Features:
Step-by-step guided workflow
Interactive submission helper with status tracking
Exit plan table with detailed projections
Comprehensive legend and educational tooltips
Dark/light theme compatibility
Organized visual presentation of all resistance levels
------------------------------------------------------------------
4. Using the Indicator
Complete the 4-step guided workflow within the indicator to set up an Exit Plan and submit it to 3Commas.
At the end of the process, you will see a Smart Trade created on 3Commas reflecting your custom Exit Plan (inclusive of Stop Loss, if enabled).
Recommended Settings
Analyze your Exit Plan on the 1-Day timeframe
Use the Tradingview's Dark-Theme for high visual contrast
Set candles to 'Bar-Type' to view volumr-based candle colors (PVSRA analysis)
Use desktop for full content visibility
Analyzing Resistance Levels
Enable "Show all Resistance Levels" to view comprehensive analysis across your chart
Focus on resistance clusters where multiple resistance seem to converge - these may indicate stronger potential exit zones
Note the color-coded system: gray lines indicate closer levels, red lines suggest stronger resistance or potentially "out-of-reach" targets
Pay attention to the Golden Zone (Fibonacci 0.618-0.786 area) highlighted in green, it might act as a significant price magnet for average altcoins
Decide how many Take Profit Steps to use (min. 1 - max- 5)
Setting up your Plan
Enter the total number of coins you want to sell with the script
Enter your average entry price, if known (otherwise the script will use the current price as backup)
Enter the TP levels you decided to activate (price, qty to sell at each TP level)
Decide about the Emergency Exit (the price that, when broken, will trigger the sale of 100% of your coins with a close limit order)
Setting Up Your 3Commas Connection
Generate API keys in your 3Commas account with (User Profile→3Commas API→New API Access Token→System Generated→Permission: "Smart Trades Only" (leave all other permissions unchecked) + Whitelisted IP→Create→Save API public/private key securely)
Find your Account ID in the 3Commas exchange URL (My Portfolio→View Exchange→Look at the last number in the url of the webpage - should be a 8-digit number)
Enter all credentials in the indicator's connection section
Verify the green checkmarks appear on the Exit Table, confirming that plan and connection are validated
Deploying Your Plan
Check box "Step 1: Check and confirm Exit Plan" in section 4 of User Settings
Create a TradingView alert (Alert→Select Altcoins Exit Planner PRO→Any alert() function call→Interval Same as Chart→Open Ended→Message: coin name→Notifications: enable Webhook→save and exit
Your Smart Trade appears automatically in 3Commas within minutes
IMPORTANT: Delete the alert after successful deployment to prevent duplicated Smart Trades
To modify the Exit Plan: Delete the Smart Trade on 3Commas and repeat the process above
Monitor your Smart Trade execution through your 3Commas dashboard
Important Notes
Always verify your plan in the Exit Table before deployment
Test with smaller positions initially to familiarize yourself with the process
The indicator provides analysis - final trading decisions remain yours
Manage your API keys and Relay secret with caution: do not share with third parties, store them securely, use malware protection on your PC
Your API keys, trading data, and credentials are transmitted securely through direct API connections and are never stored, logged, or accessible to the indicator author - all communication occurs directly between your browser and the target platforms that support the service.
------------------------------------------------------------------
5. Understanding the Resistance Analysis
Fibonacci Extensions: Calculated from three key points: 2022 bear market bottom → early 2024 bull market high → 2025 retracement low. These project where price might encounter resistance during future rallies based on mathematical ratios (0.618, 1.0, 1.618, 2.0, etc.).
Fibonacci Retracements: For established altcoins: calculated from 2021 cycle peak to 2022 bottom. For newer altcoins: from all-time high to subsequent major low. These show potential resistance zones where price may struggle to reclaim previous highs.
Major Pivot Highs: Historical price levels where significant reversals occurred. These act as potential resistance because traders may remember these levels and place sell orders near them.
Volume Imbalances (PVSRA) : Areas where price moved rapidly on abnormal volume, creating gaps that may attract future price action or orders. The indicator uses volume-to-price-range analysis (PVSRA candles or "Vector Candles") to identify these zones.
Price Multipliers: Reference lines showing 2x, 3x, 4x, 5x current price to help you assess the feasibility of your exit targets. These serve as a "reality check" - if you're setting a take-profit at 4x current price, you can quickly evaluate whether that level seems reasonable given current market conditions and your risk tolerance.
Market Trend Analysis: Uses EMA combined with ADX/DMI indicators to assess current market phase (bull/strong bull, bear/strong/bear, weakening trend)
This technical foundation helps explain why certain price levels appear as potential exit zones, though market conditions ultimately determine actual price behavior.
------------------------------------------------------------------
6. FAQs
GENERAL FAQS
Can I use one indicator for multiple altcoins?
Answer: No, each altcoin needs its own chart layout with a separate indicator installation. Resistance levels are calculated from each coin's unique price history, and your exit plan will be different for each position. When you deploy an alert, it creates one Smart Trade on 3Commas for that specific coin only.
To manage multiple coins, create separate TradingView layouts for each altcoin, configure the indicator individually on each chart, then deploy one alert per coin when ready to execute. This ensures each position gets personalized analysis and allows different exit strategies across your portfolio.
EXIT PLAN ANALYSIS/RESISTANCE LEVELS
Are resistance lines calculated automatically by the script?
Answer: Yes, all resistance lines are calculated automatically based on your coin's price history and market data. You don't need to manually identify or draw any levels. The script analyzes historical pivots, calculates Fibonacci ratios from key price swings, identifies volume imbalance zones, and plots everything on your chart.
Simply enable "Show all Resistance Levels" in the settings and the indicator will display all potential resistance zones with color-coded lines and labels showing the exact price levels and their significance.
What's the difference between Fibonacci Extensions and Fibonacci Retracements?
Answer: Fibonacci Retracements look at completed moves from the past and show where price might struggle to reclaim previous highs. For established coins, they're calculated from 2021 peaks down to 2022 bottoms.
Fibonacci Extensions project forward from recent price swings to estimate where ongoing rallies might encounter resistance. They use three points: 2022 bottom, 2024 high, and 2025 retracement low.
Retracements ask "where might recovery stall based on old highs" while Extensions ask "where might this current rally run into trouble." Both use the same mathematical ratios but different reference points to give you complementary resistance perspectives.
Why are some resistance lines gray and others red?
Answer: The color coding helps you assess the potential difficulty of reaching different resistance levels. Gray lines represent closer resistance levels, while red lines indicate stronger resistance or potentially "out-of-reach" targets that may require exceptional market conditions to break through.
This visual system helps you prioritize your exit planning by distinguishing between near-term targets and more ambitious longer-term objectives when setting your take-profit levels.
What is the resistance from major pivot highs?
Answer: Major pivot highs are historical price levels where significant reversals occurred in the past. These levels often act as resistance because traders remember these previous "ceiling" points where price failed to break higher and may place sell orders near them again.
The indicator automatically identifies these pivot points from your coin's price history and draws horizontal lines at those levels. When price approaches these areas again, it may struggle to break through due to psychological resistance and clustered sell orders from traders who expect similar rejection patterns.
What is the resistance from abnormal volumes?
Answer: Volume imbalances occur when price moves rapidly on abnormally high volume, creating gaps or zones where institutions moved large amounts quickly. These areas often act as resistance when price returns to them because institutional traders may want to "fill" these gaps or add to their positions at those levels.
The indicator uses PVSRA analysis to identify candles with abnormal volume-to-price ratios and marks these zones on your chart. When price approaches these imbalance areas again, it may encounter resistance from institutional activity or algorithmic trading systems programmed to react at these levels.
What are price multipliers?
Answer: Price multipliers are reference lines showing 2x, 3x, 4x, and 5x the current price. They serve as a reality check when setting your take-profit targets. If you're considering a take-profit at $10 and current price is $2, you can quickly see that's a 5x target and evaluate whether that seems realistic given current market conditions.
These lines help you assess the feasibility of your exit goals and avoid setting unrealistic expectations. They're not resistance levels themselves, but visual aids to help you gauge whether your planned targets are conservative, aggressive, or somewhere in between
How is the EMA calculated and why does it represent bull/bear market intensity?
Answer: The indicator uses a 147-period EMA (1D tf) combined with ADX and DMI indicators to assess market phases. The EMA provides the basic trend direction - when price is above the EMA, it suggests bullish conditions, and when below, bearish conditions.
The intensity comes from the ADX/DMI analysis. Strong bull markets occur when price is above the EMA, ADX is above 25 (indicating strong trend), and the positive directional indicator dominates. Strong bear markets show the opposite pattern with negative directional movement dominating.
The system also uses weekly ADX slope to confirm trend strength is increasing rather than fading. This combination helps distinguish between weak sideways markets and genuine strong trending phases, giving you context at the time of exit planning.
EXIT PLAN
Why does my exit plan show errors?
Answer: The indicator validates your plan in real-time and shows specific error messages to help you fix issues. Common problems include take-profit percentages that don't sum to exactly 100%, price levels set in wrong order (TP2 must be higher than TP1), or gaps in your sequence (you can't use TP3 without filling TP1 and TP2 first).
Check the Exit Plan Validation section in the table - it will show exactly what needs fixing with messages like "TP percentages must sum to exactly 100%" or "Fill TPs consecutively starting from TP1." Fix the highlighted issue and the error will clear automatically, turning your validation checkmark green when everything is correct.
Why do I need to provide my coin quantity and average entry price?
Answer: The coin quantity is essential because the indicator calculates exact amounts to sell at each take-profit level based on your percentages. If you set TP1 to sell 25% of your position, the script needs to know your total quantity to calculate that 25% means exactly X coins in your 3Commas Smart Trade.
The average entry price helps calculate your projected gains and portfolio performance in the Exit Table. If you don't know your exact entry price, leave it at zero and the indicator will use current price as a fallback for calculations. Both pieces of information ensure your Smart Trade matches your actual position size and gives you accurate profit projections.
What is the emergency exit price?
Answer: The emergency exit price is an optional stop-loss feature that automatically sells 100% of your coin position if price falls to your specified level. This is critical to understand because once triggered, 3Commas will execute the sale immediately without further confirmation.
When price hits your emergency exit level, 3Commas places a limit sell order at 3% below that price to avoid poor market execution. However, execution is not guaranteed because limit orders may not fill during extreme volatility or if price gaps below your limit level. Use this feature cautiously and set the emergency price well below normal support levels to account for typical market fluctuations.
This sells your entire position regardless of your take-profit plan, so only enable it if you want automated crash protection and understand the risks of potential false breakdowns triggering unnecessary exits.
3COMMAS CONNECTION
How do I get my 3Commas API keys and Account ID?
Answer:
For API Keys: Log into 3Commas, go to User Profile → 3Commas API → New API Access Token → System Generated. Set permissions to "Smart Trades Only" (leave all other permissions unchecked) and add your IP to the whitelist for security. Save both the public and private keys securely after creation.
For Account ID: Go to My Portfolio → View Exchange in 3Commas. Look at the URL in your browser - the Account ID is the 8-digit number at the end of the webpage address (example: if the URL shows "/accounts/12345678" then your Account ID is 12345678).
Important: Never share these credentials with anyone. The indicator transmits them directly to 3Commas through secure API connections without storing or logging them. If you suspect your keys are compromised, revoke them immediately in your 3Commas account and generate new ones.
ALERTS
I have set up my exit plan, what's next?
Answer: Once your exit plan is configured and shows green checkmarks in the validation section, follow the 4-step workflow in the indicator. Check "Step 1: Check and confirm Exit Plan" to enable alert firing, then create a TradingView alert using the Altcoins Exit Planner PRO condition with "Any alert() function call" trigger.
The alert fires immediately and sends your plan to 3Commas. Within minutes, you should see a new Smart Trade appear in your 3Commas dashboard matching your exact exit strategy. After confirming the Smart Trade was created successfully, delete the TradingView alert to prevent duplicate submissions.
From that point, 3Commas manages your exit automatically according to your plan. Monitor execution through your 3Commas dashboard and let the platform handle the sequential take-profit levels as price moves.
How do I create the TradingView alert?
Answer: Click the "Alert" button in TradingView (bell icon in the top toolbar). In the alert setup window, set Condition to "Altcoins Exit Planner PRO" and Trigger to "Any alert() function call." Keep Interval as "Same as Chart" and Expiration as "Open Ended."
In the Message section, you can name your alert anything you want. In the Notifications section, enable the webhook option (leave the URL field as you'll handle that separately). You can also enable email or sound notifications if desired.
Click "Create" to activate the alert. If Step 1 is already checked in your indicator, the alert will fire immediately and send your exit plan to 3Commas. Remember to delete this alert after your Smart Trade appears to prevent duplicates.
I got the Smart Trade on 3Commas, what's next?
Answer: Congratulations! Your exit plan is now active and automated. Delete the TradingView alert immediately to prevent duplicate Smart Trades from being created. You can now monitor your Smart Trade's progress through your 3Commas dashboard.
3Commas will automatically execute your take-profit levels as price reaches each target, selling the specified percentages of your position according to your plan. If you enabled emergency exit protection, that stop-loss is also active and monitoring for downside protection.
Your job is essentially done - let 3Commas handle the execution while you monitor overall market conditions. You can view trade progress, modify the Smart Trade if needed, or manually close it early through your 3Commas interface. The platform will manage all the sequential selling according to your original exit strategy.
Can I cancel my exit plan and resubmit to 3Commas?
Answer: Yes, you can modify your exit strategy by first deleting the existing Smart Trade in your 3Commas dashboard, then resubmitting a new plan through the indicator.
To cancel and resubmit: Go to your 3Commas Smart Trades section and delete the current trade. Return to the TradingView indicator, modify your exit plan settings (prices, percentages, emergency exit, etc.), then repeat the deployment process by checking Step 1 and creating a new alert.
This creates a fresh Smart Trade with your updated parameters. Always ensure you delete the old Smart Trade first to avoid having multiple conflicting exit plans running simultaneously. The new deployment will overwrite nothing automatically - you must manually clean up the old trade before submitting the revised plan.
Why did I get a second Smart Trade after the first one?
Answer: This happens when you forget to delete the TradingView alert after your first Smart Trade was created successfully. The alert remains active and continues firing, creating duplicate Smart Trades each time it triggers.
Always delete your TradingView alert immediately after confirming your Smart Trade appears in 3Commas. Go to your TradingView alerts list, find the alert you created for this exit plan, and delete it completely. Also delete any duplicate Smart Trades in your 3Commas dashboard to avoid confusion.
To prevent this in future deployments, remember the workflow: create alert → Smart Trade appears → delete alert immediately. Each exit plan should only generate one Smart Trade, and keeping alerts active will cause unwanted duplicates.
------------------------------------------------------------------
7. Limitations and Disclaimer
Limitations:
Doesn't provide trading signals or entry points
Doesn't guarantee resistance levels will hold
Requires manual monitoring of 3Commas execution
Works for exit planning only, not position building
Disclaimer
This indicator is for educational and informational purposes only. It does not constitute financial, investment, or trading advice.
The indicator:
Makes no guarantees about future market performance
Cannot predict market movements with certainty
May generate false indications
Relies on historical patterns that may not repeat
Should not be used as the sole basis for trading decisions
Users are responsible for:
Conducting independent research and analysis
Understanding the risks of cryptocurrency trading
Making their own investment/divestment decisions
Managing position sizes and risk exposure appropriately
Managing API keys and secret codes diligently (do not share with third parties, store them securely, use malware protection on your PC)
Cryptocurrency trading involves substantial risk and may not be suitable for all investors. Past performance does not guarantee future results. Users should only invest what they can afford to lose and consult qualified professionals before making financial decisions.
The indicator’s assumptions may be invalidated by changing market conditions.
By using this tool, users acknowledge these limitations and accept full responsibility for their trading decisions.

Master Arb Recipes – 3 Commas signal Bot integration Master Arb Recipes – 3 Commas signal Bot integration
Purpose
A systematic arbitrage/accumulation framework with pre-tuned “recipes” for BTC/ETH/XRP/SUI/SOL plus a fully manual mode. It automates signal generation for external execution bots (via alert() JSON), while showing on-chart panels for goals, active parameters, DCA position, and P&L/ROI/CAGR. Backtests simulate market orders with optional slippage and TradingView commissions.
Key ideas
Entries: Intrabar trigger when price drops by the recipe’s Entry drop % from the previous close.
Exits: Profit-taking when price rises by the recipe’s Exit rise % (optionally requiring price above average cost).
DCA accounting: Tracks running quantity, average cost, realized (cash) P&L, and unrealized (coin) P&L.
Capital planning: “ReqCap” column estimates capital = Entry $ × Allowed entries (UI only; does not affect orders).
Alerts (live only): Sends minimal Custom Signal JSON for enter_long / exit_long to your execution bot.
What’s included on chart
Top-Right: Strategy Goals Table
Describes the objective for each preset. Auto-filters by the chart’s base (optional).
Bottom-Left: Active Recipe Panel (with 3C UI column)
Shows the active preset (or custom) with: timeframe, Sell-Above-Cost state, Entry/Exit %, Exit-as-%-of-Entry, min bars between entries, once-per-bar gate, and 3Commas UI guidance for optional filters and per-order dollars.
Top-Left: DCA Panel
Current base quantity, average cost, and realized P&L.
Bottom-Right: P&L + ROI/CAGR Panel
Cash P&L (realized), Coin P&L (unrealized), Total P&L, ROI since first fill, and annualized CAGR. Displays denominators for both StartCap (strategy.initial_capital) and ReqCap (planning).
Presets
BTC: STH1_D, LTH1_6H, LTH2_D, LTH3_W, LTH4_6H
ETH: STH1_D, STH2_D, LTH1_D
XRP: STH1_D, STH2_6H, LTH1_6H, LTH2_1H
SUI: STH1_D, STH2_D, STH3_D
SOL: STH1_D, LTH1_D
Each preset sets Entry drop %, Exit rise %, default Entry $, Exit-as-%-of-Entry, Sell-Above-Cost flag, and a reference timeframe (display only). Custom mode lets you define these manually.
Inputs you’ll use
3Commas Custom Signal: secret, bot_uuid, max_lag_sec.
Start Window: Exact date/time + timezone to begin trading/signals.
Entry/Exit Parameters: Entry drop %, Exit rise %, Sell Above Avg Cost toggle, Exit as % of Entry.
Capital Planning: Allowed entries (for ReqCap), Entry $ override (panel only).
Execution/Sim: Simulated slippage %, once-per-bar gate, minimum bars between entries, TradingView commission.
Panels: Toggles + positions for each table.
Alert / Bot integration
Alerts fire only in realtime (barstate.isrealtime) on order submission.
Create one alert on this script using “Any alert() function call”.
Payload (Custom Signal style) includes:
secret, bot_uuid, max_lag, timestamp, trigger_price, tv_exchange, tv_instrument, action where action ∈ {enter_long, exit_long}.
Sizing: This script does not include per-order sizing in the JSON; size in your bot UI. The on-chart Entry $ / Exit $ values are for planning/backtest display.
3Commas optional filter mapping (shown in the panel’s “3C UI” column):
Entry filters:
Same order: set to –EntryDrop% (ON)
From average entry: set to –EntryDrop% (ON)
Exit filters:
If Sell Above Cost = ON → From average entry +ExitRise% (ON); Same order OFF
If Sell Above Cost = OFF → Same order +ExitRise% (ON); From average entry OFF
Per-order volume: Use your bot’s UI. Panel shows the dollars you planned (Entry $ and Exit $).
Backtest notes & limitations
Uses calc_on_every_tick=true and intrabar checks against the previous close for entry drops; historical behavior won’t perfectly match exchange microstructure.
process_orders_on_close=false; fills are simulated at bar prices with your slippage setting and TV commission.
Alerts and webhook timing depend on TradingView + broker/exchange latencies; use max_lag_sec accordingly.
Required Capital (ReqCap) is for planning only and does not reserve funds or constrain orders.
Recommended markets/timeframes
Crypto spot or futures charts that trade 24/7. Preset labels (D/6H/1H/W) are reference rhythms for volatility; the script runs on any timeframe but results will vary.
Change log (04092025)
Added 3C UI guidance column in Active Recipe panel (dynamic % per recipe).
Restored Goals (top-right) and P&L/ROI/CAGR (bottom-right with StartCap & ReqCap).
Minor UI clarifications; trading logic unchanged.
Disclaimer
This script is for research and education. It is not financial advice and makes no performance promises. Backtests are hypothetical and subject to substantial limitations. Markets involve risk; you can lose capital. Test on paper first and deploy at your own discretion. Licensed under the Mozilla Public License 2.0.

QuantJazz Turbine Trader BETA v1.17QuantJazz Turbine Trader BETA v1.17 - Strategy Introduction and User Guide
Strategy Introduction
Welcome to the QuantJazz Turbine Trader BETA v1.17, a comprehensive trading strategy designed for TradingView. This strategy is built upon oscillator principles, drawing inspiration from the Turbo Oscillator by RedRox, and incorporates multiple technical analysis concepts including RSI, MFI, Stochastic oscillators, divergence detection, and an optional FRAMA (Fractal Adaptive Moving Average) filter.
The Turbine Trader aims to provide traders with a flexible toolkit for identifying potential entry and exit points in the market. It presents information through a main signal line oscillator, a histogram, and various visual cues like dots, triangles, and divergence lines directly on the indicator panel. The strategy component allows users to define specific conditions based on these visual signals to trigger automated long or short trades within the TradingView environment.
This guide provides an overview of the strategy's components, settings, and usage. Please remember that this is a BETA version (v1.17). While developed with care, it may contain bugs or behave unexpectedly.
LEGAL DISCLAIMER: QuantJazz makes no claims about the fitness or profitability of this tool. Trading involves significant risk, and you may lose all of your invested capital. All trading decisions made using this strategy are solely at the user's discretion and responsibility. Past performance is not indicative of future results. Always conduct thorough backtesting and risk assessment before deploying any trading strategy with real capital.
This work is licensed under Creative Commons Attribution-NonCommercial-ShareAlike 4.0 International.
Core Concepts and Visual Elements
The Turbine Trader indicator displays several components in its own panel below the main price chart:
1. Signal Line (Avg & Avg2): This is the primary oscillator. It's a composite indicator derived from RSI, MFI (Money Flow Index), and Stochastic calculations, smoothed using an EMA (Exponential Moving Average).
Avg: The faster smoothed signal line.
Avg2: The slower smoothed signal line.
Color Coding: The space between Avg and Avg2 is filled. The color (Neon Blue/gColor or Neon Purple/rColor) indicates the trend based on the relationship between Avg and Avg2. Blue suggests bullish momentum (Avg > Avg2), while Purple suggests bearish momentum (Avg2 > Avg).
Zero Line Crosses: Crossovers of the Avg line with the zero level can indicate shifts in momentum.
2. Histogram (resMfi): This histogram is based on smoothed and transformed MFI calculations (Fast MFI and Slow MFI).
Color Coding: Bars are colored Neon Blue (histColorUp) when above zero, suggesting bullish pressure, and Neon Purple (histColorDn) when below zero, suggesting bearish pressure. Transparency is applied.
Zero Line Crosses: Crossovers of the histogram with the zero level can signal potential shifts in money flow.
3. Reversal Points (Dots): Dots appear on the Signal Line (specifically on Avg2) when the color changes (i.e., Avg crosses Avg2).
Small Dots: Appear when a reversal occurs while the oscillator is in an "extreme" zone (below -60 for bullish reversals, above +60 for bearish reversals).
Large Dots: Appear when a reversal occurs outside of these extreme zones.
Colors: Blue (gRdColor) for bullish reversals (Avg crossing above Avg2), Purple (rRdColor) for bearish reversals (Avg crossing below Avg2).
4. Take Profit (TP) Signals (Triangles): Small triangles appear above (+120) or below (-120) the zero line.
Bearish Triangle (Down, Purple rTpColor): Suggests a potential exit point for long positions or an entry point for short positions, based on the oscillator losing upward momentum above the 50 level.
Bullish Triangle (Up, Blue gTpColor): Suggests a potential exit point for short positions or an entry point for long positions, based on the oscillator losing downward momentum below the -50 level.
5. Divergence Lines: The strategy automatically detects and draws potential regular and hidden divergences between the price action (highs/lows) and the Signal Line (Avg).
Regular Bullish Divergence (White bullDivColor line, ⊚︎ label): Price makes a lower low, but the oscillator makes a higher low. Suggests potential bottoming.
Regular Bearish Divergence (White bearDivColor line, ⊚︎ label): Price makes a higher high, but the oscillator makes a lower high. Suggests potential topping.
Hidden Bullish Divergence (bullHidDivColor line, ⊚︎ label): Price makes a higher low, but the oscillator makes a lower low. Suggests potential continuation of an uptrend.
Hidden Bearish Divergence (bearHidDivColor line, ⊚︎ label): Price makes a lower high, but the oscillator makes a higher high. Suggests potential continuation of a downtrend.
Delete Broken Divergence Lines: If enabled, newer divergence lines originating from a similar point will replace older ones.
6. Status Line: A visual bar at the top (95 to 105) and bottom (-95 to -105) of the indicator panel. Its color intensity reflects the confluence of signals:
Score Calculation: +1 if Avg > Avg2, +1 if Avg > 0, +1 if Histogram > 0.
Top Bar (Bullish): Bright Blue (gStatColor) if score is 3, Faded Blue if score is 2, Black otherwise.
Bottom Bar (Bearish): Bright Purple (rStatColor) if score is 0, Faded Purple if score is 1, Black otherwise.
Strategy Settings Explained
The strategy's behavior is controlled via the settings panel (gear icon).
1. Date Range:
Start Date, End Date: Define the period for backtesting. Trades will only occur within this range.
2. Optional Webhook Configuration: (For Automation)
3C Email Token, 3C Bot ID: Enter your 3Commas API credentials if you plan to automate trading using webhooks. The strategy generates JSON alert messages compatible with 3Commas. You can go ahead and just leave the text field as defaulted, "TOKEN HERE" / "BOT ID HERE" if not using any bot automations at this time. You can always come back later and automate it. More info can be made available from QuantJazz should you need automation assistance with custom indicators and trading strategies.
3. 🚀 Signal Line:
Turn On/Off: Show or hide the main signal lines (Avg, Avg2).
gColor, rColor: Set the colors for bullish and bearish signal line states.
Length (RSI): The lookback period for the internal RSI calculation. Default is 2.
Smooth (EMA): The smoothing period for the EMAs applied to the composite signal. Default is 9.
RSI Source: The price source used for RSI calculation (default: close).
4. 📊 Histogram:
Turn On/Off: Show or hide the histogram.
histColorUp, histColorDn: Set the colors for positive and negative histogram bars.
Length (MFI): The base lookback period for MFI calculations. Default is 5. Fast and Slow MFI lengths are derived from this.
Smooth: Smoothing period for the final histogram output. Default is 1 (minimal smoothing).
5.💡 Other:
Show Divergence Line: Toggle visibility of regular divergence lines.
bullDivColor, bearDivColor: Colors for regular divergence lines.
Show Hidden Divergence: Toggle visibility of hidden divergence lines.
bullHidDivColor, bearHidDivColor: Colors for hidden divergence lines.
Show Status Line: Toggle visibility of the top/bottom status bars.
gStatColor, rStatColor: Colors for the status line bars.
Show TP Signal: Toggle visibility of the TP triangles.
gTpColor, rTpColor: Colors for the TP triangles.
Show Reversal points: Toggle visibility of the small/large dots on the signal line.
gRdColor, rRdColor: Colors for the reversal dots.
Delete Broken Divergence Lines: Enable/disable automatic cleanup of older divergence lines.
6. ⚙️ Strategy Inputs: (CRITICAL for Trade Logic)
This section defines which visual signals trigger trades. Each signal (Small/Large Dots, TP Triangles, Bright Bars, Signal/Histogram Crosses, Signal/Histogram Max/Min, Divergences) has a dropdown menu:
Long: This signal can trigger a long entry.
Short: This signal can trigger a short entry.
Disabled: This signal will not trigger any entry.
Must Be True Checkbox: If checked for a specific signal, that signal's condition must be met for any trade (long or short, depending on the dropdown selection for that signal) to be considered. Multiple "Must Be True" conditions act as AND logic – all must be true simultaneously.
How it Works:
The strategy first checks if all conditions marked as "Must Be True" (for the relevant trade direction - long or short) are met.
If all "Must Be True" conditions are met, it then checks if at least one of the conditions not marked as "Must Be True" (and set to "Long" or "Short" respectively) is also met.
If both steps pass, and other filters (like Date Range, FRAMA) allow, an entry order is placed.
Example: If "Large Bullish Dot" is set to "Long" and "Must Be True" is checked, AND "Bullish Divergence" is set to "Long" but "Must Be True" is not checked: A long entry requires BOTH the Large Bullish Dot AND the Bullish Divergence to occur simultaneously. If "Large Bullish Dot" was "Long" but not "Must Be True", then EITHER a Large Bullish Dot OR a Bullish Divergence could trigger a long entry (assuming no other "Must Be True" conditions are active).
Note: By default, the strategy is configured for long-only trades (strategy.risk.allow_entry_in(strategy.direction.long)). To enable short trades, you would need to comment out or remove this line in the Pine Script code and configure the "Strategy Inputs" accordingly.
7. 💰 Take Profit Settings:
Take Profit 1/2/3 (%): The percentage above the entry price (for longs) or below (for shorts) where each TP level is set. (e.g., 1.0 means 1% profit).
TP1/2/3 Percentage: The percentage of the currently open position to close when the corresponding TP level is hit. The percentages should ideally sum to 100% if you intend to close the entire position across the TPs.
Trailing Stop (%): The percentage below the highest high (for longs) or above the lowest low (for shorts) reached after the activation threshold, where the stop loss will trail.
Trailing Stop Activation (%): The minimum profit percentage the trade must reach before the trailing stop becomes active.
Re-entry Delay (Bars): The minimum number of bars to wait after a TP is hit before considering a re-entry. Default is 1 (allows immediate re-entry on the next bar if conditions met).
Re-entry Price Offset (%): The percentage the price must move beyond the previous TP level before a re-entry is allowed. This prevents immediate re-entry if the price hovers around the TP level.
8. 📈 FRAMA Filter: (Optional Trend Filter)
Use FRAMA Filter: Enable or disable the filter.
FRAMA Source, FRAMA Period, FRAMA Fast MA, FRAMA Slow MA: Parameters for the FRAMA calculation. Defaults provided are common starting points.
FRAMA Filter Type:
FRAMA > previous bars: Allows trades only if FRAMA is significantly above its recent average (defined by FRAMA Percentage and FRAMA Lookback). Typically used to confirm strong upward trends for longs.
FRAMA < price: Allows trades only if FRAMA is below the current price (framaSource). Can act as a baseline trend filter.
FRAMA Percentage (X), FRAMA Lookback (Y): Used only for the FRAMA > previous bars filter type.
How it Affects Trades: If Use FRAMA Filter is enabled:
Long entries require the FRAMA filter condition to be true.
Short entries require the FRAMA filter condition to be false (as currently coded, this acts as an inverse filter for shorts if enabled).
How to Use the Strategy
1. Apply to Chart: Open your desired chart on TradingView. Click "Indicators", find "QuantJazz Turbine Trader BETA v1.17" (you might need to add it via Invite-only scripts or if published publicly), and add it to your chart. The oscillator appears below the price chart, and the strategy tester panel opens at the bottom.
2. Configure Strategy Properties: In the Pine Script code itself (or potentially via the UI if supported), adjust the strategy() function parameters like initial_capital, default_qty_value, commission_value, slippage, etc., to match your account, broker fees, and risk settings. The user preferences provided (e.g., 1000 initial capital, 0.1% commission) are examples. Remember use_bar_magnifier is false by default in v1.17.
3. Configure Inputs (Settings Panel):
Set the Date Range for backtesting.
Crucially, configure the ⚙️ Strategy Inputs. Decide which signals should trigger entries and whether they are mandatory ("Must Be True"). Start simply, perhaps enabling only one or two signals initially, and test thoroughly. Remember the default long-only setting unless you modify the code.
Set up your 💰 Take Profit Settings, including TP levels, position size percentages for each TP, and the trailing stop parameters. Decide if you want to use the re-entry feature.
Decide whether to use the 📈 FRAMA Filter and configure its parameters if enabled.
Adjust visual elements (🚀 Signal Line, 📊 Histogram, 💡 Other) as needed for clarity.
4. Backtest: Use the Strategy Tester panel in TradingView. Analyze the performance metrics (Net Profit, Max Drawdown, Profit Factor, Win Rate, Trade List) across different assets, timeframes, and setting configurations. Pay close attention to how different "Strategy Inputs" combinations perform.
5. Refine: Based on backtesting results, adjust the input settings, TP/SL strategy, and signal combinations to optimize performance for your chosen market and timeframe, while being mindful of overfitting.
6. Automation (Optional): If using 3Commas or a similar platform:
Enter your 3C Email Token and 3C Bot ID in the settings.
Create alerts in TradingView (right-click on the chart or use the Alert panel).
Set the Condition to "QuantJazz Turbine Trader BETA v1.17".
In the "Message" box, paste the corresponding placeholder, which will pass the message in JSON from our custom code to TradingView to pass through your webhook: {{strategy.order.alert_message}}.
In the next tab, configure the Webhook URL provided by your automation platform. Put a Whale sound, while you're at it! 🐳
When an alert triggers, TradingView will send the pre-formatted JSON message from the strategy code to your webhook URL.
Final Notes
The QuantJazz Turbine Trader BETA v1.17 offers a wide range of customizable signals and strategy logic. Its effectiveness heavily depends on proper configuration and thorough backtesting specific to the traded asset and timeframe. Start with the default settings, understand each component, and methodically test different combinations of signals and parameters. Remember the inherent risks of trading and never invest capital you cannot afford to lose.

3Commas Multicoin Scalper LITE [SwissAlgo]
Introduction
Are you tired of tracking cryptocurrency charts and placing orders manually on your Exchange?
The 3Commas Multicoin Scalper LITE is an automated trading system designed to identify and execute potential trading setups on multiple cryptocurrencies ( simultaneously ) on your preferred Exchange (Binance, Bybit, OKX, Gate.io, Bitget) via 3Commas integration.
It analyzes price action, volume, momentum, volatility, and trend patterns across two categories of USDT Perpetual coins: the 'Top Major Coins' category (11 established cryptocurrencies) and your Custom Category (up to 10 coins of your choice).
The indicator sends real-time trading signals directly to your 3Commas bots for automated execution, identifying both trend-following and contrarian trading opportunities in all market conditions.
Trade automatically all coins of one or more selected categories:
----------------------------------------------
What it Does
The 3Commas Multicoin Scalper LITE is a technical analysis tool that monitors multiple cryptocurrency pairs simultaneously and connects with 3Commas for signal delivery and execution.
Here's how the strategy works:
🔶 Technical Analysis : Analyzes price action, volume, momentum, volatility, and trend patterns across USDT Perpetual Futures contracts simultaneously.
🔶 Pattern Detection : Identifies specific candle patterns and technical confluences that suggest potential trading setups across USDT.P contracts of the selected category.
🔶 Signal Generation : When technical criteria are met at bar close, the indicator creates deal-start signals for the relevant pairs.
🔶 3Commas Integration : Packages these signals and delivers them to 3Commas through TradingView alerts, allowing 3Commas bots to receive specific pair information ('Deal-Start' signals).
🔶 Category Management : Each TradingView alert monitors an entire category, allowing selective activation of different crypto categories.
🔶 Visual Feedback : Provides color-coded candles and backgrounds to visualize technical conditions, with optional pivot points and trend visualization.
Candle types
Signals
----------------------------------------------
Quick Start Guide
1. Setup 3Commas Bots : Configure two DCA bots in 3Commas (All USDT pairs) - one for LONG positions and one for SHORT positions.
2. Define Trading Parameters : Set your budget for each trade and adjust your preferred sensitivity within the indicator settings.
3. Create Category Alerts : Set up one TradingView alert for each crypto category you want to trade.
That's it! Once configured, the system automatically sends signals to your 3Commas bots when predefined trading setups are detected across coins in your selected/activated categories. The indicator scans all coins at bar close (for example, every hour on the 1H timeframe) and triggers trade execution only for those showing technical confluences.
Important : Consider your total capital when enabling categories. More details about the setup process are provided below (see paragraph "Detailed Setup & Configuration").
----------------------------------------------
Built-in Backtesting
The 3Commas Multicoin Scalper LITE includes backtesting visualization for each coin. When viewing any USDT Perpetual pair on your chart, you can visualize how the strategy would have performed historically on that specific asset.
Color-coded candles and signal markers show past trading setups, helping you evaluate which coins responded best to the strategy. This built-in backtesting capability can support your selection of assets/categories to trade before deploying real capital.
As backtesting results are hypothetical and do not guarantee future performance, your research and analysis are essential for selecting the crypto categories/coins to trade.
The default strategy settings are: Start Capital 1,000$, leverage 10X, Commissions 0.1% (average Taker Fee on Exchanges for average users), Order Amount 200$ for Longs/Shorts, Slippage 4
Example of backtesting view
----------------------------------------------
Key Features
🔶 Multi-Exchange Support : Compatible with BINANCE, BYBIT, BITGET, GATEIO, and OKX USDT Perpetual markets (USDT.P)
🔶 Category Options : Analyze cryptocurrencies in the Top Major Coins category or create your custom watchlist
🔶 Custom Category Option : Create your watchlist with up to 10 custom USDT Perpetual pairs
🔶 3Commas Integration : Seamlessly connects with 3Commas bots to automate trade entries and exits
🔶 Dual Strategy Approach : Identifies both "trend following" and "contrarian" potential setups
🔶 Confluence-Based Signals : Uses a combination of multiple technical factors - price spikes, price momentum, volume spikes, volume momentum, trend analysis, and volatility spikes - to generate potential trading setups
🔶 Risk Management : Adjustable sensitivity/risk levels, leverage settings, and budget allocation for each trade
🔶 Visual Indicators : Color-coded candles and trading signals provide visual feedback on market conditions
🔶 Trend Indication : Background colors showing ongoing uptrends/downtrends
🔶 Pivot Points & Daily Open : Optional display of pivot points and daily open price for additional context
🔶 Liquidity Analysis : Optional display of high/low liquidity timeframes throughout the trading week
🔶 Trade Control : Configurable limit for the maximum number of signals sent to 3Commas for execution (per bar close and category)
5 Available Exchanges
Pick coins/tokens and defined your Custom Category
----------------------------------------------
Methodology
The 3Commas Multicoin Scalper LITE utilizes a multi-faceted approach to identify potential trading setups:
1. Price Action Analysis : Detects abnormal price movements by comparing the current candle's range to historical averages and standard deviations, helping identify potential "pump and dump" scenarios or new-trends start
2. Price Momentum : Evaluates the relative strength of bullish vs. bearish price movements over time, indicating the build-up of buying or selling pressure.
3. Volume Analysis: Identifies unusual volume spikes by comparing current volume to historical averages, signaling strong market interest in a particular direction.
4. Volume Momentum : Measures the ratio of bullish to bearish volume, revealing the dominance of buyers or sellers over time.
5. Trend Analysis : Combines EMA slopes, RSI, and Stochastic RSI to determine overall trend direction and strength.
6. Volatility : Monitors the ATR (Average True Range) to detect periods of increased market volatility, which may indicate potential breakouts or reversals
7. Candle Wick Analysis : Evaluates upper and lower wick percentages to detect potential rejection patterns and reversals.
8. Pivot Point Analysis : Uses pivot points (PP, R1-R3, S1-S3) for identifying key support/resistance areas and potential breakout/breakdown levels.
9. Daily Open Reference: Analyzes price action relative to the daily open for potential setups related to price movement vs. the opening price
10. Market Timing/Liquidity : Evaluates high/low liquidity periods, specific days/times of heightened risk, and potential market manipulation timeframes.
11. Boost Factors : Applies additional weight to certain confluence patterns to adjust global scores
These factors are combined into a "Global Score" ranging from -1 to +1 , applied at bar close to the newly formed candles.
Scores above predefined thresholds (configurable via the Sensitivity Settings) indicate strong bullish or bearish conditions and trigger signals based on predefined patterns. The indicator then applies additional filters to generate specific "Trend Following" and "Contrarian" trading signals. The identified signals are packaged and sent to 3Commas for execution.
Pivot Points
Trend Background
----------------------------------------------
Who This Strategy Is For
The 3Commas Multicoin Scalper LITE may benefit:
Crypto Traders seeking to automate their trading across multiple coins simultaneously
3Commas Users looking to enhance their bot performance with technical signals
Busy Traders who want to monitor market opportunities without constant chart-watching
Multi-strategy traders interested in both trend-following and reversal trading approaches
Traders of Various Experience Levels from intermediate traders wanting to save time to advanced traders seeking to optimize their operations
Perpetual Futures Traders on major exchanges (Binance, Bybit, OKX, Gate.io, Bitget)
Swing and Scalp Traders seeking to identify short to medium-term profit opportunities
----------------------------------------------
Visual Indicators
The indicator provides visual feedback through:
1. Candlestick Colors :
* Lime: Strong bullish candle (High positive score)
* Blue: Moderate bullish candle (Medium positive score)
* Red: Strong bearish candle (High negative score)
* Purple: Moderate bearish candle (Medium negative score)
* Pale Green/Red: Mild bullish/bearish candle
2. Signal Markers :
* ↗: Trend following Long signal
* ↘: Trend following Short signal
* ⤴: Contrarian Long signal
* ⤵: Contrarian Short signal
3. Optional Elements :
* Pivot Points: Daily support/resistance levels (R1-R3, S1-S3, PP)
* Daily Open: Reference price level for the current trading day
* Trend Background: Color-coded background suggesting potential ongoing uptrend/downtrend
* Liquidity Highlighting: Background colors indicating typical high/low market liquidity periods
4. TradingView Strategy Plots and Backtesting Data : Standard performance metrics showing entry/exit points, equity curves, and trade statistics, based on the signals generated by the script.
----------------------------------------------
Detailed Setup & Configuration
The indicator features a user-friendly input panel organized in sequential steps to guide you through the complete setup process. Tooltips for each step provide additional information to help you understand the actions required to get the strategy running.
Informative tables provide additional details and instructions for critical setup steps such as 3Commas bot configuration and TradingView alert creation (to activate trading on specific categories).
1. Choose Exchange, Crypto Category & Sensitivity
* Select your USDT Perpetual Exchange (BINANCE, BYBIT, BITGET, GATEIO, or OKX) - i.e. the same Exchange connected in your 3Commas account
* Choose your preferred crypto category, or define your watchlist
* Choose from three sensitivity levels: Default, Aggressive, or Test Mode (test mode is designed to generate more signals, a potentially helpful feature when you are testing the indicator and alerts)
2. Setup 3Commas Bots and integrate them with the algo
* Create both LONG and SHORT DCA Bots in 3Commas
* Configure bots to accept signals for 'All USDT Pairs' with "TradingView Custom Signal" as deal start condition
* Enter your Bot IDs and Email Token in the indicator settings
* Set a maximum budget for LONG and SHORT trades
* Choose whether to allow LONG trades, SHORT trades, or both, according to your preference and market analysis
* Set maximum trades per bar/category (i.e. the max. number of simultaneous signals that the algo may send to your 3Commas bots for execution at every bar close - every hour if you set the 1H timeframe)
* Access the detailed setup guide table for step-by-step 3Commas configuration instructions
3Commas integration
3. Choose Visuals
* Toggle various optional visual elements to add to the chart: category metrics, fired alerts, coin metrics, daily open, pivot points
* Select a color theme: Dark or Light
4. Activate Trading via Alerts
* Create TradingView alerts for each category you want to trade
* Set alert condition to "3Commas Multicoin Scalper" with "Any alert() function call"
* Set the content of the message field to: {{Message}}, deleting the default content shown in this text field, to enable proper 3Commas integration (any other text than {{Message}}, would break the delivery trading signals from Tradingview to 3Commas)
* View the alerts setup instruction table for visual guidance on this critical step
Alerts
Fired Alerts (example at a single bar)
Fired Alerts (frequency)
Important Configuration Notes
Ensure that the TradingView chart's exchange matches your selected exchange in the indicator settings and your 3Commas bot settings.
You must configure the same leverage in both the script and your 3Commas bots
Your 3Commas bots must be configured for All USDT pairs
You must enter the exact Bot IDs and Email Token from 3Commas (these remain confidential - no one, including us, has access to them)
If you activate multiple categories without sufficient capital, 3Commas will display " insufficient funds " errors - align your available capital with the number of categories you activate (each deal will use the budget amount specified in user inputs)
You are free to set your Take Profit % / trailing on 3Commas
We recommend not to use DCA orders (i.e. set the number of DCA orders at zero)
Legend of symbols and plots on the chart
----------------------------------------------
FAQs
General Questions
❓ Q: What features are included in this indicator? A: This indicator provides access to the "Top Major Coins" category and a custom category option where you can define up to 10 pairs of your choice. It includes multi-exchange support, 3Commas integration, a dual strategy approach, visual indicators, trade controls, and comprehensive backtesting capabilities. The indicator is optimized to manage up to 2 trades per hour/category with leverage up to 10x and trade sizes up to 500 USDT - everything needed for traders looking to automate their crypto trading across multiple pairs simultaneously.
❓ Q: What is Global Score? A: The Global Score serves as a foundation for signal generation. When a candle's score exceeds certain thresholds (defined by your Risk Level setting), it becomes a candidate for signal generation. However, not all high-scoring candles generate trading signals - the indicator applies additional pattern recognition and contextual filters. For example, a strongly positive score (lime candle) in an established uptrend may trigger a "Trend Following" signal, while a strongly negative score (red candle) in a downtrend might generate a "Trend following Short" signal. Similarly, contrarian signals are generated when specific reversal patterns occur alongside appropriate Global Score values, often involving wick analysis and pivot point interactions. This multi-layer approach helps filter out false positives and identify higher-probability trading setups.
❓ Q: What's the difference between "Trend following" and "Contrarian" signals in the script? A: "Trend Following" signals follow the identified trends while "Contrarian" signals anticipate potential trend reversals.
❓ Q: Why don't I see any signals on my chart? A: Make sure you're viewing a USDT Perpetual pair from your selected exchange that belongs to the crypto category you've chosen to analyze. For example, if you've selected the "Top Major Coins" category with Binance as your exchange, you need to view a chart of one of those specific pairs (like BINANCE:BTCUSDT.P) to see signals. If you switch exchanges, for example from Binance to Bybit, you need to pull a Bybit pair on the chart to see backtesting data and signals.
❓ Q: Does this indicator guarantee profits? A: No. Trading cryptocurrencies involves significant risk, and past performance is not indicative of future results. This indicator is a tool to help you identify potential trading setups, but it does not and cannot guarantee profits.
❓ Q: Does this indicator repaint or use lookahead bias? A: No. All trading signals generated by this indicator are based only on completed price data and do not repaint. The system is designed to ensure that backtesting results reflect as closely as possible what you should experience in live trading.
While reference levels like pivot points are kept stable throughout the day using lookahead on, the actual buy and sell signals are calculated using only historical data (lookahead off) that would have been available at that moment in time. This ensures reliability and consistency between backtesting and real-time trading performance.
Technical Setup
❓ Q: What exchanges are supported? A: The strategy supports BINANCE, BYBIT, BITGET, GATEIO, and OKX USDT Perpetual markets (i.e. all the Exchanges you can connect to your 3Commas account for USDT Perpetual trading, excluding Coinbase Perpetual that offers USDC pairs, instead of USDT).
❓ Q: What timeframe should I use? A: The indicator is optimized for the 1-hour (1H) timeframe but may run on any timeframe.
❓ Q: How many coins can I trade at once? A: You can trade all coins within the selected category. You can activate categories by setting up alerts.
❓ Q: How many alerts do I need to set up? A: You need to set up one alert for each crypto category you want to trade. We recommend starting with one category, testing the results carefully, monitoring performance daily, and perhaps activating additional categories in a second stage.
❓ Q: Are there any specific risk management features built into the indicator? A: Yes, the indicator includes risk management features: adjustable maximum trades per hour/category, the ability to enable/disable long or short signals depending on market conditions, customizable trade size for both long and short positions, and different sensitivity/risk level settings.
❓ Q: What happens if 3Commas can't execute a signal? A: If 3Commas cannot execute a signal (due to insufficient funds, bot offline, etc.), the trade will be skipped. The indicator will continue sending signals for other valid setups, but it doesn't retry failed signals.
❓ Q: Can I run this indicator on multiple charts at once? A: Yes, but it's not necessary. The indicator analyzes all coins in your selected categories regardless of which chart you apply it to. For optimal resource usage, apply it to a single chart of a USDT Perpetual pair from your selected exchange. To stop trading a category, simply delete the alert created for that category.
❓ Q: How frequently does the indicator scan for new signals? A: The indicator scans all coins in your selected categories at the close of each bar (every hour if you selected the 1H timeframe).
----------------------------------------------
⚠️
Disclaimer
This indicator is for informational and educational purposes only and does not constitute financial advice. Trading cryptocurrencies involves significant risk, including the potential loss of all invested capital, and past performance is not indicative of future results.
Always conduct your own thorough research (DYOR) and understand the risks involved before making any trading decisions. Trading with leverage significantly amplifies both potential profits and losses - exercise extreme caution when using leverage and never risk more than you can afford to lose.
The Bot ID and Email Token information are transmitted directly from TradingView to 3Commas via secure connections. No third party or entity will ever have access to this data (including the Author). Do not share your 3Commas credentials with anyone.
This indicator is not affiliated with, endorsed by, or sponsored by TradingView or 3Commas.

3Commas Multicoin Scalper PRO [SwissAlgo]Introduction
Are you tired of tracking dozens of cryptocurrency charts and placing orders manually on your Exchange?
The 3Commas Multicoin Scalper PRO is an automated trading system designed to simultaneously identify and execute potential trading setups on multiple cryptocurrencies on your preferred Exchange (Binance, Bybit, OKX, Gate.io, Bitget) via 3Commas integration.
It analyzes price action, volume, momentum, volatility, and trend patterns across 180+ USDT Perpetual coins divided into 17 crypto categories , providing real-time signals directly to your 3Commas bots for automated trade execution. This indicator aims to identify potential trend-following and contrarian setups in both bull and bear markets.
-------------------------------------
What it Does
The 3Commas Multicoin Scalper PRO is a technical analysis tool that monitors multiple cryptocurrency pairs simultaneously and connects with 3Commas for signal delivery and execution.
Here's how the strategy works:
🔶 Technical Analysis : Analyzes price action, volume, momentum, volatility, and trend patterns across multiple USDT Perpetual Futures contracts simultaneously.
🔶 Pattern Detection : Identifies specific candle patterns and technical confluences that suggest potential trading setups across all USDT.P contracts of the selected categories
🔶 Signal Generation : When technical criteria are met at bar close, the indicator creates deal-start signals for the relevant pairs.
🔶 3Commas Integration : Packages these signals and delivers them to 3Commas through TradingView alerts, allowing 3Commas bots to receive specific pair information ('Deal-Start' signals).
🔶 Category Management : Each TradingView alert monitors an entire category (approximately 11 pairs), allowing selective activation of different crypto categories.
🔶 Visual Feedback : Provides color-coded candles and backgrounds to visualize technical conditions, with optional pivot points and trend visualization.
Candle types:
Signals:
-------------------------------------
Quick Start Guide
1. Setup 3Commas Bots : Configure two DCA bots in 3Commas (All USDT pairs) - one for LONG positions and one for SHORT positions.
2. Define Trading Parameters : Set your budget for each trade and adjust your preferred sensitivity within the indicator settings.
3. Create Category Alerts : Set up one TradingView alert for each crypto category you want to trade.
That's it! Once configured, the system automatically sends signals to your 3Commas bots when predefined trading setups are detected across coins in your selected/activated categories. The indicator scans all coins at bar close (for example, every hour on the 1H timeframe) and triggers trade execution only for those showing technical confluences.
Important : The more categories you activate by setting TradingView alerts, the more signals your 3Commas bots will receive. Consider your total capital when enabling multiple categories. More details about the setup process are provided below (see paragraph "Detailed Setup & Configuration")
-------------------------------------
Built-in Backtesting
The 3Commas Multicoin Scalper PRO includes backtesting visualization for each coin. When viewing any USDT Perpetual pair on your chart, you can visualize how the strategy would have performed historically on that specific asset.
Color-coded candles and signal markers show past trading setups, helping you evaluate which coins responded best to the strategy. This built-in backtesting capability can support your selection of assets/categories to trade before deploying real capital.
As backtesting results are hypothetical and do not guarantee future performance, your research and analysis are essential for selecting the crypto categories/coins to trade.
The default strategy settings are: Start Capital 1.000$, leverage 25X, Commissions 0.1% (average Taker Fee on Exchanges for average users), Order Amount 200$ for Longs/150$ for Shorts, Slippage 4
-------------------------------------
Key Features
🔶 Multi-Exchange Support : Compatible with BINANCE, BYBIT, BITGET, GATEIO, and OKX USDT Perpetual markets (USDT.P)
🔶 Wide Asset Coverage : Simultaneously analyzes 180+ cryptocurrencies across 17 specialized crypto categories
🔶 Custom Category Option : Create your watchlist with up to 10 custom USDT Perpetual pairs
🔶 3Commas Integration : Seamlessly connects with 3Commas bots to automate trade entries and exits
🔶 Dual Strategy Approach : Identifies both "trend following" and "contrarian" potential setups
🔶 Confluence-Based Signals : Uses a combination of multiple technical factors - price spikes, price momentum, volume spikes, volume momentum, trend analysis, and volatility spikes - to generate potential trading setups
🔶 Risk Management : Adjustable sensitivity/risk levels, leverage settings, and budget allocation for each trade
🔶 Visual Indicators : Color-coded candles and trading signals provide visual feedback on market conditions
🔶 Trend Indication : Background colors showing ongoing uptrends/downtrends
🔶 Pivot Points & Daily Open : Optional display of pivot points and daily open price for additional context
🔶 Liquidity Analysis : Optional display of high/low liquidity timeframes throughout the trading week
🔶 Trade Control : Configurable limit for the maximum number of signals sent to 3Commas for execution (per bar close and category)
Available Exchanges
Categories
Custom Category
Trend following/contrarian signals
-------------------------------------
Methodology
The 3Commas Multicoin Scalper PRO utilizes a multi-faceted approach to identify potential trading setups:
1. Price Action Analysis : Detects abnormal price movements by comparing the current candle's range to historical averages and standard deviations, helping identify potential "pump and dump" scenarios or new-trends start
2. Price Momentum : Evaluates the relative strength of bullish vs. bearish price movements over time, indicating the build-up of buying or selling pressure.
3. Volume Analysis: Identifies unusual volume spikes by comparing current volume to historical averages, signaling strong market interest in a particular direction.
4. Volume Momentum : Measures the ratio of bullish to bearish volume, revealing the dominance of buyers or sellers over time.
5. Trend Analysis : Combines EMA slopes, RSI, and Stochastic RSI to determine overall trend direction and strength.
6. Volatility : Monitors the ATR (Average True Range) to detect periods of increased market volatility, which may indicate potential breakouts or reversals
7. Candle Wick Analysis : Evaluates upper and lower wick percentages to detect potential rejection patterns and reversals.
8. Pivot Point Analysis : Uses pivot points (PP, R1-R3, S1-S3) for identifying key support/resistance areas and potential breakout/breakdown levels.
9. Daily Open Reference: Analyzes price action relative to the daily open for potential setups related to price movement vs. the opening price
10. Market Timing/Liquidity : Evaluates high/low liquidity periods, specific days/times of heightened risk, and potential market manipulation timeframes.
11. Boost Factors : Applies additional weight to certain confluence patterns to adjust global scores
These factors are combined into a "Global Score" ranging from -1 to +1 , applied at bar close to the newly formed candles.
Scores above predefined thresholds (configurable via the Sensitivity Settings) indicate strong bullish or bearish conditions and trigger signals based on predefined patterns. The indicator then applies additional filters to generate specific "Trend Following" and "Contrarian" trading signals. The identified signals are packaged and sent to 3Commas for execution.
Pivot Points
Daily open
Market Trend
Liquidity patterns by weekday
-------------------------------------
Who This Strategy Is For?
The 3Commas Multicoin Scalper PRO may benefit:
Crypto Traders seeking to automate their trading across multiple coins simultaneously
3Commas Users looking to enhance their bot performance with advanced technical signals
Busy Traders who want to monitor many market opportunities without constant chart-watching
Multi-strategy traders interested in both trend-following and reversal trading approaches
Traders of Various Experience Levels from intermediate traders wanting to save time to advanced traders seeking to scale their operations
Perpetual Futures Traders on major exchanges (Binance, Bybit, OKX, Gate.io, Bitget)
Swing and Scalp Traders seeking to identify short to medium-term profit opportunities
-------------------------------------
Visual Indicators
The indicator provides visual feedback through:
1. Candlestick Colors :
* Lime: Strong bullish candle (High positive score)
* Blue: Moderate bullish candle (Medium positive score)
* Red: Strong bearish candle (High negative score)
* Purple: Moderate bearish candle (Medium negative score)
* Pale Green/Red: Mild bullish/bearish candle
2. Signal Markers :
* ↗: Trend Following Long signal
* ↘: Trend Following Short signal
* ⤴: Contrarian Long signal
* ⤵: Contrarian Short signal
3. Optional Elements :
* Pivot Points: Daily support/resistance levels (R1-R3, S1-S3, PP)
* Daily Open: Reference price level for the current trading day
* Trend Background: Color-coded background suggesting potential ongoing uptrend/downtrend
* Liquidity Highlighting: Background colors indicating typical high/low market liquidity periods
4. TradingView Strategy Plots and Backtesting Data : Standard performance metrics showing entry/exit points, equity curves, and trade statistics, based on the signals generated by the script.
-------------------------------------
Detailed Setup & Configuration
The indicator features a user-friendly input panel organized in sequential steps to guide you through the complete setup process. Tooltips for each step provide additional information to help you understand the actions required to get the strategy running.
Informative tables provide additional details and instructions for critical setup steps such as 3Commas bot configuration and TradingView alert creation (to activate trading on specific categories).
1. Choose Exchange, Crypto Category & Sensitivity
* Select your USDT Perpetual Exchange (BINANCE, BYBIT, BITGET, GATEIO, or OKX) - i.e. the same Exchange connected in your 3Commas account
* Browse and choose your preferred crypto category, or define your watchlist
* Choose from three sensitivity levels: Default, Aggressive, or Test Mode (test mode is designed to generate way more signals, a potentially helpful feature when you are testing the indicator and alerts)
2. Setup 3Commas Bots and integrate them with the algo
* Create both LONG and SHORT DCA Bots in 3Commas
* Configure bots to accept signals for 'All USDT Pairs' with "TradingView Custom Signal" as deal start condition
* Enter your Bot IDs and Email Token in the indicator settings
* Set a maximum budget for LONG and SHORT trades
* Choose whether to allow LONG trades, SHORT trades, or both, according to your preference and market analysis
* Set maximum trades per bar/category (i.e. the max. number of simultaneous signals that the algo may send to your 3Commas bots for execution at every bar close - every hour if you set the 1H timeframe)
* Access the detailed setup guide table for step-by-step 3Commas configuration instructions
3Commas integration
3. Choose Visuals
* Toggle various optional visual elements to add to the chart: category metrics, fired alerts, coin metrics, daily open, pivot points
* Select a color theme: Dark or Light
4. Activate Trading via Alerts
* Create TradingView alerts for each category you want to trade
* Set alert condition to "3Commas Multicoin Scalper" with "Any alert() function call"
* Set the content of the message filed to: {{Message}}, deleting the default content shown in this text field, to enable proper 3Commas integration (any other text than {{Message}}, would break the delivery trading signals from Tradingview to 3Commas)
* View the alerts setup instruction table for visual guidance on this critical step
Alerts
Fired Alerts
Important Configuration Notes
Ensure that the TradingView chart's exchange matches your selected exchange in the indicator settings and your 3Commas bot settings.
You must configure the same leverage in both the script and your 3Commas bots
Your 3Commas bots must be configured for All USDT pairs
You must enter the exact Bot IDs and Email Token from 3Commas (these remain confidential - no one, including us, has access to them)
If you activate multiple categories without sufficient capital, 3Commas will display " insufficient funds " errors - align your available capital with the number of categories you activate (each deal will use the budget amount specified in user inputs)
You are free to set your Take Profit % / trailing on 3Commas
We recommend not to use DCA orders (i.e. set the number of DCA orders at zero)
Legend of symbols
-------------------------------------
FAQs
General Questions
❓ Q: What is Global Score? A: The Global Score serves as a foundation for signal generation. When a candle's score exceeds certain thresholds (defined by your Risk Level setting), it becomes a candidate for signal generation. However, not all high-scoring candles generate trading signals - the indicator applies additional pattern recognition and contextual filters. For example, a strongly positive score (lime candle) in an established uptrend may trigger a "Trend Following" signal, while a strongly negative score (red candle) in a downtrend might generate a "Trend Following Short" signal. Similarly, contrarian signals are generated when specific reversal patterns occur alongside appropriate Global Score values, often involving wick analysis and pivot point interactions. This multi-layer approach helps filter out false positives and identify higher-probability trading setups.
❓ Q: What's the difference between "Trend following" and "Contrarian" signals in the script? A: "Trend Following" signals follow the identified trends while "Contrarian" signals anticipate potential trend reversals.
❓ Q: Why can't I configure all the parameters? A: We've designed the solution to be plug-and-play to prevent users from getting lost in endless configurations. The preset values have been tested against their trade-offs in terms of financial performance, average trade duration, and risk levels.
❓ Q: Why don't I see any signals on my chart? A: Make sure you're viewing a USDT Perpetual pair from your selected exchange that belongs to the crypto category you've chosen to analyze. For example, if you've selected the "Top Major Coins" category with Binance as your exchange, you need to view a chart of one of those specific pairs (like BINANCE:BTCUSDT.P) to see signals. If you switch exchanges, for example from Binance to Bybit, you need to pull a Bybit pair on the chart to see backtesting data and signals.
❓ Q: Does this indicator guarantee profits? A: No. Trading cryptocurrencies involves significant risk, and past performance is not indicative of future results. This indicator is a tool to help you identify potential trading setups, but it does not and cannot guarantee profits.
❓ Q: Does this indicator repaint or use lookahead bias? A: No. All trading signals generated by this indicator are based only on completed price data and do not repaint. The system is designed to ensure that backtesting results reflect as closely as possible what you should experience in live trading.
While reference levels like pivot points are kept stable throughout the day using lookahead on, the actual buy and sell signals are calculated using only historical data (lookahead off) that would have been available at that moment in time. This ensures reliability and consistency between backtesting and real-time trading performance.
Technical Setup
❓ Q: What exchanges are supported? A: The strategy supports BINANCE, BYBIT, BITGET, GATEIO, and OKX USDT Perpetual markets (i.e. all the Exchanges you can connect to your 3Commas account for USDT Perpetual trading, excluding Coinbase Perpetual that offers UDSC pairs, instead of USDT).
❓ Q: What timeframe should I use? A: The indicator is optimized for the 1-hour (1H) timeframe but may run on any timeframe.
❓ Q: How many coins can I trade at once? A: You can trade all coins within each selected category (up to 11 coins per category in standard categories). You can activate multiple categories by setting up multiple alerts.
❓ Q: How many alerts do I need to set up? A: You need to set up one alert for each crypto category you want to trade. For example, if you want to trade both the "Top Major Coins" and the "DeFi" categories, you'll need to create two separate alerts, one for each category. We recommend starting with one category, testing the results carefully, monitoring performance daily, and perhaps activating additional categories in a second stage.
❓ Q: Are there any specific risk management features built into the indicator? A: Yes, the indicator includes risk management features: adjustable maximum trades per hour/category, the ability to enable/disable long or short signals depending on market conditions, customizable trade size for both long and short positions, and different sensitivity/risk level settings.
❓ Q: What happens if 3Commas can't execute a signal? A: If 3Commas cannot execute a signal (due to insufficient funds, bot offline, etc.), the trade will be skipped. The indicator will continue sending signals for other valid setups, but it doesn't retry failed signals.
❓ Q: Can I run this indicator on multiple charts at once? A: Yes, but it's not necessary. The indicator analyzes all coins in your selected categories regardless of which chart you apply it to. For optimal resource usage, apply it to a single chart of a USDT Perpetual pair from your selected exchange. To stop trading a category delete the alert created for that category.
❓ Q: How frequently does the indicator scan for new signals? A: The indicator scans all coins in your selected categories at the close of each bar (every hour if you selected the 1H timeframe).
3Commas Integration
❓ Q: Do I need a 3Commas account? A: Yes, a 3Commas account with active DCA bots (both LONG and SHORT) is required for automated trade execution. A paid subscription is needed, as multipair Bots and multiple simultaneous deals are involved.
❓ Q: How do I set the leverage? A: Set the leverage identically in both the indicator settings and your 3Commas DCA bots (the max supported leverage is 50x). Always be careful about leverage, as it amplifies both profits and losses.
❓ Q: Where do I find my 3Commas Bot IDs and Email Token? A: Open your 3Commas DCA bot and scroll to the "Messages" section. You'll find the Bot ID and Email Token within any message (e.g., "Start Deal").
Display Settings
❓ Q: What does the Sensitivity setting do? A: It adjusts the sensitivity of signal generation. "Default" provides a balanced approach with moderate signal frequency. "Aggressive" lowers the thresholds for signal generation, potentially increasing trade frequency but may include more noise. "Test Mode" is the most sensitive setting, useful for testing alert configurations but not recommended for live trading. Higher risk levels may generate more signals but with potentially lower average quality, while lower risk levels produce fewer but potentially better signals.
❓ Q: What does "Show fired alerts" do? A: The "Show fired alerts" option displays a label on your chart showing which signals have been fired and sent to 3Commas during the most recent candle closes. This visual indicator helps you confirm that your alerts are working properly and shows which coins from your selected category have triggered signals. It's useful when setting up and testing the system, allowing you to verify that signals are being sent to 3Commas as expected and their frequency over time.
❓ Q: What does "Show coin/token metrics" do? A: This toggle displays detailed technical metrics for the specific coin/token currently shown on your chart. When enabled, it shows statistics for the last closed candle for that coin.
❓ Q: What does "Show most liquid days/times" do? A: This toggle displays color-coded background highlighting to indicate periods of varying market liquidity throughout the trading week. Green backgrounds show generally higher liquidity periods (typically weekday trading hours), yellow highlights potentially manipulative periods (often Sunday/Monday overnight), and gray indicates low liquidity periods (when major markets are closed or during late hours).
⚠️ Disclaimer
This indicator is for informational and educational purposes only and does not constitute financial advice. Trading cryptocurrencies involves significant risk, including the potential loss of all invested capital, and past performance is not indicative of future results.
Always conduct your own thorough research (DYOR) and understand the risks involved before making any trading decisions. Trading with leverage significantly amplifies both potential profits and losses - exercise extreme caution when using leverage and never risk more than you can afford to lose.
The Bot ID and Email Token information are transmitted directly from TradingView to 3Commas via secure connections. No third party or entity will ever have access to this data (including the Author). Do not share your 3Commas credentials with anyone.
This indicator is not affiliated with, endorsed by, or sponsored by TradingView or 3Commas.

[3Commas] Turtle StrategyTurtle Strategy
🔷 What it does: This indicator implements a modernized version of the Turtle Trading Strategy, designed for trend-following and automated trading with webhook integration. It identifies breakout opportunities using Donchian channels, providing entry and exit signals.
Channel 1: Detects short-term breakouts using the highest highs and lowest lows over a set period (default 20).
Channel 2: Acts as a confirmation filter by applying an offset to the same period, reducing false signals.
Exit Channel: Functions as a dynamic stop-loss (wait for candle close), adjusting based on market structure (default 10 periods).
Additionally, traders can enable a fixed Take Profit level, ensuring a systematic approach to profit-taking.
🔷 Who is it for:
Trend Traders: Those looking to capture long-term market moves.
Bot Users: Traders seeking to automate entries and exits with bot integration.
Rule-Based Traders: Operators who prefer a structured, systematic trading approach.
🔷 How does it work: The strategy generates buy and sell signals using a dual-channel confirmation system.
Long Entry: A buy signal is generated when the close price crosses above the previous high of Channel 1 and is confirmed by Channel 2.
Short Entry: A sell signal occurs when the close price falls below the previous low of Channel 1, with confirmation from Channel 2.
Exit Management: The Exit Channel acts as a trailing stop, dynamically adjusting to price movements. To exit the trade, wait for a full bar close.
Optional Take Profit (%): Closes trades at a predefined %.
🔷 Why it’s unique:
Modern Adaptation: Updates the classic Turtle Trading Strategy, with the possibility of using a second channel with an offset to filter the signals.
Dynamic Risk Management: Utilizes a trailing Exit Channel to help protect gains as trades move favorably.
Bot Integration: Automates trade execution through direct JSON signal communication with your DCA Bots.
🔷 Considerations Before Using the Indicator:
Market & Timeframe: Best suited for trending markets; higher timeframes (e.g., H4, D1) are recommended to minimize noise.
Sideways Markets: In choppy conditions, breakouts may lead to false signals—consider using additional filters.
Backtesting & Demo Testing: It is crucial to thoroughly backtest the strategy and run it on a demo account before risking real capital.
Parameter Adjustments: Ensure that commissions, slippage, and position sizes are set accurately to reflect real trading conditions.
🔷 STRATEGY PROPERTIES
Symbol: BINANCE:ETHUSDT (Spot).
Timeframe: 4h.
Test Period: All historical data available.
Initial Capital: 10000 USDT.
Order Size per Trade: 1% of Capital, you can use a higher value e.g. 5%, be cautious that the Max Drawdown does not exceed 10%, as it would indicate a very risky trading approach.
Commission: Binance commission 0.1%, adjust according to the exchange being used, lower numbers will generate unrealistic results. By using low values e.g. 5%, it allows us to adapt over time and check the functioning of the strategy.
Slippage: 5 ticks, for pairs with low liquidity or very large orders, this number should be increased as the order may not be filled at the desired level.
Margin for Long and Short Positions: 100%.
Indicator Settings: Default Configuration.
Period Channel 1: 20.
Period Channel 2: 20.
Period Channel 2 Offset: 20.
Period Exit: 10.
Take Profit %: Disable.
Strategy: Long & Short.
🔷 STRATEGY RESULTS
⚠️Remember, past results do not guarantee future performance.
Net Profit: +516.87 USDT (+5.17%).
Max Drawdown: -100.28 USDT (-0.95%).
Total Closed Trades: 281.
Percent Profitable: 40.21%.
Profit Factor: 1.704.
Average Trade: +1.84 USDT (+1.80%).
Average # Bars in Trades: 29.
🔷 How to Use It:
🔸 Adjust Settings:
Select your asset and timeframe suited for trend trading.
Adjust the periods for Channel 1, Channel 2, and the Exit Channel to align with the asset’s historical behavior. You can visualize these channels by going to the Style tab and enabling them.
For example, if you set Channel 2 to 40 with an offset of 40, signals will take longer to appear but will aim for a more defined trend.
Experiment with different values, a possible exit configuration is using 20 as well. Compare the results and adjust accordingly.
Enable the Take Profit (%) option if needed.
🔸Results Review:
It is important to check the Max Drawdown. This value should ideally not exceed 10% of your capital. Consider adjusting the trade size to ensure this threshold is not surpassed.
Remember to include the correct values for commission and slippage according to the symbol and exchange where you are conducting the tests. Otherwise, the results will not be realistic.
If you are satisfied with the results, you may consider automating your trades. However, it is strongly recommended to use a small amount of capital or a demo account to test proper execution before committing real funds.
🔸Create alerts to trigger the DCA Bot:
Verify Messages: Ensure the message matches the one specified by the DCA Bot.
Multi-Pair Configuration: For multi-pair setups, enable the option to add the symbol in the correct format.
Signal Settings: Enable the option to receive long or short signals (Entry | TP | SL), copy and paste the messages for the DCA Bots configured.
Alert Setup:
When creating an alert, set the condition to the indicator and choose "alert() function call only".
Enter any desired Alert Name.
Open the Notifications tab, enable Webhook URL, and paste the Webhook URL.
For more details, refer to the section: "How to use TradingView Custom Signals".
Finalize Alerts: Click Create, you're done! Alerts will now be sent automatically in the correct format.
🔷 INDICATOR SETTINGS
Period Channel 1: Period of highs and lows to trigger signals
Period Channel 2: Period of highs and lows to filter signals
Offset: Move Channel 2 to the right x bars to try to filter out the favorable signals.
Period Exit: It is the period of the Donchian channel that is used as trailing for the exits.
Strategy: Order Type direction in which trades are executed.
Take Profit %: When activated, the entered value will be used as the Take Profit in percentage from the entry price level.
Use Custom Test Period: When enabled signals only works in the selected time window. If disabled it will use all historical data available on the chart.
Test Start and End: Once the Custom Test Period is enabled, here you select the start and end date that you want to analyze.
Check Messages: Check Messages: Enable this option to review the messages that will be sent to the bot.
Entry | TP | SL: Enable this options to send Buy Entry, Take Profit (TP), and Stop Loss (SL) signals.
Deal Entry and Deal Exit: Copy and paste the message for the deal start signal and close order at Market Price of the DCA Bot. This is the message that will be sent with the alert to the Bot, you must verify that it is the same as the bot so that it can process properly.
DCA Bot Multi-Pair: You must activate it if you want to use the signals in a DCA Bot Multi-pair in the text box you must enter (using the correct format) the symbol in which you are creating the alert, you can check the format of each symbol when you create the bot.
👨🏻💻💭 We hope this tool helps enhance your trading. Your feedback is invaluable, so feel free to share any suggestions for improvements or new features you'd like to see implemented.
__
The information and publications within the 3Commas TradingView account are not meant to be and do not constitute financial, investment, trading, or other types of advice or recommendations supplied or endorsed by 3Commas and any of the parties acting on behalf of 3Commas, including its employees, contractors, ambassadors, etc.

[3Commas] HA & MAHA & MA
🔷What it does: This tool is designed to test a trend-following strategy using Heikin Ashi candles and moving averages. It enters trades after pullbacks, aiming to let profits run once the risk-to-reward ratio reaches 1:1 while securing the position.
🔷Who is it for: It is ideal for traders looking to compare final results using fixed versus dynamic take profits by adjusting parameters and trade direction—a concept applicable to most trading strategies.
🔷How does it work: We use moving averages to define the market trend, then wait for opposite Heikin Ashi candles to form against it. Once these candles reverse in favor of the trend, we enter the trade, using the last swing created by the pullback as the stop loss. By applying the breakeven ratio, we protect the trade and let it run, using the slower moving average as a trailing stop.
A buy signal is generated when:
The previous candle is bearish (ha_bear ), indicating a pullback.
The fast moving average (ma1) is above the slow moving average (ma2), confirming an uptrend.
The current candle is bullish (ha_bull), showing trend continuation.
The Heikin Ashi close is above the fast moving average (ma1), reinforcing the bullish bias.
The real price close is above the open (close > open), ensuring bullish momentum in actual price data.
The signal is confirmed on the closed candle (barstate.isconfirmed) to avoid premature signals.
dir is undefined (na(dir)), preventing repeated signals in the same direction.
A sell signal is generated when:
The previous candle is bullish (ha_bull ), indicating a temporary upward move before a potential reversal.
The fast moving average (ma1) is below the slow moving average (ma2), confirming a downtrend.
The current candle is bearish (ha_bear), showing trend continuation to the downside.
The Heikin Ashi close is below the fast moving average (ma1), reinforcing bearish pressure.
The real price close is below the open (close < open), confirming bearish momentum in actual price data.
The signal is confirmed after the candle closes (barstate.isconfirmed), avoiding premature entries.
dir is undefined (na(dir)), preventing consecutive signals in the same direction.
In simple terms, this setup looks for trend continuation after a pullback, confirming entries with both Heikin Ashi and real price action, supported by moving average alignment to avoid false signals.
If the price reaches a 1:1 risk-to-reward ratio, the stop will be moved to the entry point. However, if the slow moving average surpasses this level, it will become the new exit point, acting as a trailing stop
🔷Why It’s Unique
Easily visualizes the benefits of using risk-to-reward ratios when trading instead of fixed percentages.
Provides a simple and straightforward approach to trading, embracing the "keep it simple" concept.
Offers clear visualization of DCA Bot entry and exit points based on user preferences.
Includes an option to review the message format before sending signals to bots, with compatibility for multi-pair and futures contract pairs.
🔷 Considerations Before Using the Indicator
⚠️Very important: The indicator must be used on charts with real price data, such as Japanese candlesticks, line charts, etc. Do not use it on Heikin Ashi charts, as this may lead to unrealistic results.
🔸Since this is a trend-following strategy, use it on timeframes above 4 hours, where market noise is reduced and trends are clearer. Also, carefully review the statistics before using it, focusing on pairs that tend to have long periods of well-defined trends.
🔸Disadvantages:
False Signals in Ranges: Consolidating markets can generate unreliable signals.
Lagging Indicator: Being based on moving averages, it may react late to sudden price movements.
🔸Advantages:
Trend Focused: Simplifies the identification of trending markets.
Noise Reduction: Uses Heikin Ashi candles to identify trend continuation after pullbacks.
Broad Applicability: Suitable for forex, crypto, stocks, and commodities.
🔸The strategy provides a systematic way to analyze markets but does not guarantee successful outcomes. Use it as an additional tool rather than relying solely on an automated system.
Trading results depend on various factors, including market conditions, trader discipline, and risk management. Past performance does not ensure future success, so always approach the market cautiously.
🔸Risk Management: Define stop-loss levels, position sizes, and profit targets before entering any trade. Be prepared for potential losses and ensure your approach aligns with your overall trading plan.
🔷 STRATEGY PROPERTIES
Symbol: BINANCE:BTCUSDT (Spot).
Timeframe: 4h.
Test Period: All historical data available.
Initial Capital: 10000 USDT.
Order Size per Trade: 1% of Capital, you can use a higher value e.g. 5%, be cautious that the Max Drawdown does not exceed 10%, as it would indicate a very risky trading approach.
Commission: Binance commission 0.1%, adjust according to the exchange being used, lower numbers will generate unrealistic results. By using low values e.g. 5%, it allows us to adapt over time and check the functioning of the strategy.
Slippage: 5 ticks, for pairs with low liquidity or very large orders, this number should be increased as the order may not be filled at the desired level.
Margin for Long and Short Positions: 100%.
Indicator Settings: Default Configuration.
MA1 Length: 9.
MA2 Length: 18.
MA Calculations: EMA.
Take Profit Ratio: Disable. Ratio 1:4.
Breakeven Ratio: Enable, Ratio 1:1.
Strategy: Long & Short.
🔷 STRATEGY RESULTS
⚠️Remember, past results do not guarantee future performance.
Net Profit: +324.88 USDT (+3.25%).
Max Drawdown: -81.18 USDT (-0.78%).
Total Closed Trades: 672.
Percent Profitable: 35.57%.
Profit Factor: 1.347.
Average Trade: +0.48 USDT (+0.48%).
Average # Bars in Trades: 13.
🔷 HOW TO USE
🔸 Adjust Settings:
The default values—MA1 (9) and MA2 (18) with EMA calculation—generally work well. However, you can increase these values, such as 20 and 40, to better identify stronger trends.
🔸 Choose a Symbol that Typically Trends:
Select an asset that tends to form clear trends. Keep in mind that the Strategy Tester results may show poor performance for certain assets, making them less suitable for sending signals to bots.
🔸 Experiment with Ratios:
Test different take profit and breakeven ratios to compare various scenarios—especially to observe how the strategy performs when only the trade is protected.
🔸This is an example of how protecting the trade works: once the price moves in favor of the position with a 1:1 risk-to-reward ratio, the stop loss is moved to the entry price. If the Slow MA surpasses this level, it will act as a trailing stop, aiming to follow the trend and maximize potential gains.
🔸In contrast, in this example, for the same trade, if we set a take profit at a 1:3 risk-to-reward ratio—which is generally considered a good risk-reward relationship—we can see how a significant portion of the upward move is left on the table.
🔸Results Review:
It is important to check the Max Drawdown. This value should ideally not exceed 10% of your capital. Consider adjusting the trade size to ensure this threshold is not surpassed.
Remember to include the correct values for commission and slippage according to the symbol and exchange where you are conducting the tests. Otherwise, the results will not be realistic.
If you are satisfied with the results, you may consider automating your trades. However, it is strongly recommended to use a small amount of capital or a demo account to test proper execution before committing real funds.
🔸Create alerts to trigger the DCA Bot:
Verify Messages: Ensure the message matches the one specified by the DCA Bot.
Multi-Pair Configuration: For multi-pair setups, enable the option to add the symbol in the correct format.
Signal Settings: Enable whether you want to receive long or short signals (Entry | TP | SL), copy and paste the the messages for the DCA Bots configured.
Alert Setup:
When creating an alert, set the condition to the indicator and choose "alert() function call only.
Enter any desired Alert Name.
Open the Notifications tab, enable Webhook URL, and paste the Webhook URL.
For more details, refer to the section: "How to use TradingView Custom Signals".
Finalize Alerts: Click Create, you're done! Alerts will now be sent automatically in the correct format.
🔷 INDICATOR SETTINGS
MA 1: Fast MA Length
MA 2: Slow MA Length
MA Calc: MA's Calculations (SMA,EMA, RMA,WMA)
TP Ratio: This is the take profit ratio relative to the stop loss, where the trade will be closed in profit.
BE Ratio: This is the breakeven ratio relative to the stop loss, where the stop loss will be updated to breakeven or if the MA2 is greater than this level.
Strategy: Order Type direction in which trades are executed.
Use Custom Test Period: When enabled signals only works in the selected time window. If disabled it will use all historical data available on the chart.
Test Start and End: Once the Custom Test Period is enabled, here you select the start and end date that you want to analyze.
Check Messages: Enable the table to review the messages to be sent to the bot.
Entry | TP | SL: Enable this options to send Buy Entry, Take Profit (TP), and Stop Loss (SL) signals.
Deal Entry and Deal Exit : Copy and paste the message for the deal start signal and close order at Market Price of the DCA Bot. This is the message that will be sent with the alert to the Bot, you must verify that it is the same as the bot so that it can process properly so that it executes and starts the trade.
DCA Bot Multi-Pair: You must activate it if you want to use the signals in a DCA Bot Multi-pair in the text box you must enter (using the correct format) the symbol in which you are creating the alert, you can check the format of each symbol when you create the bot.
👨🏻💻💭 We hope this tool helps enhance your trading. Your feedback is invaluable, so feel free to share any suggestions for improvements or new features you'd like to see implemented.
__
The information and publications within the 3Commas TradingView account are not meant to be and do not constitute financial, investment, trading, or other types of advice or recommendations supplied or endorsed by 3Commas and any of the parties acting on behalf of 3Commas, including its employees, contractors, ambassadors, etc.

Altcoins DCA ScalperIntroduction
The Altcoins DCA Scalper is a Pine Strategy Script designed to automate Altcoins trading through 3Commas integration. It implements a Dollar-Cost Averaging (DCA) strategy that expands upon 3Commas' standard DCA capabilities, helping to manage risk while trading both long and short positions automatically.
This tool aims to assist both beginners exploring automated trading and experienced 3Commas users seeking dynamic DCA automation. The script is specifically designed for the 1-minute timeframe , where it has shown a good balance between performance and risk management. Complete setup typically takes less than 10 minutes, with a detailed guide making configuration straightforward for users of all experience levels.
------------------------------
🔶 What is DCA?
------------------------------
Dollar-cost averaging (DCA) refers to the practice of gradually increasing your position size at lower prices when trading long, or at higher prices when trading short, to achieve a better average entry price if the market moves against the initial entry . Instead of investing all capital at once, which could result in a significant drawdown if the price moves unfavorably, DCA spreads entries across different price levels to help manage potential drawdowns as they occur.
In this script, DCA is implemented through a system that:
🔹 Triggers safety orders only when/if needed (if take profit isn't reached quickly)
🔹 Dynamically adjusts order sizing based on market volatility
🔹 Automatically reduces take profit targets after each DCA order to increase the likelihood of a positive outcome
🔹 Can handle drawdowns depending on market volatility and settings
The images below illustrate two scenarios: one where an entry reaches the take profit directly, without activating DCA orders, and another where DCA is utilized, with the order closing positively after two DCA orders.
Case 1: Order closes in profit after entry
Case 2: Order closes in profit after 2 DCA orders (dynamically placed based on trend and volatility)
This DCA implementation aims to enhance standard 3Commas DCA by adding market-adaptive features while maintaining risk management principles.
------------------------------
🔶 Could this strategy script benefit you?
------------------------------
This script may be helpful if you are:
✅ Looking to automate your trading through 3Commas integration while maintaining full control of your assets
✅ Wanting to enhance 3Commas' standard DCA with market-adaptive features that consider:
Multi-timeframe trend analysis
Real-time volatility assessment
Dynamic safety order sizing and timing
✅ Seeking to minimize chart monitoring through full automation of:
Entry and exit decisions
Safety order management
Risk controls
✅ Interested in comprehensive performance tracking with:
Real-time position metrics
Detailed backtesting capabilities
Risk/reward analysis
Backtesting Metrics (script performance over the backtesting period - which is approx. 15 days on the 1min timeframe with the TradingView Pro Plan):
Current/Open Deal Metrics (the deal is currently under DCA, and waiting for further actions to close):
✅ Looking for trading automation that remains easy to set up and use
Note: While this script provides trading automation, successful trading requires proper education, risk management, and regular performance monitoring. No automated tool can guarantee trading success or profits.
------------------------------
🔶 How it Works
------------------------------
The Altcoins DCA Scalper provides trading automation through:
Market Analysis
* Multi-timeframe trend analysis (1m to 1d) for market direction and entry validation
* Volatility assessment (1h, 4h, 24h) benchmarked against TOTAL3 (excluding Top10 Altcoins and Stablecoins)
* Real-time adjustment of DCA parameters based on:
* Current volatility class (low/medium/high) vs. overall Altcoins market
* Market trend strength
* Price action dynamics
Trading Execution
* Position opening aligned with detected market trends
* "Beast Mode" base order sizing that increases position size during strong trends
* Dynamic take-profit targets that automatically reduce after each safety order to increase the likelihood of positive exits
* Dynamic DCA with safety orders that can:
* Adapt timing based on volatility
* Scale order sizes based on market conditions
* Handle 30-50% drawdowns depending on volatility class
* Execute up to 6 safety orders per position
Risk Management
* Emergency exits during extreme market events:
* "Black Swan" protection for long positions
* "God-Candle" protection for short positions
* Configurable stop-loss with volatility-based placement
* Trend-switch management with automated position reversal
* Position aging controls to prevent capital lock-up
* Leveraged trading protection with a pre-liquidation exit system
Integration & Automation
* Quick setup with two 3Commas bots (typically under 10 minutes)
* Fully automated signal generation and execution through 3Commas
* Detailed performance tracking including:
* Real-time position metrics
* DCA depth analysis
* Win rate and ROE calculations
* Pre-configured settings optimized for most pairs
* Multiple customization options for experienced users
Note: While this strategy employs automation and risk management, trading always carries the risk of loss. No system can guarantee profits, and market conditions significantly impact performance. Always do your own research and monitor your positions closely.
------------------------------
How to Use
------------------------------
Setting up the Altcoins DCA Scalper is quick and facilitated by the User Interface:
1️⃣ 3Commas/TradingView Setup
* Create two 3Commas accounts if using the FREE plan:
* One account for Long Bot
* One account for Short Bot
* This split allows full functionality while staying within 3Commas' free tier limits
* You do not need two separate accounts if you have a Paid 3Commas subscription
* While a free TradingView account works with the script, it limits you to one trading pair and a 4-day backtesting history. A paid TradingView subscription removes these limitations (such as the "Essential" plan).
2️⃣ Bot Configuration
* Create one Long and one Short DCA Bot in 3Commas
* Follow the setup guide available in the script itself for hassle-free configuration
* Copy Bot IDs and Email Token for script connection
* No complex settings needed - the script manages all DCA parameters by itself
3️⃣ Script Implementation
* Apply the script to your TradingView charts
* Use the built-in backtesting to analyze performance on different pairs
* Focus on USDT.P futures pairs with good volatility
4️⃣ Trading Activation
* Create TradingView alerts for each trading pair you want to activate
* Example: Set an alert for BINANCE: XRPUSDT.P following the in-script guide
* The script automatically manages all aspects:
* Entry and exit decisions
* DCA execution
* Risk management
* Position monitoring
Capital Requirements
* Important: Ensure sufficient capital to cover all activated pairs
* Consider volatility class when allocating capital to specific pairs
Once setup is complete, the script operates fully automatically while you maintain complete control of your funds through 3Commas and your exchange.
Note: While the setup is straightforward, always start with a small number of pairs and monitor performance before expanding. Trade responsibly and never risk more than you can afford to lose.
------------------------------
Explaining the Settings
------------------------------
The Altcoins DCA Scalper offers mulitple customization options during the setup process. All settings include detailed tooltips and default values.
Core Settings Sections:
1️⃣ 3Commas Connection
* Bot IDs and Email Token configuration
* Leverage settings (1x to 5x supported)
* Detailed 3Commas bot setup guide included
* Automatic bot control configuration
2️⃣ Trading Parameters
* Capital allocation per trade
* Timeframe verification
* Alert system setup
* Backtesting period control
* Performance tracking preferences
3️⃣ Advanced Features
🔹 Risk Management Suite
* Emergency exit controls (to strengthen protection against extraordinary market events)
* Customizable stop-loss system
* Trend-based exit management
* Position aging controls
* Liquidation protection features
* Advanced DCA controls
🔹 Performance Analytics
* Real-time position monitoring
* Comprehensive backtesting metrics
* DCA depth analysis
* Win rate calculations
* Capital efficiency tracking
🔹 Technical Optimizations
* Exchange minimum order adjustment
* Trading pair name override capability
* System stability controls
* Error handling mechanisms
🔹 Interface Customization
* Theme selection
* Chart overlay options
* Warning display preferences
* Performance metrics visibility
All settings come pre-configured but can be fully customized based on your trading preferences and risk tolerance. The script includes tooltips and setup guides for each option.
Note: While default settings may be tested, market conditions vary and all trading involves risk. Monitor performance and adjust settings according to your risk management requirements.
------------------------------
Frequently Asked Questions
------------------------------
Here are some common questions you may have, and our answers:
❓ Is this tool only for experts? I'm new to algo trading, can I use it?
No, the Altcoins DCA Scalper could be used by both beginners and experienced traders. The setup process is guided, and the algorithm handles all the calculations in the background.
❓ I'm not familiar with 3Commas. Is that a problem?
While the script is designed to work with 3Commas, a step-by-step guide is provided within the script to help you set up your 3Commas accounts and bots, if needed.
❓ Do I need to constantly monitor the script after it's set up?
No, after the initial setup and configuration, the script operates autonomously. It handles all aspects of trading including entries, exits, DCA management, and risk controls. However, we recommend:
* Checking performance metrics daily
* Reviewing position statistics weekly
* Adjusting pair selection monthly based on performance
* Monitoring overall market conditions that might require adjustments
❓ Can I use it with leverage?
Yes, the script is designed to work with leverage up to 5x on perpetual futures pairs (USDT.P). It includes specific features for leveraged trading:
* Dynamic safety order placement based on distance to liquidation
* Pre-liquidation exit system to minimize exchange fees
* Adjustable take-profit targets optimized for leveraged positions
* Emergency exit system for extreme market movements
* Optional risk controls specific to leverage:
* Automatic exit in the liquidation danger zone
* Position size scaling based on leverage level
* Safety order adjustments for different leverage settings
While leverage can amplify returns, it also increases risk. We recommend starting with lower leverage (2x), or no leverage at all, until familiar with the script's operation.
❓ Does this script guarantee profits?
No, no script or trading strategy can guarantee profits. The Altcoins DCA Scalper provides a framework for implementing an automated DCA strategy, but your success will depend on many different factors and conditions.
❓ Do I need to understand the complex algorithms used in the script?
No, it’s not necessary. The logic is handled by the script, and you do not need to understand every detail to use it effectively. However, a basic knowledge of DCA concepts will be beneficial.
❓ Can I use this script with spot or leveraged trades?
The script is optimized for USDT.P pairs (perpetual futures) with leverage up to 5x. This allows:
* Automatic long/short position management
* Increased capital utilization
* Full DCA functionality without holding the underlying assets
* Enhanced risk management features specific to futures
While spot trading is possible, it requires holding underlying assets for shorts and doesn't access the script's full capabilities.
❓What timeframe should I use?
This script is optimized for the 1-minute timeframe , which is the recommended setting for the best balance between performance, capital efficiency, and risk. While we recommend using the tool on the 1 minute TF, it would work on other timeframes too.
❓ What happens if my internet/computer goes down?
Since the script sends signals from Tradingview to 3Commas (which executes trades on your exchange), your positions and DCA management continue to function even if your TradingView chart is closed or your computer is off. The script only needs to be active to generate new signals.
❓ How are the DCA parameters determined?
The script dynamically adjusts DCA parameters based on:
* The pair's volatility class (compared to the overall altcoin market)
* Current market conditions and volatility
* Position direction (long/short)
* Leverage settings
* Number of safety orders already executed
This allows for adaptive/dynamic DCA compared to static or %-based parameters.
❓ What exchanges are supported?
The script works with any exchange supported by 3Commas for futures trading (approximately 15 different crypto Exchanges). However, it's optimized for Binance Futures (USDT.P pairs) due to its high liquidity and for consistency.
❓ What happens during extreme market conditions?
The script includes some (optional) protective measures that can be activated:
* Emergency exits during sharp and abnormal market moves
* Automatic adjustment of DCA parameters during high volatility
* Position closure on significant trend changes
* Special handling of aged positions
These features aim to protect capital during unusual market conditions.
❓How many pairs can I trade simultaneously?
This depends on your total capital. As a general indication, define the number of pairs to activate based on:
* Total available capital
* Desired position size per pair
* Risk tolerance
* Pairs' volatility class
------------------------------
Final Thoughts
------------------------------
We believe that your trading performance will greatly depend on your selection of appropriate trading pairs for this script (high volatility), and your commitment to regularly monitoring its performance and adjust the settings, rather than on the script alone.
------------------------------
⚠️ Risk Disclaimer
------------------------------
Remember that trading involves risk, and most day traders experience losses. This script is for educational and informational purposes only. Past performance does not guarantee future results. This is not financial advice, and you should always do your own research (DYOR). Trade responsibly with capital you can afford to lose.
The Altcoins DCA Scalper is an independent tool and is not endorsed, connected, or validated by TradingView.
3Commas is a third-party service, and TradingView is not responsible for the 3Commas integration or the performance of 3Commas bots. You are solely responsible for the security and management of your 3Commas account. Do not share your 3Commas access credentials (like login information, Bots-ID, Email Token) with anyone. The Author of the script has no access to such information, and nobody (but you) should.

[3Commas] Alligator StrategyThe Alligator Strategy
🔷 What it does: This script implements the Alligator Strategy, a trend-following method created by Bill Williams. It uses three customizable moving averages (SMMAs or RMAs) "Jaws," "Teeth," and "Lips" to identify market trends and potential trade opportunities. Additionally, it includes built-in stop-loss and take-profit options for enhanced risk management.
🔷 Who is it for:
Trend Traders: Those who prefer trading in markets with clear directional movement.
Advanced Users: Traders who require customizable tools and dynamic risk management features.
Beginners: Accessible to those new to trading, thanks to its intuitive visual representation of trends and pre-configured settings.
Bot Users: Supports direct signal integration for bot automation, including entries, take-profits, and stop-losses.
🔷 How does it work: The Alligator Jaws, Teeth, and Lips are smoothed moving averages (SMA, EMA, RMA, or WMA) calculated based on the selected source price ( hl2 = (high+low)/2 by default). Their lengths and offsets are customizable:
Jaws: Length 21 , offset 13.
Teeth: Length 13, offset 8.
Lips: Length 8 , offset 5.
When the lines align and spread apart (e.g., Lips > Teeth > Jaws for an uptrend), the strategy identifies a trending market.
Entry Conditions:
Long Trades: Triggered when Close > Lips > Teeth > Jaws.
Short Trades: Triggered when Close < Lips < Teeth < Jaws.
🔷 Why it’s unique:
Customization: Flexible settings for moving average types and lengths to adapt to different market conditions and strategy tester configurations.
Built-in Filters: Trend filters that can reduce false signals in certain scenarios, making it more reliable for trending markets.
Take Profit and Stop Loss:
Configurable as either percentage-based or dynamic.
Stop-loss levels adjust dynamically using the Alligator lines.
Fast exit logic moves the stop-loss closer to the price when trades are in profit.
3Commas Bot Compatibility: Designed for automated trading, allowing traders to configure and execute the strategy seamlessly.
🔷 Considerations Before Using the Indicator
🔸Why the Forward Offset: By shifting the averages forward, the Alligator helps traders focus on established trends while filtering out short-term market noise.
The standard configurations of 13-8, 8-5, and 5-3 were selected based on Bill Williams’ studies of market behavior. However, these values can be adjusted to suit different market conditions:
Volatile Markets: Faster settings (e.g., 10-6, 6-4, 3-2) may provide earlier signals.
Less Volatile Markets: Slower settings (e.g., 21-13, 13-8, 8-5) can help avoid noise and reduce false signals.
🔸Best Timeframes to Use: The Alligator can be applied across all timeframes, but certain timeframes offer better reliability.
Higher Timeframes (H4, D1, W1): Ideal for identifying significant trends and for swing or position trading.
Lower Timeframes: Not recommended due to increased noise but may work for scalping with additional confirmation tools.
🔸Disadvantages of the Alligator Strategy:
Exhausted Entry Levels: High buying levels or low selling levels can lead to momentum exhaustion and potential pullbacks.
False Signals in Ranges: Consolidating markets can produce unreliable signals.
Lagging Indicator: As it is based on moving averages, it may delay reacting to sudden price changes.
🔸Advantages of the Alligator Strategy:
Trend Focused: Simplifies the identification of trending markets.
Noise Reduction: Forward shifts and smoothed averages help filter out short-term price fluctuations.
Broad Applicability: Suitable for forex, crypto, stocks, and commodities.
🔸Important Considerations:
While the Alligator Strategy provides a systematic way to analyze markets, it does not guarantee successful outcomes. Results in trading depend on multiple factors, including market conditions, trader discipline, and risk management. Past performance of the strategy does not ensure future success, and traders should always approach the market with caution.
Risk Management: Define stop-loss levels, position size, and profit targets before entering any trade. Be prepared for the possibility of losses and ensure that your approach aligns with your overall trading plan.
🔷 STRATEGY PROPERTIES
Symbol: BINANCE:BTCUSDT (Spot).
Timeframe: 1D (Daily Timeframe).
Test Period: All historical data available.
Initial Capital: 10000 USDT.
Order Size per Trade: 1% of Capital, you can use a higher value e.g. 5%, be cautious that the Max Drawdown does not exceed 10%, as it would indicate a very risky trading approach.
Commission: Binance commission 0.1%, adjust according to the exchange being used, lower numbers will generate unrealistic results. By using low values e.g. 5%, it allows us to adapt over time and check the functioning of the strategy.
Slippage: 5 ticks, for pairs with low liquidity or very large orders, this number should be increased as the order may not be filled at the desired level.
Margin for Long and Short Positions: 100%.
Indicator Settings: Default Configuration.
Alligator: Source hl2 | Calculation RMA | Jaw 21-13, Teeth 13-8, Lips 8-5.
Strategy: Long & Short.
Max Stop Loss per Trade: 10% of Trade Size.
Exit trades on opposite signal: Enable.
Alligator Stop Loss: Enable.
Alligator Fast Exit: Enable.
🔷 STRATEGY RESULTS
⚠️ Remember, past results do not guarantee future performance.
Net Profit: +355.68 USDT (+3.56%).
Total Closed Trades: 103.
Percent Profitable: 47.57%.
Profit Factor: 1.927.
Max Drawdown: -57.99 USDT (-0.56%).
Average Trade: +3.45 USDT (+3.41%).
Average # Bars in Trades: 16.
🔷 HOW TO USE
🔸Adjust the Alligator Settings:
The default values generally work well: Source hl2 | Calculation RMA | Jaw 21-13, Teeth 13-8, Lips 8-5. However, if you want to use it on timeframes smaller than 4H (4 hours), consider increasing the values to better filter market noise.
Please review the "Indicator Settings" section for configuration.
🔸Choose a Symbol that Typically Trends:
Select an asset that tends to create trends. However, the Strategy Tester results may display poor performance, making it less suitable for sending signals to bots.
🔸Add Trend Filters:
You can enable trend filters like MA and SuperTrend. By default, these are disabled as they are often unnecessary, but you can experiment with their configuration to see if they optimize the strategy's results.
Please review the "Indicator Settings" section for configuration.
🔸Enable Stop Loss Levels:
Activate Stop Loss features, such as Stop Loss % or Alligator Stop Loss. If both are enabled, the one closest to the price during the trade will be applied.
Please review the "Indicator Settings" section for configuration.
🔸Enable Take Profit Levels:
Activate Take Profit options, such as Take Profit % or Alligator Fast Exit. If both are enabled, the one that triggers first will be executed.
Please review the "Indicator Settings" section for configuration.
This is an example with the default settings and how Alligator Stop Loss and Alligator Fast Exit are activated:
In this example, we additionally enable the Take Profit at 10%. We can observe that the Alligator Stop Loss is the active one since it is closer to the price. When the price moves 10% in favor or against the trade, the position is closed. Although the Alligator Fast Exit is enabled, it does not activate because the trades are closed beforehand.
🔸Results Review:
It is important to check the Max Drawdown. This value should ideally not exceed 10% of your capital. Consider adjusting the trade size to ensure this threshold is not surpassed.
Remember to include the correct values for commission and slippage according to the symbol and exchange where you are conducting the tests. Otherwise, the results will not be realistic.
If you are satisfied with the results, you may consider automating your trades. However, it is strongly recommended to use a small amount of capital or a demo account to test proper execution before committing real funds.
🔸Create alerts to trigger the DCA Bot
Verify Messages: Ensure the message matches the one specified by the DCA Bot.
Multi-Pair Configuration: For multi-pair setups, enable the option to add the symbol in the correct format.
Signal Settings: Enable whether you want to receive long or short signals (Entry | TP | SL), copy and paste the the messages for the DCA Bots configured in 3Commas.
Alert Setup:
When creating an alert, set the condition to the indicator and choose "alert() function call only.
Enter any desired Alert Name.
Open the Notifications tab, enable Webhook URL, and paste the Webhook URL from 3Commas.
For more details, refer to the 3Commas section: "How to use TradingView Custom Signals.
Finalize Alerts: Click Create, you're done! Alerts will now be sent automatically in the correct format to 3Commas.
🔷 INDICATOR SETTINGS
🔸Alligator Settings
MA's source: Source price for Alligator moving averages.
MA's Type: Type of calculation for MA's.
Jaw and Offset: Jaw length and offset to the right.
Teeth and Offset: Teethlength and offset to the right.
Lips and Offset: Lips length and offset to the right.
🔸Alligator Style
Plot Alligator: Show Alligator Ribbon.
Plot MA's: Show Alligator MA's.
Colors: Main and Gradient Colors for Bullish Alligator, Berish Alligator, Neutral Alligator. For gradient colors it is recommended to use an opacity of 15.
🔸MA & SuperTrend Filters
MA & Plot: Activate MA Filter and Plot MA on the chart.
Long Entries: When activated, it will only execute entries if the price is above the MA
Short Entries: When activated, it will only execute entries if the price is below the MA.
Source: Source price for moving average calculations.
Length: Candles to be used by the MA calculations.
Type: Type of calculation for MA.
Timeframe: Here you can select a larger timeframe for the filter.
ST & Plot: Activate SuperTrend Filter and Plot SuperTrend on the chart.
Long Entries: When activated, it will only execute entries if the price is above the SuperTrend.
Short Entries: When activated, it will only execute entries if the price is below the SuperTrend.
Source: Source price for SuperTrend calculations.
Length: Candles to be used by the SuperTrend calculations.
Factor: ATR multiplier of the SuperTrend.
Timeframe: Here you can select a larger timeframe for the filter.
🔸Strategy Tester
Strategy: Order Type direction in which trades are executed.
Take Profit %: When activated, the entered value will be used as the Take Profit in percentage from the entry price level.
Stop Loss %: When activated, the entered value will be used as the Stop Loss in percentage from the entry price level. If Alligator Stop Loss is activated, the closest one to the price will be used.
Exit trades on opposite signal: This option closes the trade if the opposite condition is met. For instance, if we are in a long position and a sell signal is triggered, the long position will be closed, and a short position will be opened. The same applies inversely.
Alligator Stop Loss: In a long trade, the lower part of the Alligator indicator will be used as a dynamic stop loss. Similarly, in a short trade, the upper part of the indicator will be used.
Alligator Fast Exit: Its purpose is to attempt to protect movements in favor of the trade's direction. In the case of long trades, once the price and the upper part of the Alligator indicator are above the trade's entry price, the stop loss will be moved to the upper part. For short trades, once the price and the lower part of the Alligator indicator are below the trade's entry price, the stop loss will be moved to the lower part of the Alligator indicator.
Alligator Squeeze Entry: When activated, entries will only be executed if they meet the condition after a neutral zone of the Alligator indicator.
Alligator Squeeze Exit: When this option is activated, any open trades will be closed when the Alligator indicator enters a neutral mode.
Use Custom Test Period: When enabled signals only works in the selected time window. If disabled it will use all historical data available on the chart.
Test Start and End: Once the Custom Test Period is enabled, here you select the start and end date that you want to analyze.
🔸3Commas DCA Bot Signals
Check Messages: Enable the table to review the messages to be sent to the bot.
Entry | TP | SL: Enable this options to send Buy Entry, Take Profit (TP), and Stop Loss (SL) signals to 3Commas.
Deal Entry and Deal Exit : Copy and paste the message for the deal start signal and close order at Market Price of the DCA Bot you created in 3Commas. This is the message that will be sent with the alert to the Bot, you must verify that it is the same as the 3Commas bot so that it can process properly so that it executes and starts the trade.
DCA Bot Multi-Pair: You must activate it if you want to use the signals in a DCA Bot Multi-pair in the text box you must enter (using the 3Commas format) the symbol in which you are creating the alert, you can check the format of each symbol when you create the bot.
🔷 CONCLUSION
The Alligator Strategy is a valuable tool for identifying potential trends and improving decision-making. However, no trading strategy is foolproof. Careful consideration of market conditions, proper risk management, and personal trading goals are essential. Use the Alligator as part of a broader trading system, and remember that consistent learning and discipline are key to success in trading.
👨🏻💻💭 We hope this tool helps enhance your trading. Your feedback is invaluable, so feel free to share any suggestions for improvements or new features you'd like to see implemented.
____________________________________________________________________
The information and publications within the 3Commas TradingView account are not meant to be and do not constitute financial, investment, trading, or other types of advice or recommendations supplied or endorsed by 3Commas and any of the parties acting on behalf of 3Commas, including its employees, contractors, ambassadors, etc.

[3Commas] DCA Bot TesterDCA Bot Tester
🔷What it does: A tool designed to simulate the behavior of a Dollar Cost Averaging (DCA) strategy based on input signals from a source indicator. Additionally, it enables you to send activation signals to 3Commas Bots via TradingView webhooks.
🔷Who is it for: This tool is ideal for those who want a visual representation and strategy report of how a DCA Bot would perform under specific conditions. By adjusting the parameters, you can assess whether the strategy aligns with your risk/reward expectations before implementation, helping you save time and protect your capital.
🔷How does it work: The tool leverages a pyramiding function to simulate price averaging, mimicking how a DCA Bot operates. It calculates volume-based averaging and, upon reaching the target, closes the positions. Conversely, if the target isn't reached, a Stop Loss is triggered, potentially resulting in significant losses if improperly configured.
🔷Why It’s Unique
Easy visualization of DCA Bot entry and exit points according to user preferences.
DCA Bot Summary table same as the one shown in the new 3Commas interface.
Use plots from other indicators as Entry Trigger Source, with a small modification of the code.
Option to Review message format before sending Signals to 3Commas. Compatibility with Multi-Pair, and futures contract pairs.
Option to filter signals by session and day according to the user’s timezone.
👉 Before continuing with the explanation of the tool, please take a few minutes to read this information, paying special attention to the risks of using DCA strategies.
DCA Bot: What is it, how does it work, and what are its advantages and risks?
A DCA Bot is an automated tool designed to simplify and optimize your trading operations, particularly in cryptocurrencies. Based on the concept of Dollar Cost Averaging (DCA) , this bot implements scaled strategies that allow you to distribute your investments intelligently. The key lies in dividing your capital into multiple orders, known as base orders and safety orders, which are executed at different price levels depending on market conditions.
These bots are highly customizable, meaning you can adapt them to your goals and trading style, whether you're operating Long (expecting a price increase) or Short (expecting a price decrease). Their primary purpose is to reduce the impact of entries that move against the estimated direction and ensure you achieve a more favorable average price.
🔸 Key Features of DCA Bots
Customizable configuration: DCA bots allow you to adjust the size of your initial investment, the number of safety orders, and the price levels at which these orders execute. These orders can be equal or incremental, depending on your risk tolerance.
Scaled safety orders: If the asset's price moves against your position, the bot executes safety orders at strategic levels to average your entry price and increase your chances of closing in profit.
Automatic Take Profit: When the predefined profit level is reached, the bot closes the position, ensuring net gains by averaging all entries made using the DCA strategy.
Stop Loss option: To protect your capital, you can set a stop loss level that limits losses if the market moves drastically against your position.
Flexibility: Bots can integrate with 3Commas technical indicators or external signals from TradingView, allowing you to trade in any trend, whether bullish or bearish.
Support for multiple assets: You can trade cryptocurrency pairs and exchanges compatible with 3Commas, offering a wide range of possibilities to diversify your strategies.
✅ Advantages of DCA Bots
Time-saving automation: DCA bots eliminate the need for constant market monitoring, executing your trades automatically and efficiently based on predefined settings.
Favorable averages in volatile markets: By averaging your entries, the bot can offer more competitive prices even under adverse market conditions. This increases your chances of recovering a position and closing it profitably.
Advanced capital management: With customizable settings, you can adjust the size of base and safety orders to optimize capital usage and reduce risk.
Additional protection: The ability to set a stop loss ensures your losses are limited, safeguarding your capital in extreme scenarios.
⚠️ Risks of Using a DCA Bot
Requires significant capital: Safety orders can accumulate quickly if the price moves against your position. This issue is compounded if increasing amounts are used for safety orders, which can immobilize large portions of capital in adverse markets.
Markets lacking clear direction: During consolidation periods or erratic movements, the bot may generate unrealized losses and make position recovery difficult.
Opportunity cost: Investing in an asset that doesn't show favorable behavior can prevent you from seizing opportunities in other markets.
Emotional pressure: Large investments in advanced stages of the DCA strategy can cause stress, especially if an asset takes too long to reach your take profit level.
Dependence on market recovery: DCA assumes that the price will eventually move in your favor, which does not always happen, especially in assets without solid fundamentals.
📖 Key Considerations for Effectively Using a DCA Bot
Use small amounts for your base and safety orders: Setting small initial orders not only limits capital usage but also allows you to manage multiple bots simultaneously, maximizing portfolio diversification.
Capital management: Define a clear budget and never risk more than you are willing to lose. This is essential for maintaining sustainable operations.
Select assets with strong fundamentals: Apply DCA to assets you understand and that have solid fundamentals and a proven historical growth record. Additionally, analyze each cryptocurrency's fundamentals: What problem does it solve? Does it have a clear use case? Is it viable in the long term? These questions will help you make more informed decisions.
Diversification: Do not concentrate all your capital on a single asset or strategy. Spread your risk across multiple bots or assets.
Monitor regularly: While bots are automated and eliminate the need to monitor the market constantly, it is essential to monitor the bots themselves to ensure they are performing as expected. This includes reviewing their performance and making adjustments if market conditions change. Remember, the goal is to automate trades, but active bot management is crucial to avoid surprises.
A DCA Bot is a powerful tool for traders looking to automate their strategies and reduce the impact of market fluctuations. However, like any tool, its success depends on how it is configured and used. By applying solid capital management principles, carefully selecting assets, and using small amounts in your orders, you can maximize its potential and minimize risks.
🔷FEATURES & HOW TO USE
🔸Strategy: Here you must select the type of signal you are going to analyze and send signals to the DCA Bot, either Long for buy signals or Short for sell signals. This must match the Bot created in 3Commas.
🔸Add a Source Indicator for Entry Triggers
Tradingview allows us to use indicator plots as a source in other indicators, we will use this functionality so that the buy or sell signals of an indicator are processed by the DCA Bot Tester.
In this EXAMPLE we will use a simple strategy that uses a Donchian Channel (DC) and an Exponential Moving Average (EMA).
Trigger to buy or long signal will be when: the price closes above the previous upper level and the average of the upper and lower level (basis) is greater than the EMA.
Trigger sell or short signal will be when: the price closes below the previous lower level and the average of the upper and lower level (basis) is less than the EMA.
trigger_buy = ta.crossover (close,upper ) and basis > ema and barstate.isconfirmed
trigger_sell = ta.crossunder(close,lower ) and basis < ema and barstate.isconfirmed
Then we create the plots that will be used as input source in the DCA Bot Tester indicator.
When a buy condition is given the plot "🟢 Trigger Buy" will have a value of 1 otherwise it will remain at 0.
When a sell condition is given the plot "🔴 Trigger Sell" will have a value of -1 otherwise it will remain at 0.
plot(trigger_buy ? 1 : 0 , '🟢 Trigger Buy' , color = na, display = display.data_window)
plot(trigger_sell? -1 : 0 , '🔴 Trigger Sell', color = na, display = display.data_window)
Here you have the complete code so you can use it and do tests. Basically you just have to define the buy or sell conditions of your preferred indicator or strategy and then create the plots with the same format that will be used in DCA Bot Tester.
//@version=6
indicator(title="Simple Strategy Example", overlay= false)
// Indicator and Signal Triggers
length = input.int(10, title = "DC Length" , display = display.none)
length_ema = input.int(50, title = "EMA Length", display = display.none)
lower = ta.lowest (length)
upper = ta.highest(length)
ema = ta.ema (close, length_ema)
basis = math.avg (upper, lower)
plot(basis, "Basis", color = color.orange, display = display.all-display.status_line)
plot(upper, "Upper", color = color.blue , display = display.all-display.status_line)
plot(lower, "Lower", color = color.blue , display = display.all-display.status_line)
plot(ema , "EMA" , color = color.red , display = display.all-display.status_line)
candlecol = open < close ? color.teal : color.red
plotcandle(open, high, low, close, title='Candles', color = candlecol, wickcolor = candlecol, bordercolor = candlecol, display = display.pane)
trigger_buy = ta.crossover (close,upper ) and basis > ema and barstate.isconfirmed
trigger_sell = ta.crossunder(close,lower ) and basis < ema and barstate.isconfirmed
plotshape(trigger_buy ?close:na, title="Label Buy" , style=shape.labelup , location= location.belowbar, color=color.green, text="B", textcolor=color.white, display=display.pane)
plotshape(trigger_sell?close:na, title="Label Sell", style=shape.labeldown, location= location.abovebar, color=color.red , text="S", textcolor=color.white, display=display.pane)
// ――――――――――――――――――――――――――――――――――――――――――――――――――――――――――――――――――――――――――――――――――――――――――――――――――――――――――――――――――――
// 👇 Plots to be used in the DCA Bot Indicator as source triggers.
// ――――――――――――――――――――――――――――――――――――――――――――――――――――――――――――――――――――――――――――――――――――――――――――――――――――――――――――――――――――
plot(trigger_buy ? 1 : 0 , '🟢 Trigger Buy' , color = na, display = display.data_window)
plot(trigger_sell? -1 : 0 , '🔴 Trigger Sell', color = na, display = display.data_window)
To use the example code
Open the Pine Editor, paste the code and then click Add to chart.
Then in the Plot Entry Trigger Source option, we will select 🟢 Trigger Buy, as the plot that will give us the buy signals when it is worth 1, otherwise for the sell signals you must change the value to -1 in the Plot Entry Trigger Value and remember to change the strategy mode to Short.
🔸DCA Settings: Here you need to configure the DCA values of the strategy, you can see the meaning of each value in the Settings Section. Once you are satisfied with the tests configure the 3Commas DCA Bot with the same values so that the Summary Table matches the 3Commas Table. Pay close attention to the Total Volume that the Bot will use, according to the amount of Safety Orders you are going to execute, and that all the values in the table adapt to your risk tolerance.
🔸DCA Bot Deal Start: Once you create the Bot in 3Commas with the same settings it will give you a Deal Start Message, you must copy and paste it in this section, verify that it is the same in the summary table, this is used to be sent through tradingview alerts to the Bot and it can process the signals.
🔸DCA Bot Multi-Pair: A Multi-Pair Bot allows you to manage several pairs with a single bot, but you must specify which pair it will run on. You must activate it if you want to use the signals in a DCA Bot Multi-pair. In the text box you must enter (using the 3Commas format) the symbol for each pair before you create the alert so that the bot understands which pair to work on.
In the following image we would be configuring the indicator to send a signal to activate the bot in the BTCUSDT pair using the given format it would be USDT_BTC, but if we wanted to send a signal in another pair we must change the pair in the chart and also in the configuration, an example with ETHUSDT would be USDT_ETH. After this we could create the alert, and the Mult-Pair Bot would detect it correctly.
🔸Strategy Tester Filters: This is useful if you want to test the strategy's result on a certain time window, the indicator will only enter this range. If disabled it will use all historical data available on the chart. If you are going to use the tool to send signals, make sure to disable the Use Custom Test Period. If you want the entries to only run at a certain time and day, in that case make sure that the timezone matches the one you are using in the chart.
🔸Properties: Adjust your initial capital and exchange commission appropriately to achieve realistic results.
🔸Create alerts to trigger the DCA Bot
Check that the message is the same as the one indicated by the DCA Bot.
In the case of Multi-Pair, enable the option to add the symbol with the correct format.
When creating an alert, select Any alert() function call.
Enter the any name of the alert.
Open the Notifications tab and enable Webhook URL
Paste Webhook URL provided by 3Commas looking in the section How to use TradingView custom signals.
Done, alerts will be sent with the correct format automatically to 3Commas.
🔷 INDICATOR SETTINGS
🔸3Commas DCA Bot Settings
Strategy: Select the direction of the strategy to test Long or Short, this must be the same as the Bot created in 3Commas, so that the signals are processed properly.
DCA Bot Deal Start: Copy and paste the message for the deal start signal of the DCA Bot you created in 3Commas. This is the message that will be sent with the alert to the Bot, you must verify that it is the same as the 3Commas bot so that it can process properly so that it executes and starts the trade.
DCA Bot Multi-Pair: A Multi-Pair Bot allows you to manage several pairs with a single bot, but you must specify which pair it will run on.
DCA Bot Summary Table: Here you can activate the display of table as well as change the size, position, text color and background color.
🔸Source Indicator Settings
Plot Entry Trigger Source: Select a Plot for Entries of the Source Indicator. This refers to the Long or Short entry signal that the indicator will use as BO (Base Order).
Plot Entry Trigger Value: Value of the Source Indicator to Deal Start Condition Trigger. The default value is 1, this means that when a signal is given for example Long in the source indicator, we will use 1 or for Short -1 if there is no signal it will be 0 so it will not execute any entry, please review the example code and adjust the indicator you are going to use in the same way.
🔸DCA Settings
Base Order: The Base Order is the first order the bot will create when starting a new deal.
Safety Order: Enter the amount of funds your safety orders will use to average the cost of the asset being traded.Safety orders are also known as Dollar Cost Averaging and help when prices move in the opposite direction to your bot's take profit target.
Safety Orders Deviation %: Enter the percentage difference in price to create the first Safety Order. All Safety Orders are calculated from the price the initial Base Order was filled on the exchange account.
Safety Orders Max Count: This is the total number of Safety Orders the bot is allowed to use per deal that is opened. All Safety Orders created by the bot are placed as Limit Orders on the exchange's order book.
Safety Orders Volume Scale: The Safety Order Volume Scale is used to multiply the amount of funds used by the last Safety Order that was created. Using a larger amount of funds for Safety Orders allows your bot to be more aggressive at Dollar Cost Averaging the price of the asset being traded.
Safety Orders Step Scale: The Safety Order Step Scale is used to multiply the Price Deviation percentage used by the last Safety Order placed on the exchange account. Using a larger value here will reduce the amount of Safety Orders your bot will require to cover a larger move in price in the opposite direction to the active deal's take profit target.
Take Profit %: The Take Profit section offers tools for flexible management of target parameters: automatic profit upon reaching one or more target levels in percentage.
Stop Loss % | Use SL: To enable Stop Loss, please check the "Use SL" box. This is the percentage that price needs to move in the opposite direction to close the deal at a loss. This must be greater than the sum of the deviations from the safety orders.
🔸Strategy Tester Filters
Use Custom Test Period: When enabled signals only works in the selected time window.. If disabled it will use all historical data available on the chart.
Test Start and End: Once the Custom Test Period is enabled, here you select the start and end date that you want to analyze.
Session Filter | Days | Background: Here you can choose a time zone in which signals will be sent or your strategy will be tested, as well as the days and a background of it. It is important that you use the same timezone as your chart so that it matches.
👨🏻💻💭 If this tool helps you, don’t forget to give it a boost! Feel free to share in the comments how you're using it or if you have any questions.
_________________________________________________________________
The information and publications within the 3Commas TradingView account are not meant to be and do not constitute financial, investment, trading, or other types of advice or recommendations supplied or endorsed by 3Commas and any of the parties acting on behalf of 3Commas, including its employees, contractors, ambassadors, etc.

Ping Pong Bot StrategyOverview:
The Ping Pong Bot Strategy is designed for traders who focus on scalping and short-term opportunities using support and resistance levels. This strategy identifies potential buy entries when the price reaches a key support area and shows bullish momentum (a green bar). It aims to capitalize on small price movements with predefined risk management and take profit levels, making it suitable for active traders looking to maximize quick trades in trending or ranging markets.
How It Works:
Support & Resistance Calculation:
The strategy dynamically identifies support and resistance levels using the lowest and highest price points over a user-defined period. These levels help pinpoint potential price reversal areas, guiding traders on where to enter or exit trades.
Buy Entry Criteria:
A buy signal is triggered when the closing price is at or below the support level, and the bar is green (i.e., the closing price is higher than the opening price). This ensures that entries are made when prices show signs of upward momentum after hitting support.
Risk Management:
For each trade, a stop loss is calculated based on a user-defined risk percentage, helping to protect against significant drawdowns. Additionally, a take profit level is set at a ratio relative to the risk, ensuring a disciplined approach to exit points.
0.5% Take Profit Target:
The strategy also includes a 0.5% quick take profit target, indicated by an orange arrow when reached. This feature helps traders lock in small gains rapidly, making it ideal for volatile market conditions.
Customizable Inputs:
Length: Adjusts the period for calculating support and resistance levels.
Risk-Reward Ratio: Allows traders to set the desired risk-to-reward ratio for each trade.
Risk Percentage: Defines the risk tolerance for stop loss calculations.
Take Profit Target: Enables the customization of the quick take profit target.
Ideal For:
Traders who prefer an active trading style and want to leverage support and resistance levels for precise entries and exits. This strategy is particularly useful in markets that experience frequent price bounces between support and resistance, allowing traders to "ping pong" between these levels for profitable trades.
Note:
This strategy is developed mainly for the 5-minute chart and has not been tested on longer time frames. Users should perform their own testing and adjustments if using it on different time frames.

Overnight Positioning w EMA - Strategy [presentTrading]I've recently started researching Market Timing strategies, and it’s proving to be quite an interesting area of study. The idea of predicting optimal times to enter and exit the market, based on historical data and various indicators, brings a dynamic edge to trading. Additionally, it is integrated with the 3commas bot for automated trade execution.
I'm still working on it. Welcome to share your point of view.
█ Introduction and How it is Different
The "Overnight Positioning with EMA " is designed to capitalize on market inefficiencies during the overnight trading period. This strategy takes a position shortly before the market closes and exits shortly after it opens the following day. What sets this strategy apart is the integration of an optional Exponential Moving Average (EMA) filter, which ensures that trades are aligned with the underlying trend. The strategy provides flexibility by allowing users to select between different global market sessions, such as the US, Asia, and Europe.
It is integrated with the 3commas bot for automated trade execution and has a built-in mechanism to avoid holding positions over the weekend by force-closing positions on Fridays before the market closes.
BTCUSD 20 mins Performance
█ Strategy, How it Works: Detailed Explanation
The core logic of this strategy is simple: enter trades before market close and exit them after market open, taking advantage of potential price movements during the overnight period. Here’s how it works in more detail:
🔶 Market Timing
The strategy determines the local market open and close times based on the selected market (US, Asia, Europe) and adjusts entry and exit points accordingly. The entry is triggered a specific number of minutes before market close, and the exit is triggered a specific number of minutes after market open.
🔶 EMA Filter
The strategy includes an optional EMA filter to help ensure that trades are taken in the direction of the prevailing trend. The EMA is calculated over a user-defined timeframe and length. The entry is only allowed if the closing price is above the EMA (for long positions), which helps to filter out trades that might go against the trend.
The EMA formula:
```
EMA(t) = +
```
Where:
- EMA(t) is the current EMA value
- Close(t) is the current closing price
- n is the length of the EMA
- EMA(t-1) is the previous period's EMA value
🔶 Entry Logic
The strategy monitors the market time in the selected timezone. Once the current time reaches the defined entry period (e.g., 20 minutes before market close), and the EMA condition is satisfied, a long position is entered.
- Entry time calculation:
```
entryTime = marketCloseTime - entryMinutesBeforeClose * 60 * 1000
```
🔶 Exit Logic
Exits are triggered based on a specified time after the market opens. The strategy checks if the current time is within the defined exit period (e.g., 20 minutes after market open) and closes any open long positions.
- Exit time calculation:
exitTime = marketOpenTime + exitMinutesAfterOpen * 60 * 1000
🔶 Force Close on Fridays
To avoid the risk of holding positions over the weekend, the strategy force-closes any open positions 5 minutes before the market close on Fridays.
- Force close logic:
isFriday = (dayofweek(currentTime, marketTimezone) == dayofweek.friday)
█ Trade Direction
This strategy is designed exclusively for long trades. It enters a long position before market close and exits the position after market open. There is no shorting involved in this strategy, and it focuses on capturing upward momentum during the overnight session.
█ Usage
This strategy is suitable for traders who want to take advantage of price movements that occur during the overnight period without holding positions for extended periods. It automates entry and exit times, ensuring that trades are placed at the appropriate times based on the market session selected by the user. The 3commas bot integration also allows for automated execution, making it ideal for traders who wish to set it and forget it. The strategy is flexible enough to work across various global markets, depending on the trader's preference.
█ Default Settings
1. entryMinutesBeforeClose (Default = 20 minutes):
This setting determines how many minutes before the market close the strategy will enter a long position. A shorter duration could mean missing out on potential movements, while a longer duration could expose the position to greater price fluctuations before the market closes.
2. exitMinutesAfterOpen (Default = 20 minutes):
This setting controls how many minutes after the market opens the position will be exited. A shorter exit time minimizes exposure to market volatility at the open, while a longer exit time could capture more of the overnight price movement.
3. emaLength (Default = 100):
The length of the EMA affects how the strategy filters trades. A shorter EMA (e.g., 50) reacts more quickly to price changes, allowing more frequent entries, while a longer EMA (e.g., 200) smooths out price action and only allows entries when there is a stronger underlying trend.
The effect of using a longer EMA (e.g., 200) would be:
```
EMA(t) = +
```
4. emaTimeframe (Default = 240):
This is the timeframe used for calculating the EMA. A higher timeframe (e.g., 360) would base entries on longer-term trends, while a shorter timeframe (e.g., 60) would respond more quickly to price movements, potentially allowing more frequent trades.
5. useEMA (Default = true):
This toggle enables or disables the EMA filter. When enabled, trades are only taken when the price is above the EMA. Disabling the EMA allows the strategy to enter trades without any trend validation, which could increase the number of trades but also increase risk.
6. Market Selection (Default = US):
This setting determines which global market's open and close times the strategy will use. The selection of the market affects the timing of entries and exits and should be chosen based on the user's preference or geographic focus.

MetaFOX DCA (ASAP-RSI-BB%B-TV)Welcome To ' MetaFOX DCA (ASAP-RSI-BB%B-TV) ' Indicator.
This is not a Buy/Sell signals indicator, this is an indicator to help you create your own strategy using a variety of technical analyzing options within the indicator settings with the ability to do DCA (Dollar Cost Average) with up to 100 safety orders.
It is important when backtesting to get a real results, but this is impossible, especially when the time frame is large, because we don't know the real price action inside each candle, as we don't know whether the price reached the high or low first. but what I can say is that I present to you a backtest results in the worst possible case, meaning that if the same chart is repeated during the next period and you traded for the same period and with the same settings, the real results will be either identical to the results in the indicator or better (not worst). There will be no other factors except the slippage in the price when executing orders in the real trading, So I created a feature for that to increase the accuracy rate of the results. For more information, read this description.
Below I will explain all the properties and settings of the indicator:
A) 'Buy Strategies' Section: Your choices of strategies to Start a new trade: (All the conditions works as (And) not (OR), You have to choose one at least and you can choose more than one).
- 'ASAP (New Candle)': Start a trade as soon as possible at the opening of a new candle after exiting the previous trade.
- 'RSI': Using RSI as a technical analysis condition to start a trade.
- 'BB %B': Using BB %B as a technical analysis condition to start a trade.
- 'TV': Using tradingview crypto screener as a technical analysis condition to start a trade.
B) 'Exit Strategies' Section: Your choices of strategies to Exit the trades: (All the conditions works as (And) not (OR), You can choose more than one, But if you don't want to use any of them you have to activate the 'Use TP:' at least).
- 'ASAP (New Candle)': Exit a trade as soon as possible at the opening of a new candle after opening the previous trade.
- 'RSI': Using RSI as a technical analysis condition to exit a trade.
- 'BB %B': Using BB %B as a technical analysis condition to exit a trade.
- 'TV': Using tradingview crypto screener as a technical analysis condition to exit a trade.
C) 'Main Settings' Section:
- 'Trading Fees %': The Exchange trading fees in percentage (trading Commission).
- 'Entry Price Slippage %': Since real trading differs from backtest calculations, while in backtest results are calculated based on the open price of the candle, but in real trading there is a slippage from the open price of the candle resulting from the supply and demand in the real time trading, so this feature is to determine the slippage Which you think it is appropriate, then the entry prices of the trades will calculated higher than the open price of the start candle by the percentage of slippage that you set. If you don't want to calculate any slippage, just set it to zero, but I don't recommend that if you want the most realistic results.
Note: If (open price + slippage) is higher than the high of the candle then don't worry, I've kept this in consideration.
- 'Use SL': Activate to use stop loss percentage.
- 'SL %': Stop loss percentage.
- 'SL settings options box':
'SL From Base Price': Calculate the SL from the base order price (from the trade first entry price).
'SL From Avg. Price': Calculate the SL from the average price in case you use safety orders.
'SL From Last SO.': Calculate the SL from the last (lowest) safety order deviation.
ex: If you choose 'SL From Avg. Price' and SL% is 5, then the SL will be lower than the average price by 5% (in this case your SL will be dynamic until the price reaches all the safety orders unlike the other two SL options).
Note: This indicator programmed to be compatible with '3COMMAS' platform, but I added more options that came to my mind.
'3COMMAS' DCA bots uses 'SL From Base Price'.
- 'Use TP': Activate to use take profit percentage.
- 'TP %': Take profit percentage.
- 'Pure TP,SL': This feature was created due to the differences in the method of calculations between API tools trading platforms:
If the feature is not activated and (for example) the TP is 5%, this means that the price must move upward by only 5%, but you will not achieve a net profit of 5% due to the trading fees. but If the feature is activated, this means that you will get a net profit of 5%, and this means that the price must move upward by (5% for the TP + the equivalent of trading fees). The same idea is applied to the SL.
Note: '3COMMAS' DCA bots uses activated 'Pure TP,SL'.
- 'SO. Price Deviation %': Determines the decline percentage for the first safety order from the trade start entry price.
- 'SO. Step Scale': Determines the deviation multiplier for the safety orders.
Note: I'm using the same method of calculations for SO. (safety orders) levels that '3COMMAS' platform is using. If there is any difference between the '3COMMAS' calculations and the platform that you are using, please let me know.
'3COMMAS' DCA bots minimum 'SO. Price Deviation %' is (0.21)
'3COMMAS' DCA bots minimum 'SO. Step Scale' is (0.1)
- 'SO. Volume Scale': Determines the base order size multiplier for the safety orders sizes.
ex: If you used 10$ to buy at the trade start (base order size) and your 'SO. Volume Scale' is 2, then the 1st SO. size will be 20, the 2nd SO. size will be 40 and so on.
- 'SO. Count': Determines the number of safety orders that you want. If you want to trade without safety orders set it to zero.
'3COMMAS' DCA bots minimum 'SO. Volume Scale' is (0.1)
- 'Exchange Min. Size': The exchange minimum size per trade, It's important to prevent you from setting the base order Size less than the exchange limit. It's also important for the backtest results calculations.
ex: If you setup your strategy settings and it led to a loss to the point that you can't trade any more due to insufficient funds and your base order size share from the strategy becomes less than the exchange minimum trade size, then the indicator will show you a warning and will show you the point where you stopped the trading (It works in compatible with the initial capital). I recommend to set it a little bit higher than the real exchange minimum trade size especially if you trade without safety orders to not stuck in the trade if you hit the stop loss
- 'BO. Size': The base order size (funds you use at the trade entry).
- 'Initial Capital': The total funds allocated for trading using your strategy settings, It can be more than what is required in the strategy to cover the deficit in case of a loss, but it should not exceed the funds that you actually have for trading using this strategy settings, It's important to prevent you from setting up a strategy which requires funds more than what you have. It's also has other important benefits (refer to 'Exchange Min. Size' for more information).
- 'Accumulative Results': This feature is also called re-invest profits & risk reduction. If it's not activated then you will use the same funds size in each new trade whether you are in profit or loss till the (initial capitals + net results) turns insufficient. If it's activated then you will reuse your profits and losses in each new trade.
ex: The feature is active and your first trade ended with a net profit of 1000$, the next trade will add the 1000$ to the trade funds size and it will be distributed as a percentage to the BO. & SO.s according to your strategy settings. The same idea in case of a loss, the trade funds size will be reduced.
D) 'RSI Strategy' Section:
- 'Buy': RSI technical condition to start a trade. Has no effect if you don't choose 'RSI' option in 'Buy Strategies'.
- 'Exit': RSI technical condition to exit a trade. Has no effect if you don't choose 'RSI' option in 'Exit Strategies'.
E) 'TV Strategy' Section:
- 'Buy': TradingView Crypto Screener technical condition to start a trade. Has no effect if you don't choose 'TV' option in 'Buy Strategies'.
- 'Exit': TradingView Crypto Screener technical condition to exit a trade. Has no effect if you don't choose 'TV' option in 'Exit Strategies'.
F) 'BB %B Strategy' Section:
- 'Buy': BB %B technical condition to start a trade. Has no effect if you don't choose 'BB %B' option in 'Buy Strategies'.
- 'Exit': BB %B technical condition to exit a trade. Has no effect if you don't choose 'BB %B' option in 'Exit Strategies'.
G) 'Plot' Section:
- 'Signals': Plots buy and exit signals.
- 'BO': Plots the trade entry price (base order price).
- 'AVG': Plots the trade average price.
- 'AVG options box': Your choice to plot the trade average price type:
'Avg. With Fees': The trade average price including the trading fees, If you exit the trade at this price the trade net profit will be 0.00
'Avg. Without Fees': The trade average price but not including the trading fees, If you exit the trade at this price the trade net profit will be a loss equivalent to the trading fees.
- 'TP': Plots the trade take profit price.
- 'SL': Plots the trade stop loss price.
- 'Last SO': Plots the trade last safety order that the price reached.
- 'Exit Price': Plots a mark on the trade exit price, It plots in 3 colors as below:
Red (Default): Trade exit at a loss.
Green (Default): Trade exit at a profit.
Yellow (Default): Trade exit at a profit but this is a special case where we have to calculate the profits before reaching the safety orders (if any) on that candle (compatible with the idea of getting strategy results at the worst case).
- 'Result Table': Plots your strategy result table. The net profit percentage shown is a percentage of the 'initial capital'.
- 'TA Values': Plots your used strategies Technical analysis values. (Green cells means valid condition).
- 'Help Table': Plots a table to help you discover 100 safety orders with its deviations and the total funds needed for your strategy settings. Deviations shown in red is impossible to use because its price is <= 0.00
- 'Portfolio Chart': Plots your Portfolio status during the entire trading period in addition to the highest and lowest level reached. It's important when evaluating any strategy not only to look at the final result, but also to look at the change in results over the entire trading period. Perhaps the results were worryingly negative at some point before they rose again and made a profit. This feature helps you to see the whole picture.
- 'Welcome Message': Plots a welcome message and showing you the idea behind this indicator.
- 'Green Net Profit %': It plots the 'Net Profit %' in the result table in green color if the result is equal to or above the value that you entered.
- 'Green Win Rate %': It plots the 'Win Rate %' in the result table in green color if the result is equal to or above the value that you entered.
- 'User Notes Area': An empty text area, Feel free to use this area to write your notes so you don't forget them.
The indicator will take care of you. In some cases, warning messages will appear for you. Read them carefully, as they mean that you have done an illogical error in the indicator settings. Also, the indicator will sometimes stop working for the same reason mentioned above. If that happens then click on the red (!) next to the indicator name and read the message to find out what illogical error you have done.
Please enjoy the indicator and let me know your thoughts in the comments below.

TTP Pair CipherPair Cipher can run your hedge pair trading strategy.
Pair cipher can use a spread chart (two assets ratio or difference) to manage a hedge position consisting of two assets: one long and one short position.
Event though the spread chart is used to determine the entries and exits each coin price action is used to calculate floating PNL.
It supports different bot platforms. It's backtestable and can run live.
Features:
- Internal and external entry signal
- In-chart realised PNL plot
- Hedge position floating PNL chart
- Individual floating PNL for each long and short ("show coins" toggle)
- Retracement exit strategy: determine at which retracement factor to exit your position while in profit
- PNL RSI exit strategy: determine at which RSI level crossunder you'd like to exit. RSI is applied to the floating PNL
- Static TP/SL levels
- ATR TP/SL levels with individual factors. When ATR is selected the TP or SL acts as a multiplier of ATR instead.
- On-chart debug labels for alerts
- Intra candle alert: signals can trigger intra candle in this mode, but this mode will cause repainting. Example: if the position goes below SL intra candle, the alert will be sent, but later if it goes in profit before closing the candle, the backtest will continue with the position open. The backtest does NOT have access to the intra candle data. Alert intra candle reduces the risk of not applying SL.
Example of setup:
1) Load an empty 1 hour timeframe chart with the spread BYBIT:REQUSDT.P / BYBIT:REEFUSDT.P
2) Select an investment amount
3) Select TP 1.2 and enable ATR
4) Select SL 1.1 and enable ATR
5) Select RSI profits of crossunder 70
6) Don't enable external signal (you can try with TTP PNR)
7) Select BYBIT:REQUSDT.P as symbol 1
8) Select BYBIT:REEFUSDT.P as symbol 2

Broadview Algorithmic StudioWelcome! This is the writeup for the Broadview Algorithmic Studio.
There are many unique features in this script.
- Broadview Underpriced & Overpriced
- Broadview Blackout Bollinger Bands
- Trailing Take Profit Suite
- Algorithmic Weights
- VSA Score
- Pip Change Log
- Activation Panel
- Weight Scanner
There are 116 primary inputs that allow users to algorithmically output unique DCA signal-sets. There are 85 inputs that allow users to control individual lengths, levels, thresholds, and multiplicative weights of the script. You will not find any other script with this many inputs, properly strung together for you to produce unlimited strategies for any market. The entire premise for the Broadview Algorithmic Studio is for users to be able to have extensive-cutting-edge features that allow them to produce more strategies, having control over every element that outputs a signal set. The number of unique strategies you can output with this script is VAST, and each continues to follow a safe DCA methodology.
This script is ready for use with 3Commas, interactive brokers, and other means of automation. It provides detailed information on Base Orders and Safety Orders, giving the number, cumulative spending, position average, and remaining balance for each SO in the series. Using this script we will explore the depths of strategic volume scaling, and the algorithms we use to determine spending.
Let me first start by saying the number of safe DCA-friendly signal-sets this script can output is absolutely staggering.
Let's limit the scope just to the Broadview Underpriced & Overpriced and Broadview Dominance indicators.
Each band of the Dominance Suite can be controlled individually with unique lengths, levels, and weights. This means the Dominance Suite can establish Bearish or Bullish dominance, in any market condition, and give it a unique overloading weight. The Broadview Underpriced & Overpriced indicator finally gives us the ability to establish these "market conditions" first with cycles. Of all the cycles this indicator establishes, the two primary are Underpriced & Overpriced. We determine this using a composite Overbought & Oversold with an Exponential Moving Average. So the script can now know, what cycle it is in, who is dominant during that cycle, and exactly how much weight in volume scaling the order should have.
Brand new is the ability for indicators of this level to be able to talk together in a single script. The Broadview Underpriced & Overpriced indicator and the Broadview Dominance indicator can inform one another across multiple vectors, create a unique market snapshot, and give that snapshot a unique weight every bar. The unique weight is compiled in the volume scaling math, thus giving us an automated-strategic-safe and quite efficient volume scaling for every order. In our coming updates we will explore this synergy to its very deepest layers. These indicators can be laced together in many ways, called vectors.
Only in the Algorithmic Studio do we explore these depths and yield those findings, features, and inputs to the user.
Let me take a quick break to explain another area-of-opportunity for our research and development.
The VSA Score is something we've tried before, but until the creation of the Broadview Blackout Bollinger Bands Auto Indicator it was not possible. The concept we want to explore is "Positional Honing". Over time we want users and the script itself to be able to understand the difference between a script-config that produces a high number of Hits, from a configuration that produces a high number of "Misses". The Volume Scaling Accuracy Score uses the BBB Auto Indicator as a heavily reliable, non-repainting, method of determining what the very-best signals for increased volume-scaling are.
Increased volume scaling is denoted by the near-white highlighter line running vertically. This line will either fall inside the BBB Auto Indicator bands (which are hidden), or, they will fall below and outside the BBB Auto bands. If increased spending happens inside the bands it's a "Miss". If increased spending happens below and outside the bands, it's a Hit. Oftentimes misses are actually pretty good spots for extra spending, which helps lower your position average, but Hits are always better. The Hits that the BBB Auto Indicator provides are extremely good.
Let's talk about the Trailing Take Profit Suite. This suite allows us to set a trailing take profit which is a feature that lets one maximize their profits. If the trailing take profit is engaged, then when the regular take profit is hit, it will trigger, denoted in red vertical lines, and the trailing take profit will look for a specified rate of change before it actually takes profit. This usually helps traders in those times when their regular take profit was set too low, allowing them to maximize their profits with a Trailing Take Profit.
For the moment, let's think about our scores. In the dashboard you'll notice a score beginning the Pip Change Log, the VSA Score, and the Activation Panel.
These scores use a new kind of logistic correlation formula where 4 digits are given to activation, rather than 1. This is to allow room for a future concept in AI we call "Deadzones" or you can think of it as impedance. This is not a bias in logistic regression. It's an entirely different concept. A neuron, which a perceptron attempts to mimic, has a bias.. but it also has a sort of electrical resistance. This is because a neuron is individually-alive entity. So a perceptron, as it were, would need to have both a bias and a natural resistance, or deadzone.
It is a lot of fun to watch the scores and how they react during playback. They tend to smooth trends but are also quite quick to correct to accuracy. In the future we will add the deadzones and biases to the scores. This should help both users and the script produce better signal sets. The Pip Change Log is an indicator that measures Rate of Change in Pips. This is one that I am particularly excited to study, as I am a huge fan of ROC. The Activation Panel shows these scores for 4 primary indicators: On Balance Volume, Relative Strength Index, Average Directional Index, and Average True Range.
Having the Pip Change Log, VSA Score, and Activation Panel up on the dashboard with their logistic correlation scores allows traders to study markets and setups quite intimately. The weight scanner at the bottom allows users to track the cumulative applied multiplicative weights during playback. The massive number of inputs, connected vectors of indicators, input-weights, lengths, levels, and thresholds sets up all the algorithmic infrastructure for powerusers to explore every idea and strategy output they could imagine. Also with the connected vector infrastructure we can deepen our indicators in a way where, "How they talk to each other.", comes first in every development conversation.
The Algorithmic Studio is for the Power-user.
These are not basic equations coming together to determine spending. This is a massive multi-layered-perceptron with everything from Trailing-Take-Profits to strategic-automatic algorithmic downscaling. The Broadview Algorithmic Studio gives a home to the poweruser who wants access to everything in a trading and investing AI, right up until the backpropagation. The Broadview Algorithmic Studio, gives users the ability to sit in the chair of the would-be AI.
Thank you.

DCA EMA Simple Bot [Starbots]
This is a simple idea of DCA trading on EMA crosses. Strategy is not repainting.
The difference between this and any other strategy is, that this script allows you to preset DCA buy triggers at desired levels and customize each DCA order size independently. Alerts are working, this strategy is easily used for automatic trading.
I mainly trade on Cryptohopper, Pionex, 3commas. This was created for community, alerts are working and non-repainting. Should work on any other as well.
Trading Condition:
It's buying when Fast EMA crosses up Slow EMA. Set your paramters.
It's selling if EMA's crosses back, signaling a sell. Optional.
DCA:
You can enter DCA on 20 custom levels or layers. It buys DCA when price hits the plotted blue line on the chart that's set by input % triggers. (buy 1st DCA at 2% drop, buy 2nd DCA at 5% drop,...)
Set your Inital Capital and Pyramiding in Properties tab, Initial Order Size and DCA Order Size (lot1,lot2,lot3,..), Order Type are changed in strategy inputs.
-By default you can see that we buy when EMA's cross up and signal a buy for 10% of equity, if market is dropping you will then place a first DCA order ( 20% equity) at 2% drop (lower) from initial order. If market keeps dropping you have more DCA levels where you can buy and average down your holding position. For selling you can use Take profit and Stop Loss targets that averages down multiple open positions, it will sell it once it reaches your desirable Take Profit and close a deal. You can also close your trade if EMA signals a sell.
Pyramiding - number of orders you can open at a time
Your first buy order is pyramiding 1. To allow it to buy 1 DCA or merge one time, set pyramding to 2.
Want to DCA 10 times? Set pyramiding at 11. (+1 always)
More features:
- Profit Calendar
- Show Balance label before every new trade
- DCA table - visualize how much of your investment is used in trades. If a background of the table is green you are okay, if the background color is red - you are using more money for orders than you actually have.
Buy Orders << Strategy Equity/Capital
- Show / Hide DCA lines - if your chart processing is getting slow you should hide some DCA levels to speed it up
- Backtesting Range - for testing the strategy in different time windows
- Alerts
When all trades are closed on your chart, winning rate of the strategy is 100% actually.
Win rate is shown differently as it's actually closing and opening every trade individually by default in TradingView system. We merge positions together and average it down into one big position to later sell for a profit (DCA).
You use this Trading Algorithm at your own risk. Do not trade before testing or invest something you cannot afford to lose on markets.

TTP AbsolutnoAbsolutno is a pine script strategy for backtesting DCA bots with a different approach for placing both safety orders and take profit levels.
Motivation
Using DCA bots with safety orders most of the time is great during bull markets but in bear markets and strong downtrends it can be really challenging to close your deals only relying on safety orders placed based on percentages: price scale and volume scale.
In the past we introduced a script called "add funds simulator" that people used for sending alerts to bots to add funds and help closing deals in red.
We want to cross the use of TA with the safety orders with the intention of getting better results than statically placed safety orders.
What does Absolutno do?
Absolutno uses TA for safety orders, both for opening new safety orders and also to define how low they should be placed based on the volatility of the asset.
Main features
- ATR SO mode: Safety orders can be placed dynamically based on the general volatility of the asset plus the current volatility.
- TA based SO entries: Safety orders are only placed when the deal start condition is true not only when the price pulls back below the next safety order price level. This acts like a hybrid between "add funds simulator" and a traditional DCA bot. Once a safety order is filled, the next SO level gets active waiting for a DSC to trigger below the new entry level.
- Take profit scale: Traditional DCA bots offer a percentage or TA based exit conditions. Absolutno offers a new mode when you can decide to increase or decrease the TP level with each SO getting filled. For example a value of 1.1 TP scale will cause that each SO getting filled makes the TP% grow 10%. A value of 0.9% will reduce each SO by 10%. The lower the price goes you can "lower your expectation", or if you are filling bullish you can actually increase it.
External signal
It comes with a built-in deal start condition that uses RSI cross over 30 which is used only for illustration purposes since Absolutno is designed to be used with external signals.
Use any external signal to enter a new deal and for adding new safety orders.
You can also activate external take profit signal.
When external TP is enabled, all TP features from the bot are disabled to only react to what the external signal instructs the bot.
Bot integration and alerts
Three type of alerts will be sent to the bot: open deal, add funds and close deal.
You will need to enter your bot id and email token in the settings.
Since this strategy uses add funds: you must be aware that the alerts sent from this strategy will contain the amount of funds to add and therefore the bot receiving these alerts will respect them EVEN if the bot was defined with different SO sizes.
Please make sure you fully understand this before using this signal.
The base order alerts don't contain funds information so the bot will always use the base order size as defined in its own settings.
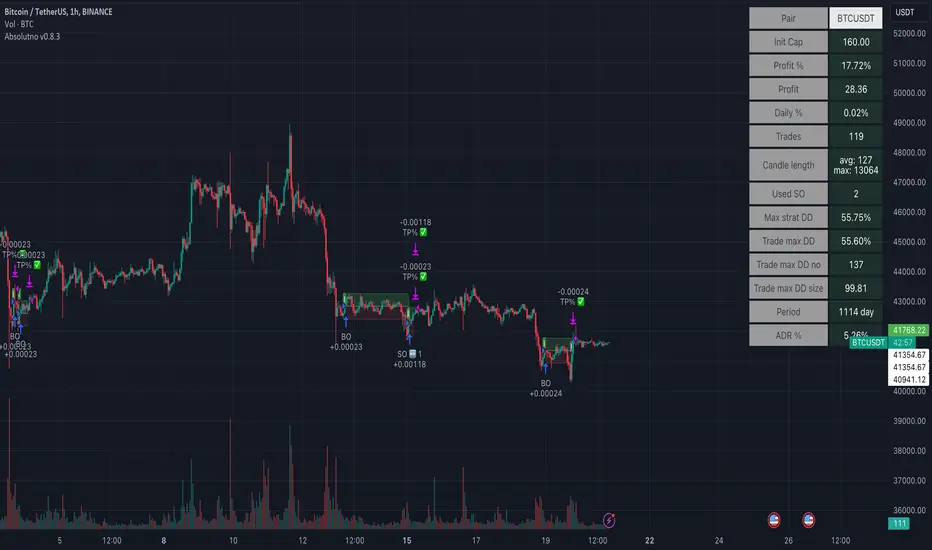
[pAulseperformance] PSStrategyX█ OVERVIEW
This script reduces the amount of time it takes to turn your indicator into a live trading bot.
It will convert your signals into alerts that will be sent to your exchange for trading.
The script features a broker connector to automate alert syntax and connect with third-party exchanges to live trade strategies with minimal setup.
It also includes an enhanced version of the built-in backtester with customizable options to speed up backtesting, trade-by-trade statistics, and a chart strategy summary to help traders make informed decisions.
The PSStrategyX trading tool is designed to provide traders with a range of benefits, including:
Increased confidence in their strategies.
Better understanding of the accuracy of indicator signals.
Simplified automated trading through third-party broker connections.
Reduced time to develop strategies by focusing on signal development only. No need to work with complicated strategy testing code and 3rd party automation.
█ FEATURES
Broker Connector
— Supports Autoview (More Connectors added in the future)
— Connects and auto trades with most exchanges
— No need for Webhooks (AutoView)
— Can forward test live strategies on Testnets before using real money.
Built in Backtester loaded with options to speed up backtesting
— Standard strategy features including stop loss, take profit, and various filters reduce the time and complexity involved in building a working strategy.
Trade By Trade Statistics
— Gain insight on every trade with additional trade-by-trade statistics.
Strategy Summary
— Get instant feedback on your chart of your strategies performance. Visual cues and feedback give you hints on where to look and what to improve.
Strategy Tester Enhancements
— Take the max trades allowed in the strategy tester without errors.
— Take the largest or smallest trade allowed without errors.
█ WHY?
The PSStrategyX tool was developed to solve a common problem faced by traders who use Pine Script on TradingView: the inability to integrate Pine Script with exchanges through TradingView.
Without this integration, traders need to go through several extra steps to live trade their Pine Script strategies on a real exchange with real money. This includes finding a broker, learning the new syntax for the broker, and placing that syntax correctly in the strategy.
These steps can be time-consuming and add complexity to the codebase.
The PSStrategyX tool simplifies this process by automatically configuring the correct alert syntax to connect to third-party exchanges, allowing traders to live trade their strategies with minimal setup. This saves traders time and effort, allowing them to focus on signal development rather than complicated strategy testing code and 3rd party automation.
Additionally, the tool was developed to address the time-consuming task of converting any one of the thousands of great free indicators on TradingView to strategies through hours of coding.
Overall, I built the PSStrategyX to streamline the auto trading process and make auto trading more accessible to traders of all levels.
█ HOW TO USE THIS?
Using the PSStrategyX trading tool is a straightforward process that requires a few key steps:
1 — Generate trading signals: You need a signal generator that can provide buy and sell signals for your preferred trading instrument(s).
You can use TradingView's indicators or create your own custom indicators using TradingView's Pine programming language.
2 — Connect trading signals to PSStrategyX: You will use 2 scripts on your chart. One generates buy/sell/exit signals, and the other is the PSStrategyX script executing those signals as trades.
To set this up you will need to make sure that your signal generator is an indicator, NOT a strategy.
Make sure the signals are being plotted buy = 1; sell = -1; exit = 0; signals in one plot. Exits are optional.
Example plot(buy ? 1 : sell ? -1 : exit ? 0 : na)
You will choose the plot with buy/sell/exit signals inside the PSStrategyX tool to execute trades. If you need help, check out the docs for more details.
3 — Set up the broker connector (optional): If you want to take live trades with this tool, you will need to set up a third party connecter. Once set up, everything is automated. See more details in the "authors instructions." at the bottom of this post.
4 — Set up an exchange account (optional): If you want to trade on an exchange, you will need to set up an account with the exchange you plan to use.
The Broker Connector supports a range of popular exchanges, including Binance, Bitfinex, Kraken, Oanda and more.
Once you have generated your trading signals, set up the Broker connecter (optional) and set up an exchange account (optional), you can start using the PSStrategyX trading tool to execute trades automatically based on your trading signals.
█ LIMITATIONS
Here are some important limitations to keep in mind when using the PSStrategyX trading tool:
General:
— Once the alert is sent, there is no way to monitor positions on any exchange. The order will be processed by the broker connector and sent to the exchange.
While this usually works fine, it's important to check the log for errors.
Sometimes the broker connector may fail to process the order, or the exchange may not process it for various reasons.
— The tool sends TP/SL orders with the entry order when possible to protect your order in case of errors or if you lose a connection.
However, not all exchanges accept TP/SL orders, and sometimes your entry order will be left unprotected.
FIFO:
— This tool DOES NOT support the First In First Out (FIFO) method for closing positions.
— Instead, it uses the ANY method. There currently is no way to make this variable.
█ FAQ
What does PSStrategyX do exactly?
PSStrategyX is a strategy enhancing, backtester, forwardtester, automation and simulation tool. It's NOT a signal generator, and does not produce buy/sell signals by itself. You provide buy/sell signals, and PSStrategyX will put those signals on steroids...basically.
PSStrategyX helps you figure out what indicators actually work. Without wasting time learning how to code.
Why did you choose AutoView for this tool?
AutoView offered the best integration I could find. They allow you to connect to test exchanges for free, which is great for practicing without using real money. They also work without using webhooks, which means you can live trade without paying for Tradingview pro. Additionally, AutoView supports many different exchanges. I don't work for AutoView, but if you sign up through my referral link and purchase a paid version, I earn a commission.
Why doesn't Tradingview automatically connect Pine Script to exchanges?
This is a great question, but unfortunately I don't have the answer. It would definitely be helpful if Tradingview provided this feature, but it might also put some brokers out of business.
How do I get access?
DON'T ask for access in the comments.
DO review the "Authors Instructions" on this page for details.

ZCrypto 3commas - All in oneIntroducing the "3commas All Built-in Indicators in One Script" for TradingView!
Tired of wondering which 3commas-built-in indicators to use and how to combine them? This script is here to make your life easier by answering this question for you.
Instead of spending hours paper trading on 3commas and hoping for the best combined indicator signals, save time and find more accurate results on TradingView.
This indicator combines any of the 3commas-built-in indicators into one signal, allowing you to verify which indicators work best together.
You can combine two or more indicators, up to a maximum of 17, and backtest your combined signal with the Zendog integration - it's simple and easy!
The script includes the following indicators:
• TV Technical Rating x 3
• RSI x 3
• ULT x 1
• BB x 3
• MACD x 2
• MFI x 1
• CCI x 1
• PSAR x 1
• BTC, DXY Filter x 1
• QFL
• Zendog integration
The indicator fires two types of signals: entry signals and exit signals.
To fire entry signals, the script uses the following conditions:
• TV Technical Rating: If the rating is "Buy" or "Strong Buy”, then the signal is fired.
• RSI: If the RSI value is below the RSI threshold, then the signal is fired.
• ULT: If the Ultimate Oscillator value is below the ULT threshold, then the signal is fired.
• BB: If the candle is closed below the channel (lower band), then the signal is fired.
• MACD: If the value of the MACD line is < 0 and the MACD line crosses the Signal line from bottom to top, then the signal is fired.
• MFI: If the candle is closed and its value crosses the MFI threshold from bottom to top, then the signal is fired.
• CCI: If the CCI Value crosses the CCI threshold, then the signal is fired.
• PSAR: If the current price is above the Parabolic SAR, then the signal is fired.
• QFL: If the QFL base (support level) is cracked and the price is <= the crack % of drop, then the signal is fired.
• BTC, DXY Filter: If the current price is higher than the SMA length of Bitcoin (BTC) and the US Dollar Index (DXY) is below it, then the signal is fired.
To fire exit signals, the script uses the following conditions:
• TV Technical Rating: If the rating is "Sell" or "Strong Sell”, then the signal is fired.
• RSI: If the RSI value is above the RSI threshold, then the signal is fired.
• QFL SELL: If the QFL peak (resistance level) is cracked and the price is >= the crack % of pump, then the signal is fired.
to use it with Zendog Backtester here is how you could set it up
Say goodbye to the guessing game and save time with the "3commas All Built-in Indicators in One Script" on TradingView.

CryptoGraph Entry BuilderA complete system to generate buy & sell signals, based on multiple indicators, timeframes and assets
═════════════════════════════════════════════════════════════════════════
🟣 How it works
This indicator allows you to create buy & sell signals, based on multiple trigger conditions, placed in one easy to use TradingView indicator to produce alerts, backtest, reduce risk and increase profitability. This script is especially designed to be used with the CryptoGraph Strategizer indicator. Signals produced by this indicator, can be used as external input with the CryptoGraph Strategizer, by adding both indicators to your chart and selecting "External Input" as entry source in the inputs of the Strategizer indicator. From that point on, buy & sell signals generated by the Entry Builder, will be used for backtesting.
Each trigger or filtering condition is selectable and able to be combined using the selection boxes.
Trigger or filter conditions can be used on a different timeframes, and with different assets or coin pairs. Make sure to set higher timeframe filters, to a higher timeframe than your chart timeframe.
🟣 How to use
• Add the indicator to your chart
• Select an indicator you woud like to use for entry analysis. Combine more indicators for more entry filtering
• Configure entry conditions per indicator. It is recommended to add and configure one indicator at a time
• Analyse your buy/sell entries
• Connect to CryptoGraph Strategizer as external input source for backtesting purposes
🟣 Indicator Filters
• ATR :
Average True Range (ATR) is a tool used in technical analysis to measure volatility .
Possible options for ATR entry filtering are an ATR value greater/smaller than your input variable for trade entries, or the ATR crossing your input variable for trade entries.
This enables the possibility to only enter positions when the market has a certain degree of volatility .
• ADX :
The Average Directional Index ( ADX ) helps traders determine the strength of a trend, not its actual direction. It can be used to find out whether the
market is ranging or starting a new trend.
Possible options for ADX entry filtering are an ADX value greater/smaller than your input variable for trade entries, or the ADX crossing your input variable for trade entries.
• OBV :
The On Balance Volume indicator (OBV) is used in technical analysis to measure buying and selling pressure. It is a cumulative indicator meaning that on days where price went up, that day's volume is added to the cumulative OBV total.
Possible options for OBV entry filtering are Regular, Hidden or Regular&Hidden divergences. Divergence is when the price of an asset is moving in the opposite direction of a technical indicator, such as an oscillator, or is moving contrary to other data. Divergence warns that the current price trend may be weakening, and in some cases may lead to the price changing direction.
• Moving Average :
Moving Average (MA) is a price based, lagging (or reactive) indicator that displays the average price of a security over a set period of time. A Moving Average is a good way to gauge momentum as well as to confirm trends, and define areas of support and resistance .
Possible options for MA entry filtering are price being above/below Moving Average 1, price crossing up/down Moving Average 1, Moving Average 1 being above/below Moving Average 2 and Moving Average 1 crossing up/down Moving Average 2.
• Supertrend :
Supertrend (ST) is a trend-following indicator based on Average True Range (ATR). The calculation of its single line combines trend detection and volatility . It can be used to detect changes in trend direction and to position stops.
Possible options for ST entry filtering are Supertrend being in upward/downward direction, or Supertrend changing direction.
• RSI :
The Relative Strength Index ( RSI ) is a well versed momentum based oscillator which is used to measure the speed (velocity) as well as the change (magnitude) of directional price movements.
Possible options for RSI entry filtering are RSI being smaller/greater than your input value, or RSI crossing up/down your input value.
• Stochastic RSI :
The Stochastic RSI indicator ( Stoch RSI ) is essentially an indicator of an indicator. It is used in technical analysis to provide a stochastic calculation to the RSI indicator. This means that it is a measure of RSI relative to its own high/low range over a user defined period of time.
Possible options for Stoch RSI entry filtering are Stoch RSI crossing below or above your input value.
• VWAP Bands :
Volume Weighted Average Price ( VWAP ) is a technical analysis tool used to measure the average price weighted by volume . VWAP is typically used with intraday charts as a way to determine the general direction of intraday prices.
We use standard deviations, determined by user input, to create VWAP bands.
Possible options for VWAP long entry filtering are: price being below the lower VWAP band, price crossing back up the lower VWAP band or price crossing down the lower VWAP band.
Possible options for VWAP short entry filtering are: price being above the upper VWAP band, price crossing back down the upper VWAP band, or price crossing up the upper VWAP band.
• Bollinger Bands :
Bollinger Bands (BB) are a widely popular technical analysis instrument created by John Bollinger in the early 1980’s. Bollinger Bands consist of a band of three lines which are plotted in relation to security prices. The line in the middle is usually a Simple Moving Average ( SMA ) set to a period of 20 days (the type of trend line and period can be changed by the trader; however a 20 day moving average is by far the most popular).
Possible options for BB long entry filtering are: price being below the lower Bollinger band , price crossing back up the lower Bollinger band or price crossing down the lower Bollinger band .
Possible options for BB short entry filtering are: price being above the upper Bollinger band , price crossing back down the upper Bollinger band , or price crossing up the upper Bollinger band .
• WaveTrend :
WaveTrend (WT) is a smoothed momentum oscillator which enables it to detect true reversals in an accurate manner.
Possible options for WT entry filtering are: Green/red dots below or above a certain WaveTrend value, Regular Divergence, Hidden Divergence and Regular&Hidden Divergence.
