Ping Pong Bot StrategyOverview:
The Ping Pong Bot Strategy is designed for traders who focus on scalping and short-term opportunities using support and resistance levels. This strategy identifies potential buy entries when the price reaches a key support area and shows bullish momentum (a green bar). It aims to capitalize on small price movements with predefined risk management and take profit levels, making it suitable for active traders looking to maximize quick trades in trending or ranging markets.
How It Works:
Support & Resistance Calculation:
The strategy dynamically identifies support and resistance levels using the lowest and highest price points over a user-defined period. These levels help pinpoint potential price reversal areas, guiding traders on where to enter or exit trades.
Buy Entry Criteria:
A buy signal is triggered when the closing price is at or below the support level, and the bar is green (i.e., the closing price is higher than the opening price). This ensures that entries are made when prices show signs of upward momentum after hitting support.
Risk Management:
For each trade, a stop loss is calculated based on a user-defined risk percentage, helping to protect against significant drawdowns. Additionally, a take profit level is set at a ratio relative to the risk, ensuring a disciplined approach to exit points.
0.5% Take Profit Target:
The strategy also includes a 0.5% quick take profit target, indicated by an orange arrow when reached. This feature helps traders lock in small gains rapidly, making it ideal for volatile market conditions.
Customizable Inputs:
Length: Adjusts the period for calculating support and resistance levels.
Risk-Reward Ratio: Allows traders to set the desired risk-to-reward ratio for each trade.
Risk Percentage: Defines the risk tolerance for stop loss calculations.
Take Profit Target: Enables the customization of the quick take profit target.
Ideal For:
Traders who prefer an active trading style and want to leverage support and resistance levels for precise entries and exits. This strategy is particularly useful in markets that experience frequent price bounces between support and resistance, allowing traders to "ping pong" between these levels for profitable trades.
Note:
This strategy is developed mainly for the 5-minute chart and has not been tested on longer time frames. Users should perform their own testing and adjustments if using it on different time frames.
3commas

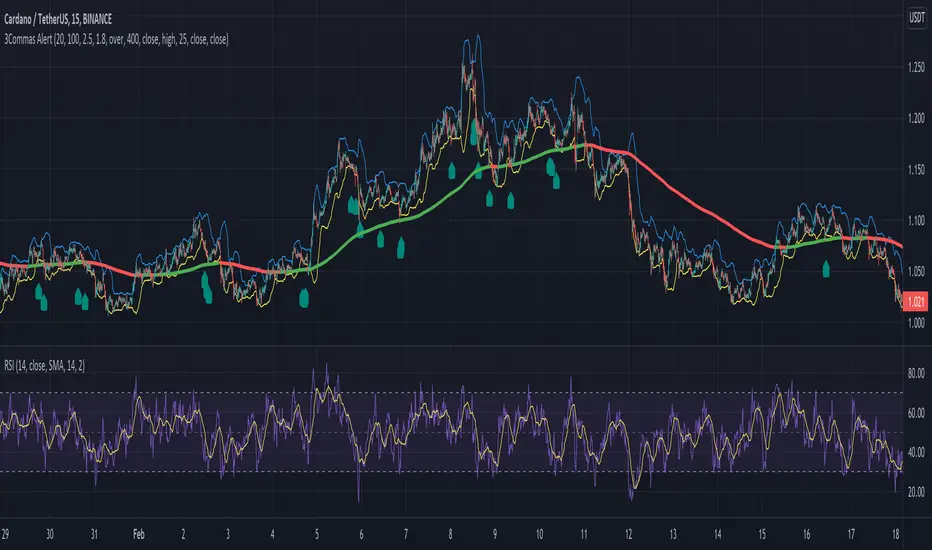
Buy / Sell indicator light version [Crypto_BCT]The indicator is based on the search for the lowest bars in a given period (can be customized).
You can add a search for the highest bars to determine the closed order points.
You can add a filter by the value of the RSI (you can customized it separately for buying and selling).
Alerts for buying and selling are set.
It can be used to work with bots, for example 3COMMAS DCA bot.
--------------------------
Signal Condition Settings:
(Buy) Lowest Bar
The closing of the current bar is lower than the closing of the bars back in this range
(Buy) RSI value <
The RSI index is below this value
(Sell) Highest Bar
The closing of the current bar is higher than the closing of bars in this range
(Sell) RSI value >
The RSI index is higher than this value

Buy / Sell alert indicator [Crypto_BCT]Hello everyone!
I bring to your attention a indicator to determine the point of buy and sell purchase.
It is based on oscillators and a moving average.
It can be used to work with bots, for example 3COMMAS DCA bot.
Signal Condition Settings:
ATR
The current candle is larger than the ATR for this period
EMA
The signal is necessarily below (for buy) and above (for sell) the EMA of the specified period
(Buy) RSI low
The RSI index is below this value
(Sell) RSI High
The RSI index is higher than this value
(Buy) MFI low
The MFI index is below this value
(Sell) MFI High
The MFI index is higher than this value
(Buy) CCI low
CCI index is below this value
(Sell) CCI High
The CCI index is higher than this value
(Buy) Lowest bar from
The closing of the current bar is lower than the closing of the bars back in this range
(Sell) Highest bar from
The closing of the current bar is higher than the closing of bars in this range
(Buy) Lowest EMA bar ago
During a given distance back, the EMA value only decreased
(Sell) Highest EMA bar ago
At a given distance back, the EMA value only increased
I hope it will be useful!

Buy alert [Crypto_BCT]Hello everyone!
I bring to your attention a simple indicator to determine the point of purchase.
It is based on oscillators and a moving average.
It can be used to work with bots, for example 3COMMAS DCA bot.
Signal Condition Settings:
ATR
The current candle is larger than the ATR for this period
EMA
The signal is necessarily below the EMA of the specified period
MFI low
The MFI index is below this value
CCI low
CCI index is below this value
RSI low
The RSI index is below this value
Lowest bar from
The closing of the current bar is lower than the closing of the bars back in this range
Lowest EMA bar ago
During a given distance back, the EMA value only decreased
I hope it will be useful!

3commas GRID bot VisualisationHello everyone
This is a grid display indicator for a 3-comma grid bot.
Just enter the upper and lower borders of your grid and the number of grid cells in the indicator settings.
It's simple!
Argo II - (alerts for 3commas composite bots) - publicThis script lets users create BUY/SELL alerts for 3commas composite bots (1 alert = 12 pairs) in a simple way, based on a built in set of indicators that can be tweaked to work together or alone through the study settings.
There is a version of this script for single pair bots, with slightly more features here .
If the user choses to create both BUY and SELL signals from the study settings, the (1) alert created will send both BUY and SELL signals for all 12 pairs selected. At this stage, the script forces the user to select 12 pairs in the study settings. If less pairs are inserted, it will not work. Also, the script will only send alerts for the pairs selected in the study settings, not for the current chart (if different).
How to use:
- Add the script to the current chart
- Open the study settings , insert bot details and select 12 pairs. You should write the pairs manually, using the format BTC , ADA, ETH, etc. They MUST be in capital letters or 3commas will not recognize them.
- Still in the study settings, tweak the deal start/close conditions from various indicators until happy. The study will plot the entry / exit points below the current chart (1 = buy, 2 = sell)
- Make sure your strategy works for all the pairs you have selected, simply by checking each chart with the same study settings
- When happy, right click on the "..." next to the study name, then "Add alert'".
- Under "Condition", on the second line, chose "Any alert () function call". Add the webhook from 3commas, give it a name, and "create".
That's it.
Notes:
- If you insert coins that are not available for the quote currency and exchange of your choosing, the script will not work and return an error.
- Make sure you run tests with paper trading or dummy bots (i.e without actual bot ID) to ensure your alerts trigger as intended on all coins.
- If alerts trigger too much (i.e they all trigger at the same time for all coins), Trading View will stop the alert. So probably not ideal for a scalping bot. It could also be the sign the script doesn't work as intended.
- The script is a bit slow on my side. I am a beginner in pinescript, so if anyone knows how to simplify it, please let me know.
- if anyone knows how to tell the script to function with less than 12 pairs (when not filling the 12 fields in the setting), please also let me know :)
Mid to High daily % - MA & ThresholdPurpose of this script is to provide a metric for comparing crypto volatility in terms of the % gain that can be garnished if you buy the midpoint price of the day and sell the high***. I'm specifically using bots that buy non-stop. This metric makes it easy to compare crypto coins while also providing insight on what a take profit % should be if I want to be sure it closes often instead of getting stuck in a position.
Added a few moving averages of (Mid-range to High Daily %). When these lines starts to trend down, it's time to lower the take profit % or move on to the next coin.
Decided to add a threshold so I could easily mark where I think the (Mid-range to High Daily %) is for most days.
Ex. I can mark 10% threshold and can eyeball roughly ~75% of the days in the past month or so were at or above that level. Then I know I have plenty volatility for a bot taking 5% profit. Also if you have plenty of periodic poke-through that month (let's say once a week) you might argue that you can set it to 7% if you're willing to wait about that long. Either way this metric is conservative because it is only the middle of the range to the high, a less conservative version might provide the % gain if you bought the day low and sold the day high.
***Since this calculation only takes the middle of the range and the high of the day into account, red days are volatile against a buyer but to your advantage if you are a seller. BUT if you have plenty of safety buy orders this volatility in price only means your total purchase volume increases and when/if you reach a take profit level you sell more there.
Would like to upgrade and add a separate MA line for green days and a separate MA line for red days to discern if that particular coin has a bias. Also would like to include some statistics on how many candles are above or below threshold for a certain period instead of eyeballing.

Dump AlertsNYSE:BRK.B
By popular demand: An inverted version of my first indicator Pump Alerts in Pine Script with two alert conditions for trading bots and automated stock trading setups.
It's originally based on "Pump Catcher" by @joepegler
I modified some parts, hopefully improved the usability and enabled alerts, so you can use it to trigger bots like 3commas via webhooks or stock brokers partnering with TradingView.
Dump Alerts 📉 attempts to detect moments of abnormal and accelerating increase in volume concurrent with falling prices AKA "dumps". Small and big dumps.
I recommend trying different timeframes and tinkering with the lookback period as well as both threshold values.
Other than that it's pretty self-explanatory and beginner-friendly.
Free and Open Source. Let me know how you use it!

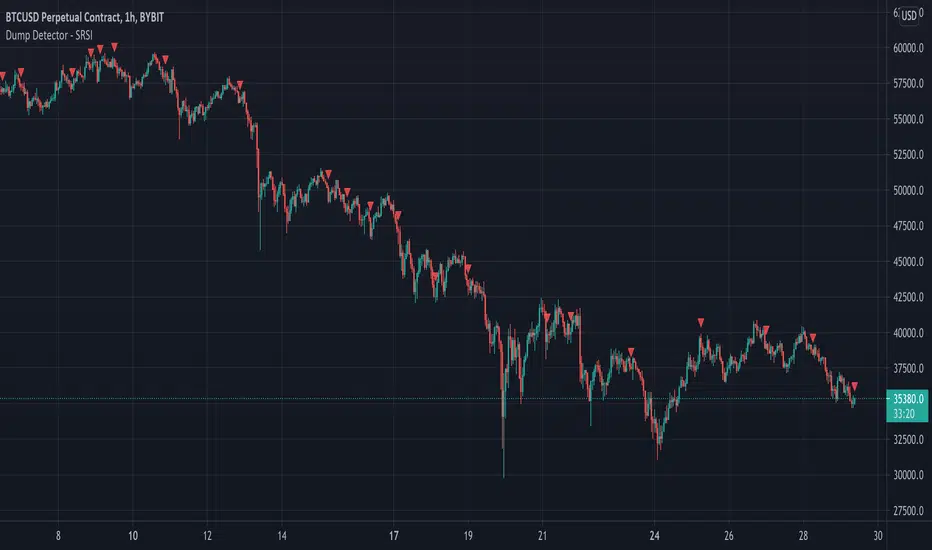
Dump Detector - Stochastic RSIDump Detecter uses Stochastic RSI to detect dumps/downtrends. Can be used as an exit trigger for long bots or an entry trigger for short bots. Change settings to lower timeframe for scalping. Pump signals can be turned on with tickbox.
Default Settings are not the usual Stochastic RSI setup and have been tuned to bitcoin 3hr chart:
Timeframe = 3hrs
smoothK = 3
smoothD = 3
lengthRSI = 6
lengthStoch = 27
src = close
Alert for 3Commas Bollinger StrategyThis is just an alert for the 3Commas Bollinger Strategy written by tedwardd
Bollinger Bands + RSI Alerts for 3commas/DCA botHey Folks !
This is in indicator that generates buy alerts combining Bollinger Bands and RSI.
RSI validates the BB signal by confirming we are not in an oversold area.
Interval: 3m to 15m
Recommended settings for 3commas DCA bot
- TP/TTP: 0.3%/0.1%,
- Base Order: Your choice ,
- Safety Order: 1.2 * Your choice of base order
- Safety Order Volume Scale: 1.2,
- Safety Order Step Scale: 1.5,
- Price Deviation to Open Safety Order (% from initial order): 0.25%,
- Max Safety Trades Count: 7
- DO NOT USE STOP LOSS
> Create Alert with Buy Alert and link it to "Message for deal start signal"

Parabolic SAR with Volatility Filter: Buy Alerts for 3commasHey folks and fellow 3commas users !
Here is a new signal generator for your DCA bot on 3commas.
This is a classic Parabolic SAR indicator with a filter for volatility.
NOTE: This is a repainting strategy by design. Recommended to use with "Once per bar" alert style for PSAR

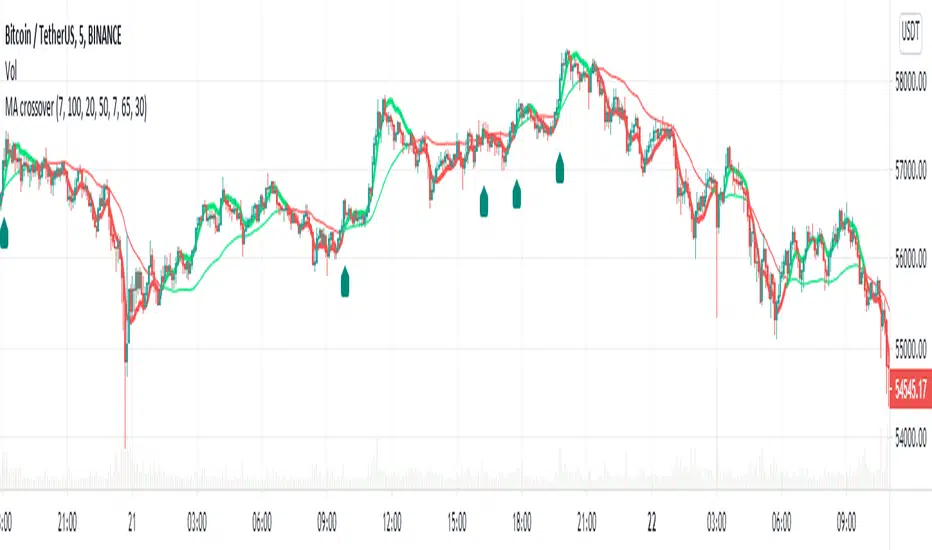
MA Crossover Alerts for Small Quick Profits on 3commas/DCA botDear fellow 3commas users,
This is a the most basic Moving Average crossover technique generating Buy Alerts.
This is especially written for those of you who want to link this basic crossover strategy with your 3commas DCA bot .
Buy Alerts
Moving averages available:
- Simple Moving Average (SMA)
- Exponential Moving Average (EMA)
- Weighted Moving Average (WMA)
- Hull Moving Average (HullMA)
- Volume Weighted Moving Average (VMWA)
- Running Moving Average (RMA)
- Triple Exponential Moving Average (TEMA)
Recommended settings for using with 3commas DCA bot:
Interval:
3m to 15m
3commas bot setup:
- TP/TTP: 0.3%/0.1%,
- Base Order: Your choice ,
- Safety Order: 1.2 * Base order
- Safety Order Volume Scale: 1.2,
- Safety Order Step Scale: 1.5,
- Max Active Deals: Your choice ,
- Price Deviation to Open Safety Order (% from initial order): 0.2%,
- Max Safety Trades Count: 7,
- Simulatenous Deals per Same Pair: 3
> Create Alert with Buy Alert and link it to your bot "Message for deal start signal"
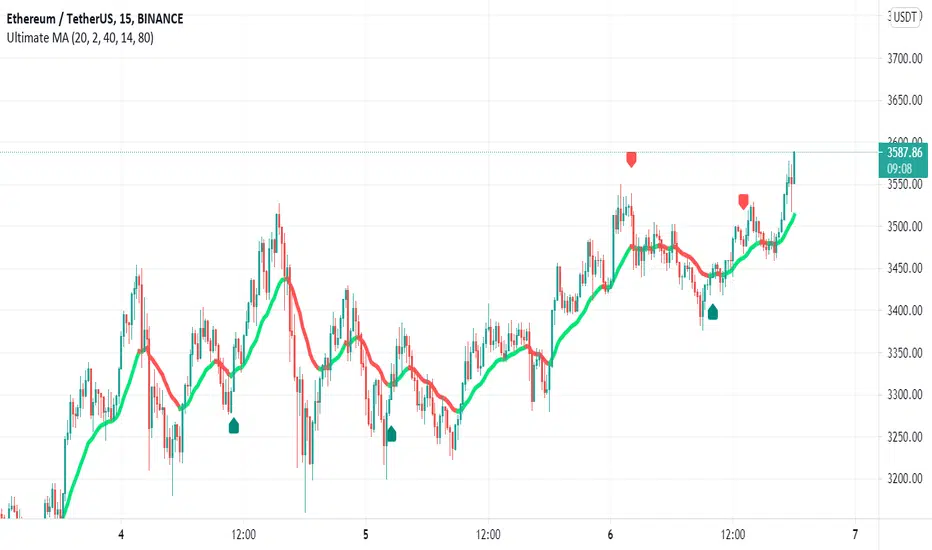
Ultimate MA + MFIHey Folks, this is in indicator that generates buy and sell alerts using Ultimate Moving Average and Money Flow Index.
Buy Alerts
Multi Time Frame Moving Average trend reversal AND MFI < threshold
Sell Alerts
MFI crossing under overbought threshold
Recommended settings for 3commas
- Create Alert with Buy Alert and link it to "Message for deal start signal"
- Create Alert with Sell Alert and link it to "Message to close all deals at Market Price"
- Set Take Profit to 1.0% with trailing between 0.2% and 0.6%
- DO NOT USE STOP LOSS
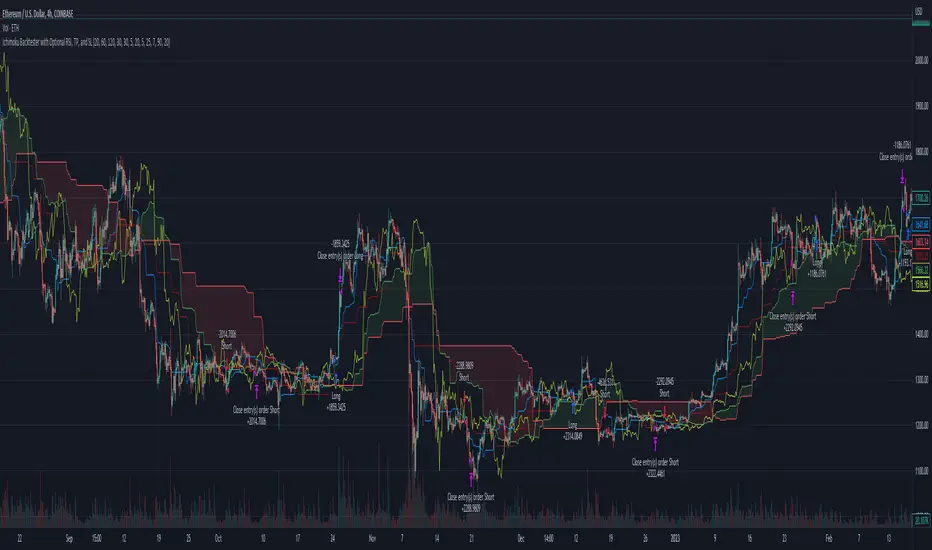
Ichimoku Basic AlertsStarted with Ichimoku Kinko Hyo by Mizuki32. Converted to study and added alerting and cloud confirmation.
BoilerRoomColdCaller - 3Commas Grid Bot SignalThis is very similar to 3Commas' grid bot, the range is from the previous 7 days' lowest low decreased by 3% to the previous 7 days' highest high increased by 3%, you can also adjust if you want 7 days' highest/lowest close price as your range or highest high and lowest low as your range. 10 buys and 10 sells within the range, the unit price would be (high-low)/19.
The buy signals and the sell signals will be triggered if:
- The previous close is below one specific green line (buy line), and the current close is above that specific green line, or
- The previous close is above one specific green line (buy line), and the current close is below that specific green line
Thus, whether the price is dropping below these lines or rising above these lines, a buy or sell signal will be triggered when they cross green or red lines. Your entry price will be the next open price after this candle's close reaches the lines.
Big thanks to @glaz, who helped me a lot with this script. Please give a like button and share if you like this script. Let me know if you have questions, thanks guys.

Pump AlertsMy very first indicator in Pine Script with two alert conditions for trading bots.
It's based on " Pump Catcher " by @ joepegler
I modified some parts, hopefully improved the usability and enabled alerts, so you can use it to trigger bots like 3commas via webhooks.
Pump Alerts 🚀 attempts to "detect moments of abnormal and accelerating increase in volume" AKA "pumps". Small and big pumps.
I recommend using it on small timeframes like 1 to 15 min and tinkering with the lookback period as well as threshold values.
Other than that it's pretty self-explanatory and beginner-friendly.
Free and Open Source. Let me know how you use it!

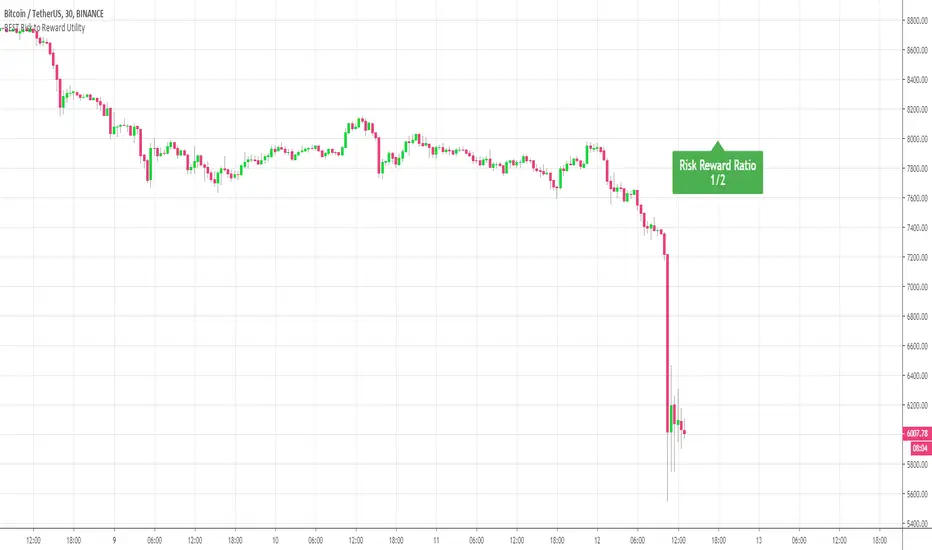
BEST Risk to Reward UtilityHello Traders
This is a proof of concept and a cool pinescript utility
It displays a risk to reward division as a fractional value.
For example
Risk: 300
Reward: 600
This will be displayed as 1/2 as we can earn 2 units for a potential loss of 1 unit
(600/300 = 2) for those wondering the NASA level mathematics behind :)
Best regards
Dave
Best Ichimoku ScreenerHello traders
Continuing deeper and stronger with the screeners' educational series one more time
I - Concept
This screener detects whether the price goes above, below or stays in between the Ichimoku cloud
II - How did I set the screener
The visual signals are as follow:
- square: Above or Below
Then the colors are:
- green when above the cloud
- red when below the cloud
- orange when in the cloud
Best regards,
Dave

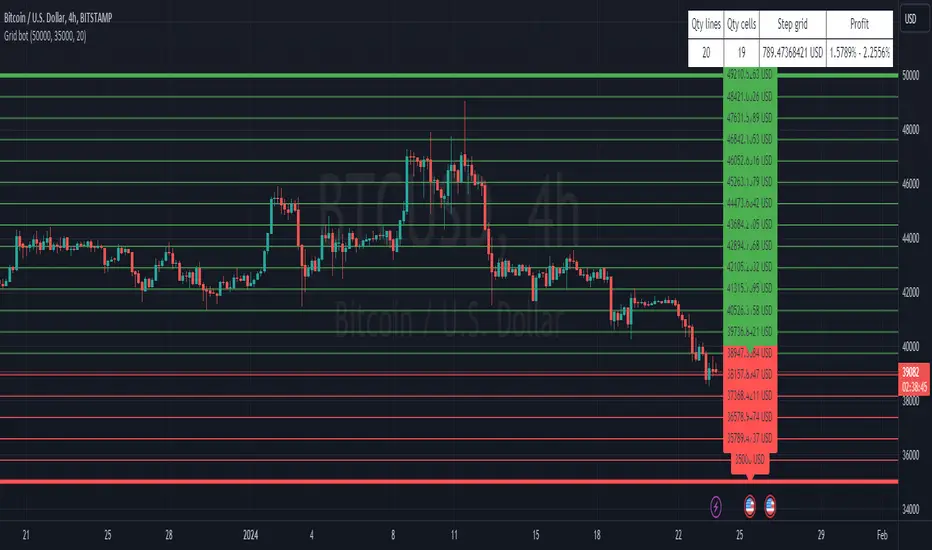
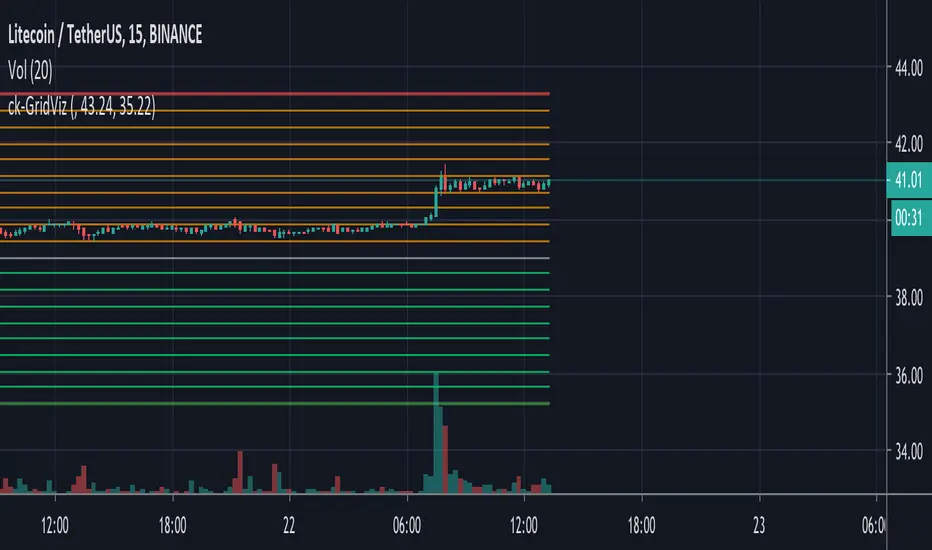
ck - 3commas GRID bot VisualisationHi,
This is a very quick script indicator to show the “grid” for an active (or one you are planning to manually configure) 3commas Grid bot.
To use, you’ll need to go to your Grid bot page in 3commas and enter the Upper and Lower Limit Values, either from the “manual” section if you are planning a new Grid bot, or from an open Grid trade by clicking the monthly button and using the Upper value (in green) and the Lower value (in red).
Have fun!
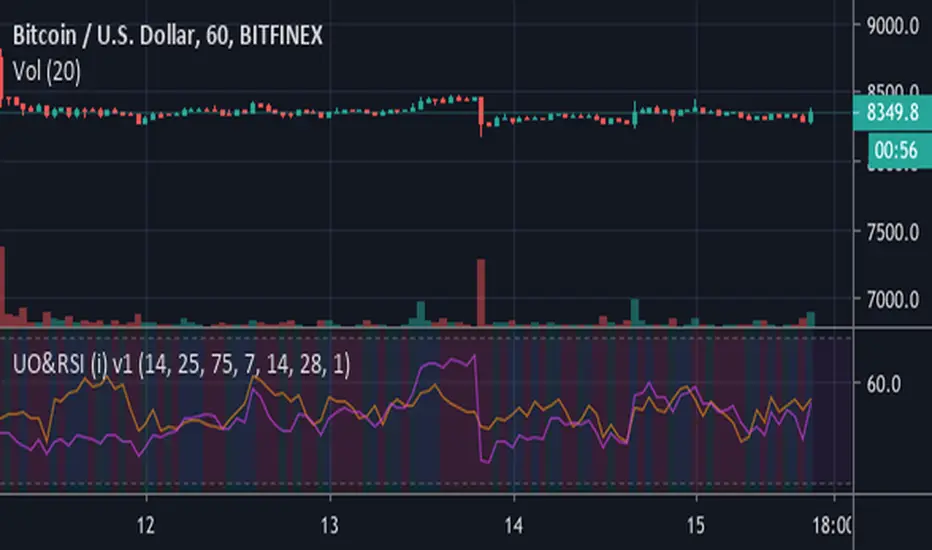
ck - Ultimate Oscillator & RSI Indicator v1Hi,
This is an indicator that combines the Ultimate Oscillator with RSI.
Currently it displays signals on the screen when the RSI crosses from low to high (to open and close a long) and vice versa for short signals.
Further signals will be developed for Ultimate Oscillator longs/shorts.
Stay tuned!
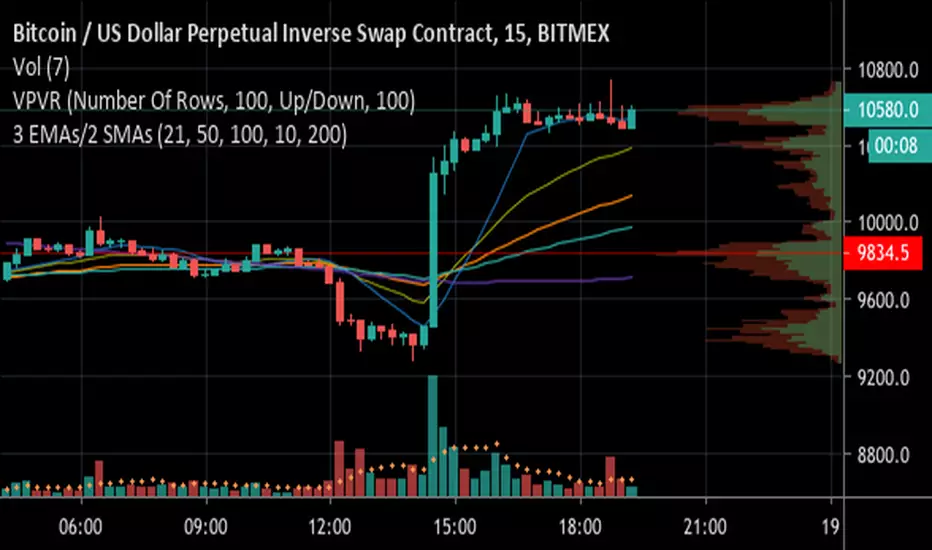
3 EMAs with Crossing Alerts & 2 SMAsHi all,
This is a simple indicator that plots 3 EMA lines and 2MAs of your choice to the screen and has built in alert triggers.
Features:
1) Alerts are triggered when EMAs 1 (Signal line) and 2 (Baseline) cross - a Long signal is called if the cross is above EMA 3 ( Trendline ), a short if the cross is below EMA3
2) Signals are represented visually as a triangle on the chart, below the candles is a long, above is a short
3) TradingView Alerts can be easily set as I have labelled the signals clearly as many other Indicators like this aren’t easy to work out if trying to create alerts to trigger a 3commas bot, for example!
Each EMA is fully customisable and if you wish to take advantage of the alerts, only a few simple rules need to be followed:
EMA1 needs to be less than EMA2.
EMA2 needs to be the same or greater than EMA3
That’s it, happy trading!
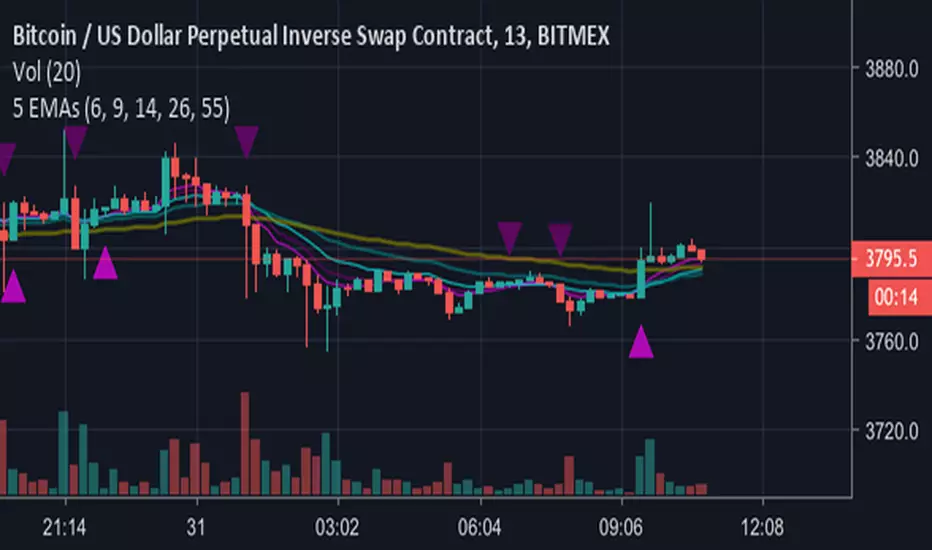
5 EMAs plus Crossing AlertsHi all,
This is a simple indicator that plots 5 EMA lines of your choice to the screen.
Can be used to trigger scalping Bots (stoploss around 0.5% recommended, take profit 1% or higher, please backtest!)
Also can be used for manual scalping, 1 or 2 candles at a time.
Features:
1) Alerts are triggered when EMAs 1 (Signal line) and 2 (Baseline) cross - a Long signal is called if the cross is above EMA 3 (Trendline), a short if the cross is below EMA3
2) Signals are represented visually as a triangle on the chart, below the candles is a long, above is a short
3) TradingView Alerts can be easily set as I have labelled the signals clearly as many other Indicators like this aren’t easy to work out if trying to create alerts to trigger a 3commas bot, for example!
Each EMA is fully customisable and if you wish to take advantage of the alerts, only a few simple rules need to be followed:
EMA1 needs to be less than EMA2.
EMA2 needs to be the same or greater than EMA3
That’s it, happy trading!
Big shout out to B and the gang over at Crypto Trading Group!